. 2025 Mar 7;14(6):389.
doi: 10.3390/cells14060389.

Anti-Tumor Effects of Cecropin A and Drosocin Incorporated into Macrophage-like Cells Against Hematopoietic Tumors in Drosophila mxc Mutants

Affiliations

Anti-Tumor Effects of Cecropin A and Drosocin Incorporated into Macrophage-like Cells Against Hematopoietic Tumors in Drosophila mxc Mutants

Marina Hirata et al. Cells. .

Abstract

Five major antimicrobial peptides (AMPs) in Drosophila are induced in multiple sex combs (mxc) mutant larvae harboring lymph gland (LG) tumors, and they exhibit anti-tumor effects. The effects of other well-known AMPs, Cecropin A and Drosocin, remain unexplored. We investigated the tumor-elimination mechanism of these AMPs. A half-dose reduction in either the Toll or Imd gene reduced the induction of these AMPs and enhanced tumor growth in mxcmbn1 mutant larvae, indicating that their anti-tumor effects depend on the innate immune pathway. Overexpression of these AMPs in the fat body suppressed tumor growth without affecting cell proliferation. Apoptosis was promoted in the mutant but not in normal LGs. Conversely, knockdown of them inhibited apoptosis and enhanced tumor growth; therefore, they inhibit LG tumor growth by inducing apoptosis. The AMPs from the fat body were incorporated into the hemocytes of mutant but not normal larvae. Another AMP, Drosomycin, was taken up via phagocytosis factors. Enhanced phosphatidylserine signals were observed on the tumor surface. Inhibition of the signals exposed on the cell surface enhanced tumor growth. AMPs may target phosphatidylserine in tumors to induce apoptosis and execute their tumor-specific effects. AMPs could be beneficial anti-cancer drugs with minimal side effects for clinical development.

Keywords: Drosophila tumor; antimicrobial peptides (AMPs); apoptosis; endocytosis; hemocytes; phosphatidylserine.


Conflict of interest statement

The authors declare no conflicts of interest.

Figures

Figure 1
Figure 1
The expression of Dro-GFP and CecA1-GFP reporters in the fat body (FB) of mxcmbn1 mutant larvae: (a,b) Bright-field (BF) stereomicroscopic images of the FB of mature third-instar larvae carrying the Drosocin (Dro)-GFP reporter. Scale bars: 500 µm. (a′,b′) Green fluorescent protein (GFP) fluorescence images of the FB of mature third-instar larvae with the Dro-GFP reporter. (c,d) BF stereomicroscopic images of the FB in a mature third-instar larva carrying the Cecropin A1 (CecA1)-GFP reporter. (c′,d′) GFP fluorescence images of the FB of the larvae with the CecA1-GFP reporter. (a,c) Normal control (w/Y) and (b,d) mxcmbn1 mutant (mxcmbn1/Y) larvae. (e,f) mRNA quantification of Dro and CecA1 using quantitative reverse transcription-PCR (qRT-PCR). The X-axis of each graph shows the mRNA levels of the normal control (w/Y) and mxcmbn1 (mxcmbn1/Y) larvae from left to right; the Y-axis shows the mRNA levels of the target gene relative to the endogenous control gene (Rp49). (e,f) mRNA levels of the Dro (e) and CecA1 (f) genes. Significant differences between the experimental groups were determined using Welch′s t-test (* p < 0.05, ns: not significant). The error bars indicate the standard error of the mean (SEM).
Figure 2
Figure 2
The mRNA levels of Dro and CecA genes in the fat body and the LG tumor size of mxcmbn1 larvae heterozygous for mutations of the genes encoding the factors in innate immune pathways: (a,b) Quantification of mRNA levels of the Dro gene encoding Drosocin and the CecA1 gene encoding Cecropin A using qRT-PCR. X-axis of each graph shows mRNA levels of mxcmbn1 larvae, mutant larvae heterozygous for Toll1-RXA mutation, and mutant larvae heterozygous for imd1 mutation from left to right. Y-axis shows relative mRNA level of each target gene ((a) Dro, or (b) CecA1) to an endogenous control gene (Rp49). Significant differences between the groups were determined via one-way ANOVA for multiple comparisons (** p < 0.01, **** p < 0.0001, n = 3). The error bars indicate SEM. (cf) DAPI-stained images of lymph glands (LGs) excised from male mature third-instar larvae. Shown are (c) normal control larvae, (d) mxcmbn1 larvae, and (e,f) mutant larvae heterozygous for Toll1-RXA (e) and imd1 (f) mutations, respectively. Scale bars: 100 µm. (g) Quantification graph indicates LG size of larvae with each genotype. Significant differences between the groups were determined using one-way ANOVA for multiple comparisons (*** p < 0.001, **** p < 0.0001). The red lines indicate mean LG size; the error bars indicate SEM.
Figure 3
Figure 3
Observation of lymph glands (LGs) from mxcmbn1 larvae and quantification of their size via induction of Dro or CecA1 overexpression (OE) in a fat body (FB)-specific manner: (af) Fluorescence images of DAPI-stained LGs collected from mature third-instar larvae. (a) Pair of LGs from a normal control larva (w/Y; r4>+). (b) LG from control larvae with FB-specific overexpression of Dro (w/Y; r4>Dro) or (c) CecA1 (w/Y; r4>CecA1). Pair of LGs from (d) mxcmbn1 larva (mxcmbn1/Y; r4>+), (e) mxcmbn1 larvae with FB-specific expression of Dro (mxcmbn1/Y; r4>Dro) or (f) CecA1 (mxcmbn1/Y; r4>CecA1). Scale bars: 100 µm. (g) LG size quantification in larvae with FB-specific expression of Dro (w/Y; r4>+ (n = 20), w/Y; r4>Dro (n = 20), mxcmbn1/Y; r4>+ (n = 20), mxcmbn1/Y; r4>Dro (n = 20)), and CecA1 ((w/Y (n = 20), w/Y; r4>CecA1 (n = 20), mxcmbn1/Y; r4>+ (n = 20), mxcmbn1/Y; r4>CecA1 (n = 20)). Significant differences between the groups were determined using one-way ANOVA for multiple comparisons (**** p < 0.0001, ns: not significant). The red lines indicate the mean LG size; the error bars indicate SEM.
Figure 4
Figure 4
Observation and quantification of apoptosis areas in LGs of mxcmbn1 larvae with FB (FB)-specific overexpression (OE) of Dro or CecA1: (af) Immunostaining of LGs with anti-cDcp1 antibody that recognizes apoptotic cells in LGs from the third instar-stage mature larvae. (a) Pair of LGs from control larvae (w/Y; r4>+). (b) Control larvae overexpressing Dro (w/Y; r4>Dro), or (c) CecA1 (w/Y; r4>CecA1) specifically in FB. (d) Anterior lobes of pair of LGs from mxcmbn1 larvae (mxcmbn1/Y; r4>+). (e) mxcmbn1 larvae overexpressing Dro (mxcmbn1/Y; r4>Dro) or (f) CecA1 (mxcmbn1/Y; r4>CecA1). Blue indicates DNA staining; green in (af) and (a′f′) indicates anti-cDcp1 immunostaining signals. Scale bars: 100 µm. (g) Percentage of areas occupied by apoptotic cells in lobe regions of LGs from larvae with FB-specific Dro overexpression (n = 21 LGs from 11 larvae) or CecA1 (n = 24 LGs from 12 larvae). Significant differences between the groups were determined using one-way ANOVA for multiple comparisons (* p < 0.05, *** p < 0.001, **** p < 0.0001, ns: not significant). Red line indicates the mean percentage of apoptosis. The error bars indicate SEM.
Figure 5
Figure 5
Quantification of LG sizes in mxcmbn1 larvae with FB-specific knockdown of Dro or CecA1: (af) DAPI-stained images of LGs from mature third-instar larvae. (ac) LGs expressing dsRNAs against mRNAs for (a) GFP (w/Y; r4>GFPRNAi) (control), (b) Dro (w/Y; r4>DroRNAi), or (c) CecA1 (w/Y; r4>CecA1RNAi) specifically in FB are shown. (df) LGs expressing dsRNAs against (d) GFP in FB of mxcmbn1 larvae (mxcmbn1/Y; r4>GFPRNAi), (e) Dro (mxcmbn1/Y; r4>DroRNAi) or (f) CecA1 (mxcmbn1/Y; r4>CecA1RNAi). Scale bars: 100 µm. (g) Quantification graphs of the LG size in larvae of each genotype have. LG size of larvae with DroRNAi (n = 15 LGs from 8 larvae) and CecA1RNAi (n = 13 LGs from 7 larvae). Significant differences between the groups were determined using one-way ANOVA for multiple comparisons (** p < 0.01, *** p < 0.001, **** p < 0.0001, ns: not significant). The red lines indicate mean LG size. The error bars indicate SEM.
Figure 6
Figure 6
Apoptosis observation and quantification in LGs of mxcmbn1 larvae with FB-specific knockdown of Dro or CecA1: (af) Immunostaining of LGs with anti-cDcp1 antibody that recognizes apoptotic cells. LGs expressing dsRNA against mRNAs for (a) GFP (w/Y; r4>GFPRNAi), (b) Dro (w/Y; r4>DroRNAi), or (c) CecA1 (w/Y; r4>CecA1RNAi) specifically in FB are shown. (df) LG expressing dsRNA against (d) GFP specifically in FB of mxcmbn1 larvae (mxcmbn1/Y; r4>GFPRNAi), (e) Dro (mxcmbn1/Y; r4>DroRNAi), or (f) CecA1 (mxcmbn1/Y; r4>CecA1RNAi) are shown. Blue indicates DNA staining; green in (af) and (a′f′) indicates anti-cDcp1 immunostaining signals. Scale bars: 100 µm. (g) Graphs indicate percentage of apoptotic cells in LG lobe regions of larvae with FB-specific depletion of Dro (n = 15 LGs from 8 larvae) or CecA1 (n = 13 LGs from 7 larvae). Significant differences between the groups were determined using one-way ANOVA for multiple comparisons (**** p < 0.0001, ns: not significant). The red line indicates the mean percentage of apoptosis. The error bars indicate SEM.
Figure 7
Figure 7
Apoptosis area quantification in mxcmbn1 larvae LGs after synthetic cecropin A peptide injection: (ad) Immunostaining of LGs in control (a,c) and mxcmbn1 (b,d) larvae with anti-cDcp1 antibody that recognizes apoptotic cells. Third-instar larvae injected with PBS (control; (a,b)) or synthetic cecropin A (c,d) dissolved in PBS. Green in (a”d”) indicates signal of anti-cDcp1 immunostaining, and blue (white in (a′d′)) indicates DNA staining. Scale bars: 100 µm. (e) Quantification graphs indicate percentage of apoptotic cells in LG lobe regions after injecting PBS (n = 5 LGs from 3 w/Y and n = 22 LGs from 11 mxcmbn1/Y larvae), and cecropin A (n = 7 LGs from 4 w/Y and n = 8 LGs from 4 mxcmbn1/Y larvae). Significant differences were determined using one-way ANOVA for multiple comparisons (** p < 0.01, ns: not significant). The red line indicates mean percentage of apoptosis. The error bars indicate SEM.
Figure 8
Figure 8
Observation of circulating hemocytes containing HA-tagged Cecropin A produced in the FB in control and mxcmbn1 larvae: (a,b) Merged images of anti-HA immunostaining and DNA staining of circulating hemocytes in normal (w/Y; r4>CecA1-HA) (a) and mxcmbn1 larvae (mxcmbn1/Y; r4>CecA1-HA) (b) expressing Cecropin A-HA in the FB. Green in (a,b,a″,b″), fluorescence of anti-HA immunostaining; magenta in (a,b), DNA staining (white in a′,b′). Magnified image of hemocyte indicated with an arrow is presented in insets in (b″). Bright-field (BF) images (a‴,b‴). Scale bars: 10 µm. (c) Percentages of hemocytes harboring HA-tagged Cecropin A in control and mxcmbn1 larvae. Significant differences were determined using Welch′s t-test (**** p < 0.0001, n = 20). The error bars indicate SEM.
Figure 9
Figure 9
Observation and quantification of hemocytes in which GFP-tagged Drosomycin was incorporated in control and mxcmbn1 larvae: (a,b) GFP fluorescence of circulating hemocytes to detect GFP-tagged Drosomycin (a,b), induced in the FB of control (w, Drs::GFP/Y) (a) and mxcmbn1 (mxcmbn1, Drs::GFP/Y) (b) larvae. (c,d) GFP fluorescence indicating GFP-tagged Drosomycin in circulating hemocytes of mutant larvae with hemocyte-specific knockdown of draper (mxcmbn1, Drs::GFP/Y; He>drprRNAi) (c), or shark (mxcmbn1, Drs::GFP/Y; He>sharkRNAi) (d). Circulating hemocytes with GFP-tagged Drosomycin (Drs::GFP) are colored in green in (ad,a″d″). DNA is magenta in (ad) (white in (a′d′)). Bright-field (BF) images (a‴d‴). Scale bars: 10 µm. (e) Percentages of hemocytes with GFP-tagged Drosomycin in control and mxcmbn1 larvae. X-axis from left to right: control larvae expressing GFP-tagged Drosomycin under its promoter (w, Drs::GFP/Y (n = 374 hemocytes (6 larvae)), mxcmbn1, Drs::GFP/Y (n = 1021 (8)), mxcmbn1, Drs::GFP/Y; He>drprRNAi (n = 2098 (8)), and mxcmbn1, Drs::GFP/Y; He>sharkRNAi (n = 1193 (6)). Significant differences were determined using one-way ANOVA for multiple comparisons (**** p < 0.0001). The error bars indicate SEM.
Figure 10
Figure 10
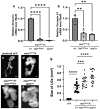
Detection of phosphatidylserine (PS) exposed on cell surface of lymph gland (LG) tumors in control and mxcmbn1 larvae: (a,b) DAPI-stained fluorescence images of LGs from larvae at the third instar stage: (a) normal control; (b) mxcmbn1 mutant. Blue in a,b (white in (a′,b′)) indicates DNA staining and green in (a,b) and (a″,b″) indicates Annexin V-GFP signal. Scale bars: 100 µm. (c) Quantification graph indicating percentage of GFP fluorescent regions in LGs, indicative of Annexin V binding. Significant differences were determined using Welch’s t-test (**** p < 0.0001, n = 16). The red line indicates mean percentage. The error bars indicate SEM.
Figure 11
Figure 11
Loss of PS on the surface of LG cells via Xkr scramblase knockdown and its influence on LG hyperplasia in mxcmbn1 larvae: (ac) DAPI-stained anterior lobes and fluorescence indicating Alexa 594-Annexin V binding to PS on the LG lobes in normal control (w/Y) larvae (a), mxcmbn1 larvae with the ectopic expression of control dsRNA in the medulla zone in primary lobes of the LG (mxcmbn1/Y; upd3>GFPRNAi) (b), mxcmbn1 larvae with the depletion of xkr mRNA (mxcmbn1/Y; upd3>xkrRNAi), and (c) larvae at the third instar stage. DNA is stained in blue in (ac) (white in (a′c′)), and Alexa594-Annexin-V is in magenta in (ac,a″c″). Scale bars: 100 μm. (d) Quantification of the LG size of mxcmbn1 larvae with xkr depletion in LG tumor cells. The average LG size was calculated among the controls (w/Y) (n = 9 LGs (5 larvae)), mxcmbn1/Y; upd3>GFPRNAi (n = 16 (8)), and mxcmbn1/Y; upd3>xkrRNAi (n = 28 (14)). Significant differences were determined using one-way ANOVA for multiple comparisons (* p < 0.05). The red lines indicate the mean percentage of apoptosis or the mean LG size. The error bars indicate SEM.

Similar articles

References

    1. Lemaitre B., Hoffmann J. The host defense of Drosophila melanogaster. Annu. Rev. Immunol. 2007;25:697–743. doi: 10.1146/annurev.immunol.25.022106.141615. - DOI - PubMed
    1. Clark R., Kupper T. Old meets new: The interaction between innate and adaptive immunity. J. Investig. Dermatol. 2005;125:629–637. doi: 10.1111/j.0022-202X.2005.23856.x. - DOI - PubMed
    1. Willermain F., Rosenbaum J.T., Bodaghi B., Rosenzweig H.L., Childers S., Behrend T., Wildner G., Dick A.D. Interplay between innate and adaptive immunity in the development of non-infectious uveitis. Prog. Retin. Eye Res. 2012;31:182–194. doi: 10.1016/j.preteyeres.2011.11.004. - DOI - PMC - PubMed
    1. Nicolas E., Reichhart J.M., Hoffmann J.A., Lemaitre B. In vivo regulation of the IκB homologue Cactus during the immune response of Drosophila. J. Biol. Chem. 1998;273:10463–10469. doi: 10.1074/jbc.273.17.10463. - DOI - PubMed
    1. Brennan A., Anderson V. Drosophila: The genetics of innate immune recognition and response. Annu. Rev. Immunol. 2004;22:457–483. doi: 10.1146/annurev.immunol.22.012703.104626. - DOI - PubMed

Publication types

MeSH terms

LinkOut - more resources