. 2025 Mar 13;14(6):426.
doi: 10.3390/cells14060426.

Lateral Ventricular Neural Stem Cells Provide Negative Feedback to Circuit Activation Through GABAergic Signaling

Affiliations

Lateral Ventricular Neural Stem Cells Provide Negative Feedback to Circuit Activation Through GABAergic Signaling

Moawiah M Naffaa et al. Cells. .

Abstract

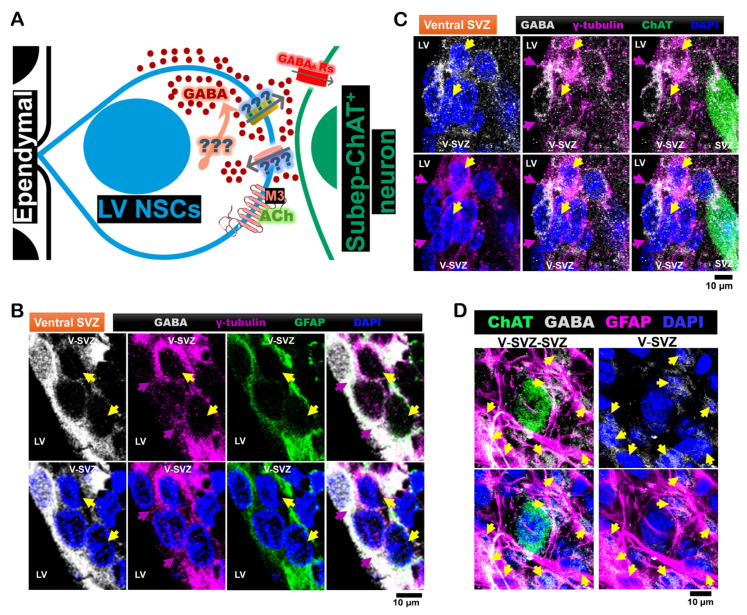
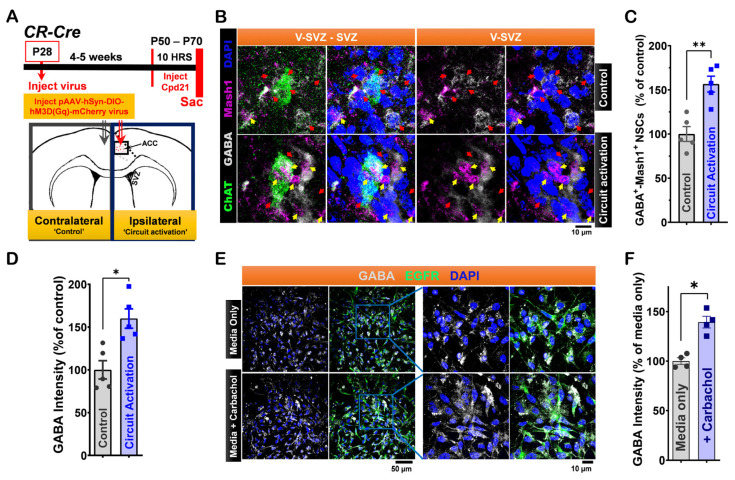
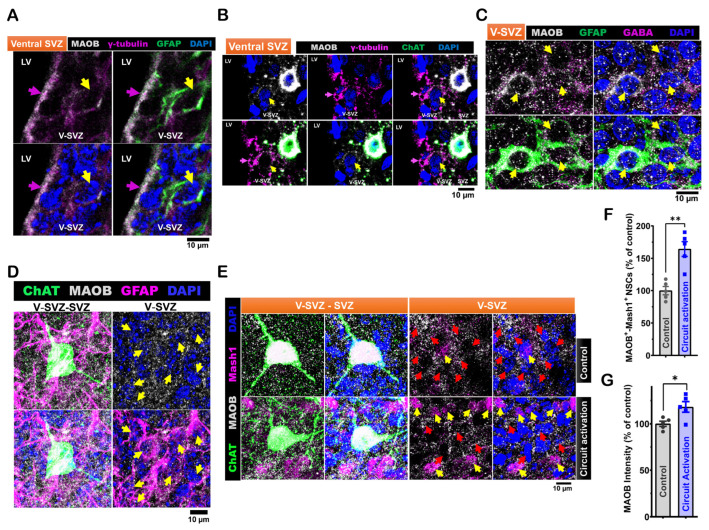
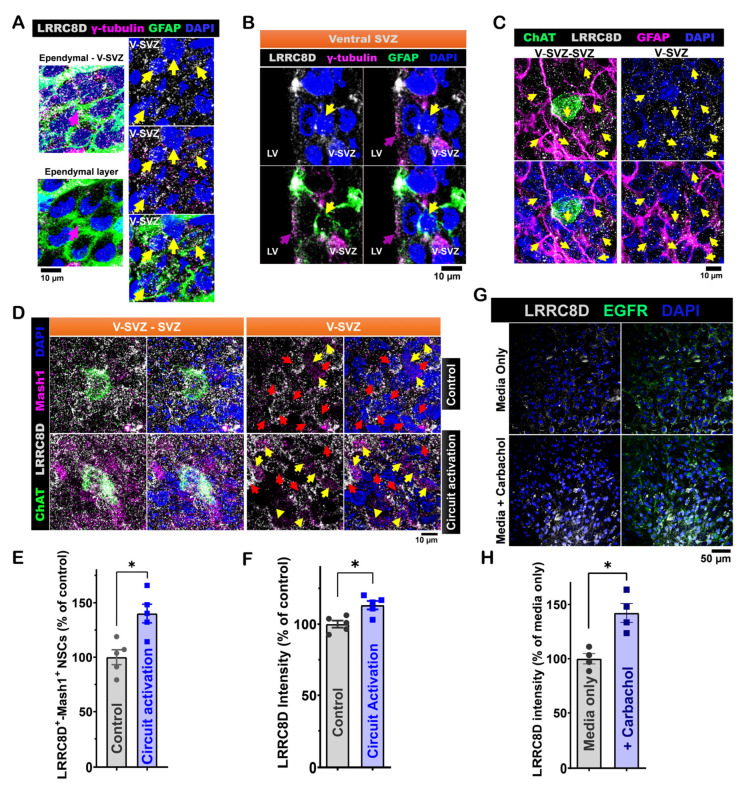
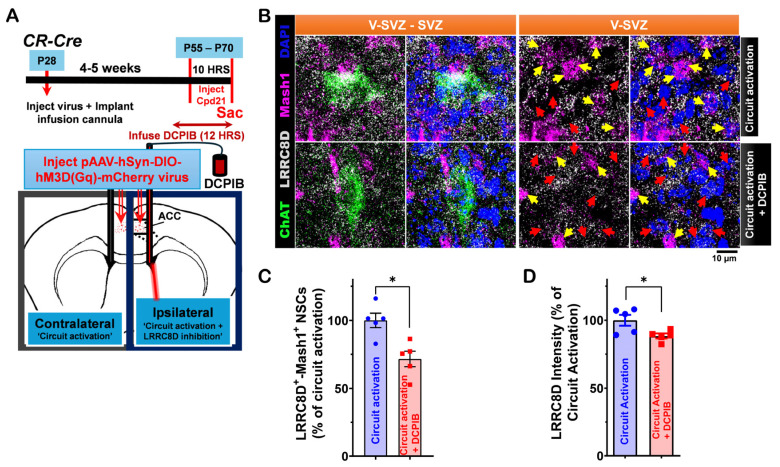
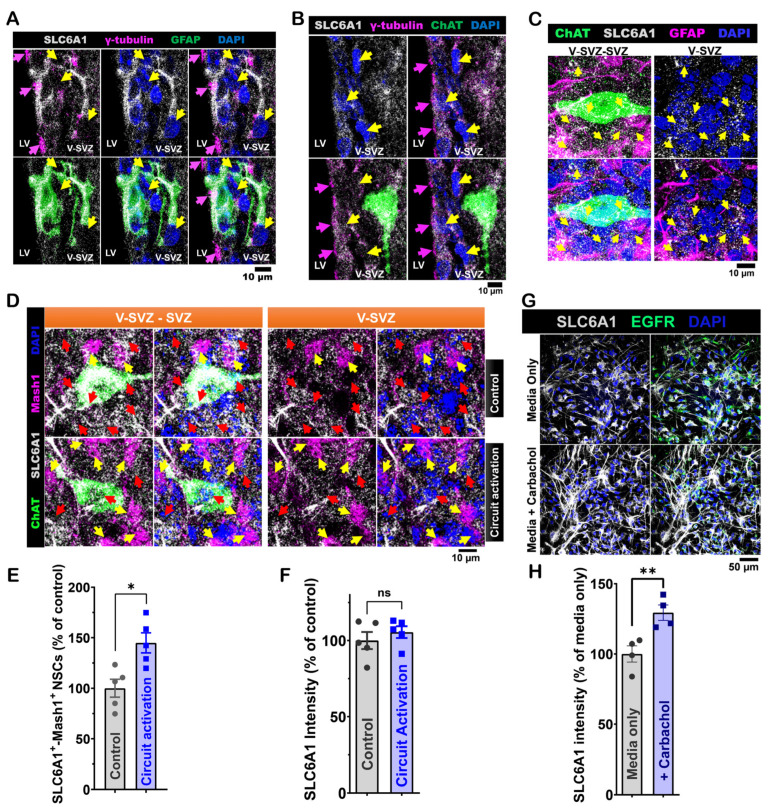
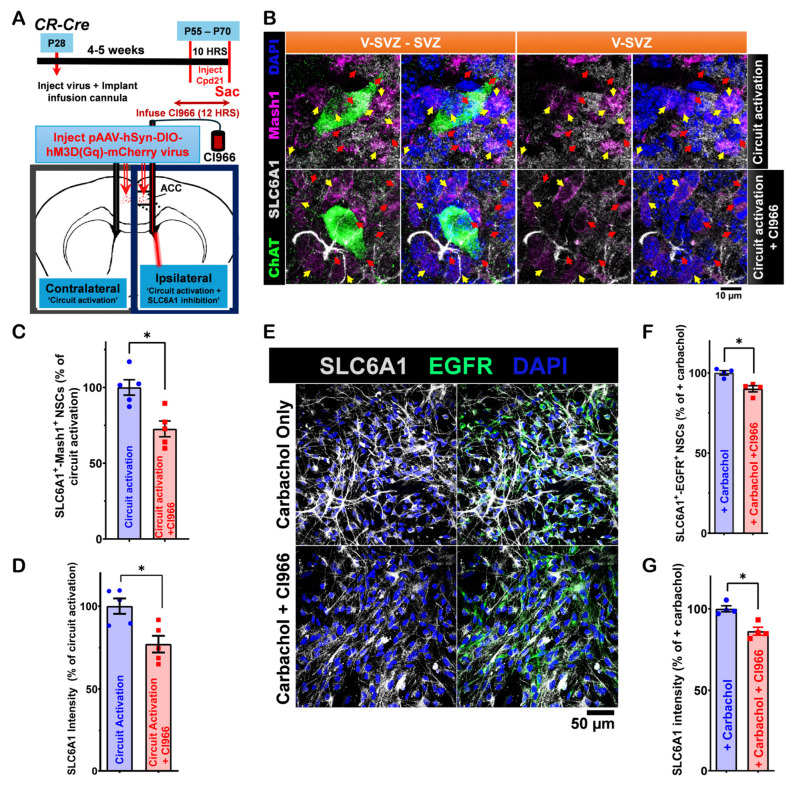
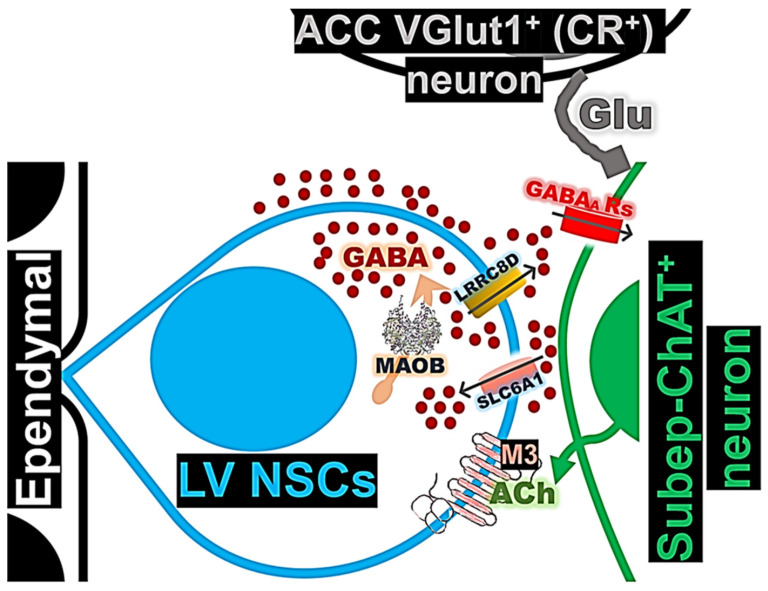
Recent studies have demonstrated that circuit activation in vivo can regulate proliferation of lateral ventricular neural stem cells (LV NSCs), although the underlying molecular and cellular mechanisms are not yet fully understood. Here, we investigated the role of GABAergic signaling in the interaction between LV NSCs and the anterior cingulate cortex-subependymal-choline acetyltransferase+ (ChAT+) neuron (ACC-subep-ChAT+) circuit. We found that monoamine oxidase B (MAOB), a key enzyme involved in gamma-aminobutyric acid (GABA) synthesis, is expressed in LV NSCs, and that activation of the ACC-subep-ChAT+ circuit can modulate MAOB activity. Additionally, LV NSCs express LRRC8D, a core component of volume-regulated anion channels, and GABA transporter-1 (GAT-1, SLC6A1). We show evidence that, through GABA signaling, LRRC8D and GAT-1 can provide a negative feedback signal to ChAT+ neurons, a key component of the ACC-subep-ChAT+ circuit that regulate proliferation of LV NSCs. These findings suggest that MAOB-driven GABA synthesis, LRRC8D-regulated chloride and GABA transport, and GAT-1-facilitated GABA reuptake can regulate neural circuit activation and influence NSC proliferation dynamics in the LV.

Keywords: GABA transporter-1 (GAT-1); GABAergic signaling; LRRC8D; SLC6A1; anterior cingulate cortex-subependymal-ChAT+ (ACC-subep-ChAT+) circuit; lateral ventricular neural stem cells (LV NSCs); monoamine oxidase B (MAOB); volume-regulated anion channels (VRACs).


Conflict of interest statement

The authors declare no conflicts of interest.

Figures

Figure 1
Figure 1
LV NSCs express GABA in the ventral subventricular zone, surrounding subep-ChAT⁺ neurons. (A). Schematic representation of the cellular composition and organization of the ventral LV-SVZ, highlighting ependymal cells, LV NSCs, transit-amplifying cells, and LV NSCs. (B). Immunofluorescence staining for GABA (gray), GFAP (green), and γ-tubulin (purple) in the ventral V-SVZ of P40 C57BL/6J mouse brain coronal sections. Yellow arrows indicate GABA⁺-GFAP⁺-γ-tubulin⁺ NSCs in the ventral V-SVZ, while purple arrows indicate apical γ-tubulin⁺ NSC endings in the ventral SVZ. Scale bar = 10 µm. (C). Immunofluorescence staining for GABA (gray), ChAT (green), and γ-tubulin (purple) in the ventral V-SVZ adjacent to subep-ChAT⁺ neurons of P40 C57BL/6J mouse brain coronal sections. Yellow arrows indicate GABA⁺-γ-tubulin⁺ NSCs in the ventral V-SVZ, while purple arrows indicate apical γ-tubulin⁺ NSC endings in the ventral SVZ. Scale bar = 10 µm. (D). Immunofluorescence staining for GABA (gray), ChAT (green), and GFAP (purple) in SVZ whole-mount preparations of C57BL/6J (P35) mice. Yellow arrows indicate GABA⁺-GFAP⁺ cells in the ventral V-SVZ surrounding subep-ChAT⁺ neurons. Scale bar = 10 µm. Images are representative of three mice.
Figure 2
Figure 2
Modulation of LV NSCs via ACC-Subep-ChAT+ Circuit In Vivo and Carbachol Treatment In Vitro Alters GABA signaling. (A). Experimental design (upper) and schematic representation (lower) of in vivo chemogenetic activation for 10 h using the pAAV-hSyn-DIO-hM3D(Gαq)-mCherry virus injected into the ACC. (B). Representative immunofluorescence staining for GABA (gray), ChAT (green), and Mash1 (purple) in contralateral SVZ wholemounts (control, no chemogenetic activation of the ACC-subep-ChAT⁺ circuit) and ipsilateral SVZ wholemounts following chemogenetic circuit activation as described in (A). Yellow arrows indicate GABA⁺-Mash1⁺ NSCs, while red arrows indicate NSCs that are only GABA⁺. Scale bar = 10 μm. (C). Quantification of GABA⁺-Mash1⁺ NSCs relative to GABA⁺ NSCs per subep-ChAT⁺ neuron in contralateral and ipsilateral SVZ wholemounts from (B). ** p = 0.0020, t4 = 7.187, paired t-test. N = 5 CR-Cre mice. Each data point corresponds to the calculated mean percentage of GABA⁺-Mash1⁺ NSCs as a subset of the total GABA⁺ NSC population within a specified ROI. These ROIs were carefully delineated within the V-SVZ layer in proximity to subep-ChAT⁺ neurons (averaged from four subep-ChAT⁺ neurons per mouse). (D). Quantification of GABA intensity relative to GABA⁺ NSCs per subep-ChAT⁺ neuron in SVZ wholemounts from (B). * p = 0.0158, t4 = 4.023, paired t-test. N = 5 CR-Cre mice. Each data point in the analysis represents the mean percentage of GABA intensity measured specifically within GABA⁺ NSCs located in a defined ROI. ROIs were selected within the V-SVZ layer, in areas immediately surrounding subep-ChAT⁺ neurons (averaged from four subep-ChAT⁺ neurons per mouse). (E). Immunofluorescence staining for GABA (gray) and EGFR (green) in control or carbachol-treated (15 μM) SVZ NSC cultures collected after 24 h in proliferation media. Scale bar = 50 μm. (F). Quantification of GABA intensity relative to EGFR⁺ NSCs in control and carbachol-treated SVZ NSC cultures. * p = 0.0153, t₃ = 5.015, paired t-test. N = 4 independent SVZ NSC cultures per group. Each data point represents the average percentage of GABA intensity specifically within EGFR⁺ NSCs.
Figure 3
Figure 3
Expression of monoamine oxidase B (MAOB) in LV NSCs and its modulation by in vivo ACC-subep-ChAT+ circuit activity. (A). Representative immunofluorescence staining for MAOB (gray), GFAP (green), and γ-tubulin (purple) in coronal brain sections from P40 C57BL/6J mice (N = 3), specifically in the ventral V-SVZ. Yellow arrows indicate MAOB+-GFAP+-γ-tubulin+ NSCs in the ventral V-SVZ, while purple arrow indicates apical γ-tubulin⁺ NSC endings in the ventral SVZ. Scale bar = 10 μm. (B). Immunofluorescence staining for MAOB (gray), ChAT (green), and γ-tubulin (purple) in coronal brain sections of P40 C57BL/6J mice, showing the ventral V-SVZ adjacent to subep-ChAT+ neurons. Yellow arrows indicate MAOB+-γ-tubulin+ NSCs in the ventral V-SVZ, while purple arrow indicates apical γ-tubulin⁺ NSC endings in the ventral SVZ. Scale bar = 10 μm. (C). Immunofluorescence staining for MAOB (gray), GFAP (green), and GABA (purple) in SVZ wholemounts of P35 C57BL/6J mice. Yellow arrows indicate GABA+-GFAP+ cells in the ventral V-SVZ surrounding subep-ChAT+ neurons. Scale bar = 10 μm. (D). Immunofluorescence staining for MAOB (gray), ChAT (green), and GFAP (purple) in SVZ wholemounts of P35 C57BL/6J mice. Yellow arrows indicate MAOB+-GFAP+ cells in the ventral V-SVZ surrounding subep-ChAT+ neurons. Scale bar = 10 μm. (E). Immunofluorescence staining for MAOB (gray), ChAT (green), and Mash1 (purple) in contralateral and ipsilateral SVZ wholemounts of P35 C57BL/6J mice. The contralateral SVZ serves as a control, with no chemogenetic activation of the ACC-subep-ChAT+ circuit, and the ipsilateral SVZ is shown following chemogenetic activation, as described in Figure 2A. Yellow arrows indicate MAOB+-Mash1+ NSCs, while red arrows point to MAOB+ NSCs lacking Mash1 expression. Scale bar = 10 μm. (F). Quantification of MAOB+-Mash1+ NSCs relative to all MAOB+ NSCs per subep-ChAT+ neuron in contralateral and ipsilateral SVZ wholemounts from (E). ** p = 0.0030, t4 = 6.447, paired t-test. N = 5 CR-Cre mice. Each data point corresponds to the calculated mean percentage of MAOB⁺-Mash1⁺ NSCs as a subset of the total MAOB⁺ NSC population within a specified ROI. These ROIs were selected within the V-SVZ layer in proximity to subep-ChAT⁺ neurons (average from four subep-ChAT+ neurons per mouse). (G). Quantification of MAOB protein intensity relative to MAOB+ NSCs, measured per subep-ChAT+ neuron in contralateral and ipsilateral SVZ wholemounts from (E). * p = 0.0426, t4 = 2.935, paired t-test. N = 5 CR-Cre mice. Each data point in the analysis represents the mean percentage of MAOB protein intensity measured specifically within MAOB⁺ NSCs located in a defined ROI.
Figure 4
Figure 4
LRRC8D expression in ventral LV NSCs modulates their activity in response to ACC-subep-ChAT⁺ circuit signaling. (A). Immunofluorescence staining for LRRC8D (gray), GFAP (green), and γ-tubulin (purple) in the ventral SVZ from an SVZ wholemount of a P40 C57BL/6J mouse brain. Yellow arrows indicate LRRC8D⁺-GFAP⁺-γ-tubulin⁺ NSCs in the ventral V-SVZ, while purple arrows indicate apical endings of γ-tubulin⁺ NSCs in the ependymal layer. Scale bar = 10 μm. (B). Immunofluorescence staining for LRRC8D (gray), GFAP (green), and γ-tubulin (purple) in coronal brain sections of P40 C57BL/6J mice. Yellow arrows indicate LRRC8D⁺-GFAP⁺-γ-tubulin⁺ NSCs in the ventral V-SVZ, while purple arrows denote apical endings of γ-tubulin⁺ NSCs in the ventral SVZ. Scale bar = 10 μm. (C). Immunofluorescence staining for LRRC8D (gray), ChAT (green), and GFAP (purple) in SVZ wholemounts of P35 C57BL/6J mice. Yellow arrows indicate LRRC8D⁺-GFAP⁺ NSCs in the ventral V-SVZ surrounding subep-ChAT⁺ neurons. Scale bar = 10 μm. (D). Immunofluorescence staining for LRRC8D (gray), ChAT (green), and Mash1 (purple) in contralateral and ipsilateral SVZ wholemounts. Contralateral wholemounts serve as controls without chemogenetic activation of the ACC-subep-ChAT⁺ circuit, whereas ipsilateral wholemounts were analyzed following circuit activation, as described in Figure 2A. Yellow arrows indicate LRRC8D⁺-Mash1⁺ NSCs, while red arrows denote LRRC8D⁺ NSCs lacking Mash1 expression. Scale bar = 10 μm. (E). Quantification of LRRC8D⁺-Mash1⁺ NSCs relative to all LRRC8D⁺ NSCs per subep-ChAT⁺ neuron in contralateral and ipsilateral SVZ wholemounts from panel (D). * p = 0.0376, t₄ = 3.062, paired t-test. N = 5 CR-Cre mice. Each data point corresponds to the calculated mean percentage of LRRC8D⁺-Mash1⁺ NSCs as a subset of the total LRRC8D⁺ NSC population within a specified ROI. These ROIs were carefully delineated within the V-SVZ layer in proximity to subep-ChAT⁺ neurons (average from four subep-ChAT⁺ neurons per mouse). (F). Quantification of LRRC8D protein intensity relative to LRRC8D⁺ NSCs per subep-ChAT⁺ neuron in SVZ wholemounts from (D). * p = 0.0267, t4 = 3.422, paired t-test. N = 5 CR-Cre mice. Each data point in the analysis represents the mean percentage of LRRC8D protein intensity measured specifically within LRRC8D⁺ NSCs located in a defined ROI. ROIs were selected within the V-SVZ layer, focusing on areas immediately surrounding subep-ChAT⁺ neurons (averaged from four subep-ChAT⁺ neurons per mouse). (G). Immunofluorescence staining for LRRC8D (gray) and EGFR (green) in SVZ NSC cultures treated with control media or carbachol (15 μM) for 24 h in proliferation media. Scale bar, 50 μm. (H). Quantification of LRRC8D protein intensity/EGFR+ NSCs in control and carbachol-treated SVZ NSC cultures. * p = 0.0475, t3 = 3.249, paired t-test. N = 4 independent SVZ NSC cultures per group. Each data point represents the average percentage of LRRC8D protein intensity specifically within EGFR⁺ NSCs.
Figure 5
Figure 5
LRRC8D modulation of ventral LV NSCs proliferation activity induced by in vivo ACC-subep-ChAT+ circuitry. (A). Schematic representation (lower) and experimental design (upper) of in vivo chemogenetic activation for 10 h following injection of the pAAV-hSyn-DIO-hM3D(Gq)-mCherry virus into the ACC region and cannula implantation for DCPIB infusion into the LV region of P28 CR-Cre mice. (B). Immunofluorescence staining for LRRC8D (gray), ChAT (green), and Mash1 (purple) in contralateral SVZ wholemounts (control) and ipsilateral SVZ wholemounts after chemogenetic activation of the ACC-subep-ChAT⁺ circuit with DCPIB infusion, as illustrated in panel (A). Yellow arrows indicate LRRC8D⁺-Mash1⁺ NSCs, and red arrows denote LRRC8D⁺ NSCs lacking Mash1 expression. Scale bar = 10 μm. (C). Quantification of LRRC8D⁺-Mash1⁺ NSCs relative to all LRRC8D⁺ NSCs per subep-ChAT⁺ neuron in contralateral and ipsilateral SVZ wholemounts from panel (A). * p = 0.0467, t4 = 2.843, paired t-test. N = 5 CR-Cre mice. Each data point corresponds to the calculated mean percentage of LRRC8D⁺-Mash1⁺ NSCs as a subset of the total LRRC8D⁺ NSC population within a specified ROI. These ROIs were carefully delineated within the V-SVZ layer in proximity to subep-ChAT⁺ neurons (average from four subep-ChAT⁺ neurons per mouse). (D). Quantification of LRRC8D protein intensity relative to LRRC8D+ NSCs per subep-ChAT+ neuron in contralateral and ipsilateral SVZ wholemounts (panel B). * p = 0.0239, t4 = 3.544, paired t-test. N = 5 CR-Cre mice. Each data point in the analysis represents the mean percentage of LRRC8D protein intensity measured specifically within LRRC8D⁺ NSCs located in a defined ROI. These ROIs were selected within the V-SVZ layer, focusing on areas immediately surrounding subep-ChAT⁺ neurons (averaged from four subep-ChAT+ neurons per mouse).
Figure 6
Figure 6
Ventral LV NSCs express SLC6A1, which is regulated by in vitro carbachol treatment. (A). Representative immunofluorescence staining for SLC6A1 (gray), GFAP (green), and γ-tubulin (purple) in the ventral V-SVZ of P40 C57BL/6J mouse brain coronal sections. Yellow arrows indicate SLC6A1+-GFAP+-γ-tubulin+ NSCs in the ventral V-SVZ. Purple arrows indicate γ-tubulin+ NSCs in the ventral SVZ. Scale bar = 10 μm. (B). Immunofluorescence staining for SLC6A1 (gray), ChAT (green), and γ-tubulin (purple) in the ventral V-SVZ adjacent to subep-ChAT+ neurons of P45 C57BL/6J mouse brain coronal sections. Yellow arrows indicate SLC6A1+-γ-tubulin+ NSCs in the ventral V-SVZ. Purple arrows indicate γ-tubulin+ NSCs in the ventral SVZ. Scale bar = 10 μm. (C). Immunofluorescence staining for SLC6A1 (gray), ChAT (green), and GFAP (purple) in SVZ wholemounts from C57BL/6J (P35) mice. Yellow arrows indicate SLC6A1+-GFAP+ cells in the ventral V-SVZ surrounding subep-ChAT+ neurons. Scale bar = 10 μm. (D). Immunofluorescence staining for SLC6A1 (gray), ChAT (green), and Mash1 (purple) in contralateral SVZ whole mounts without chemogenetic activation of the ACC-subep-ChAT+ circuit (control) and ipsilateral SVZ whole mounts after circuit activation (per Figure 2A). Yellow arrows indicate SLC6A1+-Mash1+ NSCs, while red arrows indicate NSCs expressing only SLC6A1. Scale bar = 10 μm. (E). Quantification of SLC6A1+-Mash1+ NSCs/SLC6A1+ NSCs per subep-ChAT+ neuron in contralateral and ipsilateral SVZ whole mounts from panel (D). * p = 0.0216, t4 = 3.657, paired t-test. N = 5 CR-Cre mice. Each data point corresponds to the calculated mean percentage of SLC6A1⁺-Mash1⁺ NSCs as a subset of the total SLC6A1⁺ NSC population within a specified ROI. These ROIs were carefully delineated within the V-SVZ layer in proximity to subep-ChAT⁺ neurons (averaged from four subep-ChAT+ neurons per mouse). (F). Quantification of SLC6A1 protein intensity/SLC6A1+ NSCs per subep-ChAT+ neuron in contralateral and ipsilateral SVZ wholemounts from panel (D). p = ns, t4 = 2.356, paired t-test. N = 5 CR-Cre mice. Each data point in the analysis represents the mean percentage of SLC6A1 protein intensity measured specifically within SLC6A1⁺ NSCs located in a defined ROI. These ROIs were selected within the V-SVZ layer, focusing on areas immediately surrounding subep-ChAT⁺ neurons (averaged from four subep-ChAT+ neurons per mouse). (G). Immunofluorescence staining for SLC6A1 (gray) and EGFR (green) in SVZ NSC cultures treated with control media or carbachol (15 μM) for 24 h in proliferation media. Scale bar, 50 μm. (H). Quantification of SLC6A1 protein intensity/EGFR+ NSCs in control and carbachol-treated SVZ NSC cultures. ** p = 0.0061, t₃ = 6.943, paired t-test. N = 4 independent SVZ NSC cultures per group. Each data point represents the average percentage of SLC6A1 protein intensity specifically within EGFR⁺ NSCs.
Figure 7
Figure 7
SLC6A1 modulation of ventral LV NSCs proliferation. (A). Schematic of the experimental design (upper) and of in vivo chemogenetic activation (lower). The procedure involved a 10 h activation following the injection of the pAAV-hSyn-DIO-hM3D(Gq)-mCherry virus into the ACC and cannula implantation for CI966 infusion into the lateral ventricle (LV) of P28 CR-Cre mice. (B). Immunofluorescence staining for SLC6A1 (gray), ChAT (green), and Mash1 (purple) in contralateral SVZ wholemounts after chemogenetic activation of the ACC-subep-ChAT+ circuit (control) and in ipsilateral SVZ wholemounts following circuit activation with CI966 infusion, as shown in panel (A). Yellow arrows indicate SLC6A1+-Mash1+ neural stem cells (NSCs), and red arrows indicate SLC6A1+ NSCs. Scale bar = 10 μm. (C). Quantification of SLC6A1+-Mash1+ NSCs relative to total SLC6A1+ NSCs per subep-ChAT+ neuron in contralateral and ipsilateral SVZ wholemounts (panel B). * p = 0.0395, t4 = 2.813, paired t-test. N = 5 CR-Cre mice. Each data point corresponds to the calculated mean percentage of SLC6A1⁺-Mash1⁺ NSCs as a subset of the total SLC6A1⁺ NSC population within a specified ROI. These ROIs were carefully delineated within the V-SVZ layer in proximity to subep-ChAT⁺ neurons (averaged across four subep-ChAT+ neurons per mouse). (D). Quantification of SLC6A1 protein intensity relative to SLC6A1+ NSCs per subep-ChAT+ neuron in contralateral and ipsilateral SVZ wholemounts (panel B). * p = 0.0482, t4 = 4.023, paired t-test. N = 5 CR-Cre mice. Each data point in the analysis represents the mean percentage of SLC6A1 protein intensity measured specifically within SLC6A1⁺ NSCs located in a defined ROI. These ROIs were selected within the V-SVZ layer, focusing on areas immediately surrounding subep-ChAT⁺ neurons (averaged from four subep-ChAT+ neurons per mouse). (E). Immunofluorescence staining for SLC6A1 (gray) and EGFR (green) in SVZ NSC cultures treated with carbachol (15 μM) or carbachol (15 μM) + CI966 (1.5 μM) after 24 h in the proliferation media. Scale bar = 50 μm. (F). Quantification of SLC6A1+-EGFR+ NSCs per well in SVZ NSC cultures treated with carbachol or carbachol + CI966. * p = 0.0452, t3 = 3.315, paired t-test. N = 4 independent SVZ NSC cultures per group. Each data point corresponds to the calculated mean percentage of SLC6A1+-EGFR+ NSCs. (G). Quantification of SLC6A1 protein intensity per EGFR+ NSCs in carbachol-treated and carbachol + CI966-treated SVZ NSC cultures. * p = 0.0208, t3 = 4.474, paired t-test. N = 4 independent SVZ NSC cultures per group. Each data point represents the average percentage of SLC6A1 protein intensity specifically within EGFR⁺ NSCs.
Figure 8
Figure 8
A model depicts GABA signaling in the LV NSCs, highlighting the regulation of ACC-subep-ChAT+ circuit activity and its influence on LV NSC proliferation.

Similar articles

References

    1. de Sonnaville S., van Strien M.E., Middeldorp J., Sluijs J.A., van den Berge S.A., Moeton M., Donega V., van Berkel A., Deering T., De Filippis L., et al. The adult human subventricular zone: Partial ependymal coverage and proliferative capacity of cerebrospinal fluid. Brain Commun. 2020;2:fcaa150. doi: 10.1093/braincomms/fcaa150. - DOI - PMC - PubMed
    1. Baig S., Nadaf J., Allache R., Le P.U., Luo M., Djedid A., Nkili-Meyong A., Safisamghabadi M., Prat A., Antel J., et al. Identity and nature of neural stem cells in the adult human subventricular zone. iScience. 2024;27:109342. doi: 10.1016/j.isci.2024.109342. - DOI - PMC - PubMed
    1. Lim D.A., Alvarez-Buylla A. The Adult Ventricular-Subventricular Zone (V-SVZ) and Olfactory Bulb (OB) Neurogenesis. Cold Spring Harb. Perspect. Biol. 2016;8:a018820. doi: 10.1101/cshperspect.a018820. - DOI - PMC - PubMed
    1. Lledo P.M., Merkle F.T., Alvarez-Buylla A. Origin and function of olfactory bulb interneuron diversity. Trends Neurosci. 2008;31:392–400. doi: 10.1016/j.tins.2008.05.006. - DOI - PMC - PubMed
    1. Lledo P.M., Saghatelyan A. Integrating new neurons into the adult olfactory bulb: Joining the network, life-death decisions, and the effects of sensory experience. Trends Neurosci. 2005;28:248–254. doi: 10.1016/j.tins.2005.03.005. - DOI - PubMed

Publication types

MeSH terms

Substances

LinkOut - more resources