. 2025 Mar 20;14(6):463.
doi: 10.3390/cells14060463.

Impact of a High-Fat Diet on the Gut Microbiome: A Comprehensive Study of Microbial and Metabolite Shifts During Obesity

Affiliations

Impact of a High-Fat Diet on the Gut Microbiome: A Comprehensive Study of Microbial and Metabolite Shifts During Obesity

Md Abdullah Al Mamun et al. Cells. .

Abstract

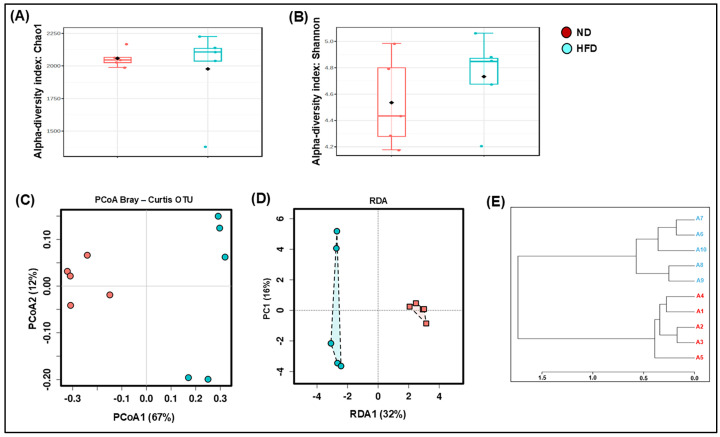
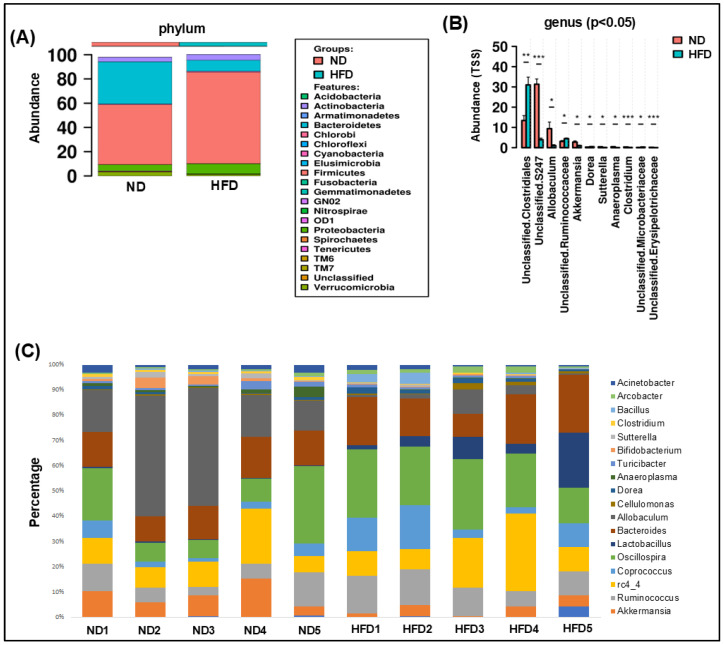
Over the last few decades, the prevalence of metabolic diseases such as obesity, diabetes, non-alcoholic fatty liver disease, hypertension, and hyperuricemia has surged, primarily due to high-fat diet (HFD). The pathologies of these metabolic diseases show disease-specific alterations in the composition and function of their gut microbiome. How HFD alters the microbiome and its metabolite to mediate adipose tissue (AT) inflammation and obesity is not well known. Thus, this study aimed to identify the changes in the gut microbiome and metabolomic signatures induced by an HFD to alter obesity. To explore the changes in the gut microbiota and metabolites, 16S rRNA gene amplicon sequencing and metabolomic analyses were performed after HFD and normal diet (ND) feeding. We noticed that, at taxonomic levels, the number of operational taxonomic units (OTUs), along with the Chao and Shannon indexes, significantly shifted in HFD-fed mice compared to those fed a ND. Similarly, at the phylum level, an increase in Firmicutes and a decrease in Bacteroidetes were noticed in HFD-fed mice. At the genus level, an increase in Lactobacillus and Ruminococcus was observed, while Allobaculum, Clostridium, and Akkermansia were markedly reduced in the HFD group. Many bacteria from the Ruminococcus genus impair bile acid metabolism and restrict weight loss. Firmicutes are efficient in breaking down complex carbohydrates into short-chain fatty acids (SCFAs) and other metabolites, whereas Bacteroidetes are involved in a more balanced or efficient energy extraction. Thus, an increase in Firmicutes over Bacteroidetes enhances the absorption of more calories from food, which may contribute to obesity. Taken together, the altered gut microbiota and metabolites trigger AT inflammation, which contributes to metabolic dysregulation and disease progression. Thus, this study highlights the potential of the gut microbiome in the development of therapeutic strategies for obesity and related metabolic disorders.

Keywords: dysbiosis; gut microbiota; metabolic profile; metabolites; obesity.


Conflict of interest statement

All the authors declare that they have no competing interests that could have influenced this study and have not been involved with any study sponsors.

Figures

Figure 1
Figure 1
Effect of HFD supplementation on overall presentations of the gut microbiota structure (n = 5). Alpha-diversity was estimated with the Chao1 index (A) and Shannon index (B) on raw OTU abundance in ND- and HFD-fed subjects. Principal coordinate analysis (PCoA) was conducted on bacterial beta-diversity based on the Bray–Curtis dissimilarity of gut microbial populations by relative abundance (C), the results were based on the weighted UniFrac distance of bacterial communities from different regions (D). This was followed by taxonomic diversity, analyzed by the unweighted paired-group method with an arithmetic mean (UPGMA) (E). ND-fed subjects are shown in red, while HFD-fed animals are shown in blue.
Figure 2
Figure 2
Relative abundance of bacteria at the phyla and genus level (n = 5). Relative abundance of community at the phylum level (A). Changes in abundance of dominant community at the genus level in ND- and HFD-fed mice (B). The relative abundance of bacterial genera in different fecal samples is visualized by bar plots. Each bar represents a subject, and each colored box is a bacterial genus. The height of a color box demonstrates the relative abundance of that organism within the sample (C). A t-test was performed to assess the significance of the indicated classes. The bars represent the mean ± SEM and exact p-values are indicated in the text (* p < 0.05; ** p < 0.01; and *** p < 0.001).
Figure 3
Figure 3
ND and HFD resulted in different gut microbial clusters and different dominant bacteria in the fecal sample. In this study, 16S rRNA sequencing from the fecal samples was performed, and OTU data were subjected to a linear discriminant effect size (LEfSe) analysis (A). The cladogram represents the phylogenetic relationship of significant OTUs associated with each group (B). The heatmap of Spearman’s correlation analysis of relative abundances in the gut microbiome between ND and HFD groups is also shown above (C). For LefSe data, the alpha factorial Kruskal–Wallis test among classes was set to 0.05, and the threshold on the logarithmic LDA score for discriminative features was set to 3.
Figure 4
Figure 4
Differentially abundant genera and species in ND and HFD groups: heatmap of the proportion of OTUs determined to be dominant bacteria, with rows clustered by microbiota similarity according to the Euclidean distance, and columns clustered by OTUs occurring more often together (A); and core microbiome showing genera detected in high fractions in ND and HFD groups (B).
Figure 5
Figure 5
Correlation analysis of gut microbiome between ND and HFD groups and microbiome–metabolite interactions. Gut microbiome correlation network for genus classification is shown in (A). The nodes represented the taxa at the genus level according to the relative content between ND and HFD groups. The green color in the nodes represents the ND group, whereas the red color in the nodes represents the HFD group. The edges represent correlations between the taxon pairs. Interaction between gut microbiota at the species level and specific microbiota is shown in (B), in a diagram illustrating significant microbiome–metabolite associations. The nodes represent microbial taxa (green) and metabolites (purple), while the edges indicate significant positive correlations.

Similar articles

Cited by

References

    1. Raoult D., Fournier P.E., Drancourt M. What does the future hold for clinical microbiology? Nat. Rev. Microbiol. 2004;2:151–159. - PMC - PubMed
    1. Lepage P., Leclerc M.C., Joossens M., Mondot S., Blottière H.M., Raes J., Ehrlich D., Doré J. A metagenomic insight into our gut’s microbiome. Gut. 2013;62:146–158. doi: 10.1136/gutjnl-2011-301805. - DOI - PubMed
    1. Turnbaugh P.J., Ley R.E., Mahowald M.A., Magrini V., Mardis E.R., Gordon J.I. An obesity-associated gut microbiome with increased capacity for energy harvest. Nature. 2006;444:1027–1031. - PubMed
    1. Blüher M. Obesity: Global epidemiology and pathogenesis. Nat. Rev. Endocrinol. 2019;15:288–298. - PubMed
    1. Gu Y., Liu C., Zheng N., Jia W., Zhang W., Li H. Metabolic and gut microbial characterization of obesity-prone mice under a high-fat diet. J. Proteome Res. 2019;18:1703–1714. - PubMed

Publication types

Substances

LinkOut - more resources