. 2025 Mar 20;14(6):465.
doi: 10.3390/cells14060465.

Juglone-Bearing Thiopyrano[2,3-d]thiazoles Induce Apoptosis in Colorectal Adenocarcinoma Cells

Affiliations

Juglone-Bearing Thiopyrano[2,3-d]thiazoles Induce Apoptosis in Colorectal Adenocarcinoma Cells

Yuliia Kozak et al. Cells. .

Abstract

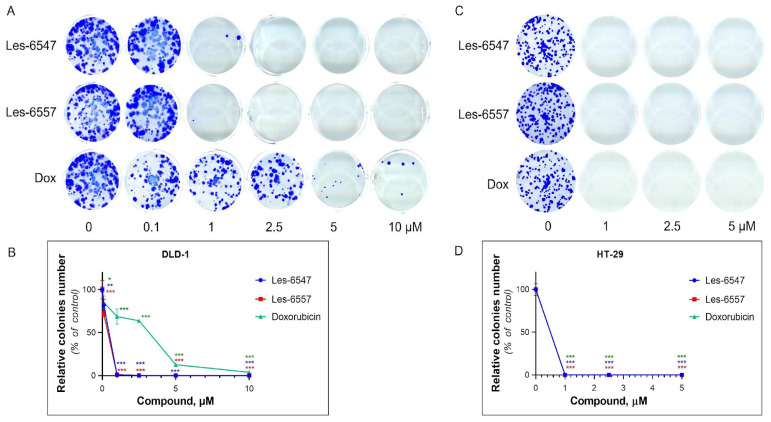
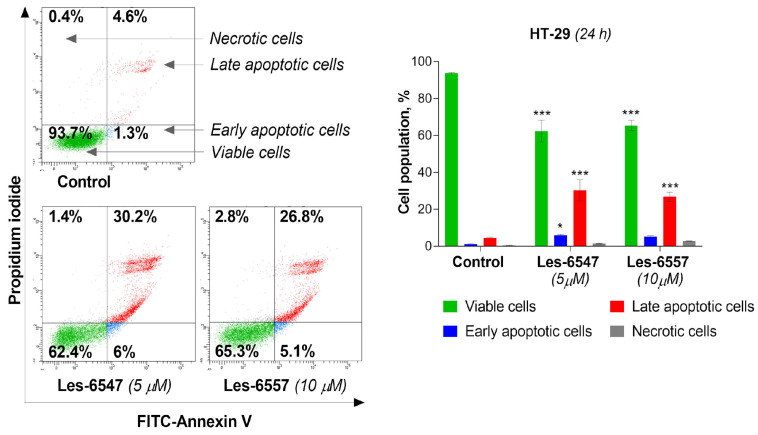
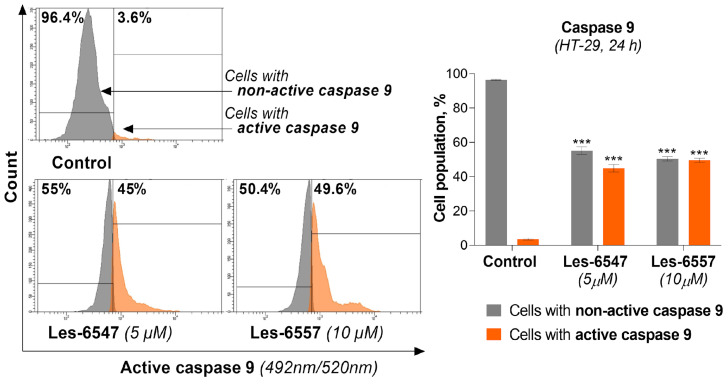
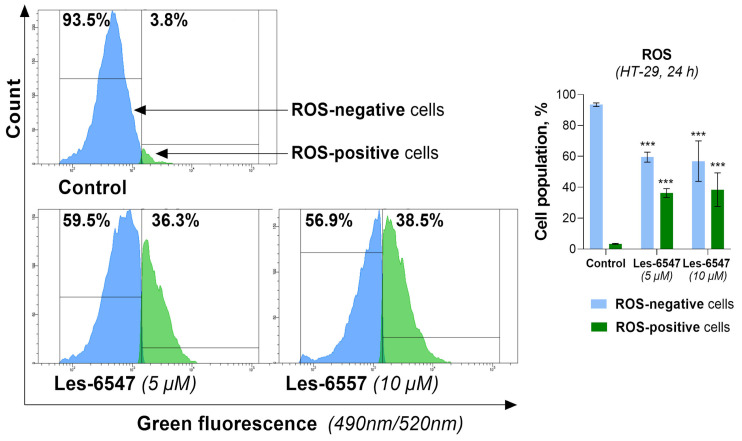
Colorectal cancer is a major global health challenge, with current treatments limited by toxicity and resistance. Thiazole derivatives, known for their bioactivity, are emerging as promising alternatives. Juglone (5-hydroxy-1,4-naphthoquinone) is a naturally occurring compound with known anticancer properties, and its incorporation into thiopyrano[2,3-d]thiazole scaffolds may enhance their therapeutic potential. This study examined the cytotoxicity of thiopyrano[2,3-d]thiazoles and their effects on apoptosis in colorectal cancer cells. Les-6547 and Les-6557 increased the population of ROS-positive HT-29 cancer cells approximately 10-fold compared with control cells (36.3% and 38.5% vs. 3.8%, respectively), potentially contributing to various downstream effects. Elevated ROS levels were associated with cell cycle arrest, inhibition of DNA biosynthesis, and reduced cell proliferation. A significant shift in the cell cycle distribution was observed, with an increase in S-phase (from 17.3% in the control to 34.7% to 51.3% for Les-6547 and Les-6557, respectively) and G2/M phase (from 24.3% to 39.9% and 28.8%). Additionally, Les-6547 and Les-6557 inhibited DNA biosynthesis in HT-29 cells, with IC50 values of 2.21 µM and 2.91 µM, respectively. Additionally, ROS generation may initiate the intrinsic apoptotic pathway. Les-6547 and Les-6557 activated both intrinsic and extrinsic apoptotic pathways, demonstrated by notable increases in the activity of caspase 3/7, 8, 9, and 10. This study provides a robust basis for investigating the detailed molecular mechanisms of action and therapeutic potential of Les-6547 and Les-6557.

Keywords: apoptosis; colorectal cancer; proliferation; reactive oxygen species; thiopyrano[2,3-d]thiazoles.


Conflict of interest statement

The authors declare no conflicts of interest.

Figures

Figure 1
Figure 1
Structures of the studied thiopyrano[2,3-d]thiazoles Les-6547 and Les-6557 with juglone (5-hydroxy-1,4-naphthoquinone) moiety in the molecules colored in red.
Figure 2
Figure 2
Docking scores for Les-6547 and Les-6557 for multiple CDK2 PDB structures compared with scores for a—all co-crystallized ligands (n = 202) and b—only co-crystallized ATP (n = 10, PDB IDs: 1B38, 1B39, 1FIN, 1FQ1, 1GY3, 1JST, 1QMZ, 2CCI, 2CJM, 8FP5). ** p < 0.01; *** p < 0.001; **** p < 0.0001 compared with the CCLs (A) and ATP (B).
Figure 3
Figure 3
Viability of HT-29 and DLD-1 colorectal adenocarcinoma cells after 24, 48, and 72 h of treatment with Les-6547, Les-6557, and doxorubicin (reference drug). MTT assay data are expressed as a percentage of the control group and presented as mean ± SD of three independent experiments (n = 3) conducted in triplicate. * p < 0.05; ** p < 0.01; *** p < 0.001 compared with control cells.
Figure 4
Figure 4
Viability of human lymphocytes isolated from the peripheral blood of healthy donors, HaCaT human keratinocytes, and Balb/c 3T3 murine fibroblasts after treatment for 72 h with Les-6547, Les-6557, and doxorubicin (reference drug). Data are expressed as a percentage of the control group and presented as a mean value ± SD of three independent experiments (n = 3) done in triplicate. ** p < 0.01; *** p < 0.001 compared with the control cells.
Figure 5
Figure 5
Long-term effect (14 days) of Les-6547, Les-6557, and doxorubicin on the colony-forming ability of DLD-1 and HT-29 colorectal adenocarcinoma cells following 72 h treatment: (A,C) representative images of formed colonies in cell culture wells; (B,D) relative number of formed colonies in treated cells (% of control). Data are expressed as a percentage of the control group and presented as the mean value ± SD of three independent experiments (n = 3) performed in triplicate. * p < 0.05; ** p < 0.01; *** p < 0.001 compared with control cells.
Figure 6
Figure 6
[3H]-thymidine incorporation into the DNA of HT-29 colorectal adenocarcinoma cells after 24 h treatment with Les-6547, Les-6557, and doxorubicin (as a reference drug). Results are expressed as a percentage of the control group and presented as the mean ± SD obtained from three independent experiments (n = 3) conducted in triplicate. *** p < 0.001 compared with the control cells.
Figure 7
Figure 7
Results of flow cytometric analysis of apoptosis in HT-29 colorectal adenocarcinoma cells using FITC-Annexin V (AV)/propidium iodide (PI) double staining after 24 h of incubation with Les-6547 (5 μM) and Les-6557 (10 μM). The percentage of viable (green), early apoptotic (blue), late apoptotic (red), and necrotic (gray) cells presented as mean ± SD of three separate experiments (n = 3) in triplicate. * p < 0.05; *** p < 0.001 compared with control cells.
Figure 8
Figure 8
Activity of caspase 8 in HT-29 colorectal adenocarcinoma cells treated for 24 h with Les-6547 (5 μM) and Les-6557 (10 μM), measured via flow cytometry. The percentage of cells with active (violet) and non-active (gray) caspase 8 is presented as mean ± SD of three separate experiments (n = 3) conducted in triplicate. *** p < 0.001 compared with control cells.
Figure 9
Figure 9
Activity of caspase 10 in HT-29 colorectal adenocarcinoma cells treated for 24 h with Les-6547 (5 μM) and Les-6557 (10 μM) measured via flow cytometry. The percentage of cells with active (blue) and non-active (gray) caspase 10 is presented as a mean ± SD of three separate experiments (n = 3) conducted in triplicate. *** p < 0.001 compared with control cells, ### p < 0.001 difference between compounds.
Figure 10
Figure 10
Results of flow cytometry analysis of changes in mitochondrial membrane potential (ΔΨm) in HT-29 colorectal adenocarcinoma cells using staining with JC-1 after 24 h exposure with Les-6547 (5 μM) and Les-6557 (10 μM). Percentages of cells with normal ΔΨm (red fluorescence of JC-1) and decreased ΔΨm (green fluorescence of JC-1) presented as mean ± SD of three separate experiments (n = 3) conducted in triplicate. *** p < 0.001 compared with the control cells.
Figure 11
Figure 11
Activity of caspase 9 in HT-29 colorectal adenocarcinoma cells treated for 24 h with Les-6547 (5 μM) and Les-6557 (10 μM) measured with flow cytometry. The percentage of cells with active (orange) and non-active (gray) caspase 9 is presented as mean ± SD of three separate experiments (n = 3) conducted in triplicate. *** p < 0.001 compared with control cells.
Figure 12
Figure 12
Activity of caspase 3/7 in HT-29 colorectal adenocarcinoma cells treated for 24 h with Les-6547 (5 μM) and Les-6557 (10 μM), measured via flow cytometry. The percentage of cells with active (blue) and non-active (gray) caspase 3/7 is presented as mean ± SD of three separate experiments (n = 3) carried out in triplicate. ** p < 0.01; *** p < 0.001 compared with control cells.
Figure 13
Figure 13
Levels of total intracellular ROS in HT-29 colorectal adenocarcinoma cells after 24 h of exposure to Les-6547 (5 μM) and Les-6557 (10 μM), measured via flow cytometry. Percentages of ROS positive (green) and negative (blue) cells presented as mean ± SD of three independent experiments (n = 3) conducted in triplicate. *** p < 0.001 compared with control cells.
Figure 14
Figure 14
Fluorescent microscopy data of HT-29 cells following 24 h treatment with Les-6547 (5 μM) and Les-6557 (10 μM): (A) representative fluorescence images of control and treated cells; (B) fluorescence intensity of DHE in control and treated cells (expressed in relative units). Cells were stained with DHE to assess ROS levels and Hoechst 33342 for nuclear visualization. *** p < 0.001 compared with control cells, ### p < 0.001 difference between compounds. Scale bar = 20 µm.
Figure 15
Figure 15
Flow cytometry analysis of cell cycle distribution in HT-29 colorectal adenocarcinoma cells treated for 24 h with Les-6547 (5 μM) and Les-6557 (10 μM). Percentages of cells in the G1 (green), S (red), and G2/M (blue) phases of the cell cycle are presented as mean ± SD obtained from three independent experiments (n = 3) conducted in triplicate. * p < 0.05; *** p < 0.001 compared to the control cells; # p < 0.05 difference between compounds.

Similar articles

References

    1. Bray F., Laversanne M., Sung H., Ferlay J., Siegel R.L., Soerjomataram I., Jemal A. Global cancer statistics 2022: GLOBOCAN estimates of incidence and mortality worldwide for 36 cancers in 185 countries. CA Cancer J. Clin. 2024;74:229–263. - PubMed
    1. Menon G., Recio-Boiles A., Lotfollahzadeh S., Cagir B. StatPearls. StatPearls Publishing; Treasure Island, FL, USA: 2024. [(accessed on 29 October 2024)]. Colon Cancer. Available online: http://www.ncbi.nlm.nih.gov/books/NBK470380/
    1. Stoffel E.M., Murphy C.C. Epidemiology and mechanisms of the increasing incidence of colon and rectal cancers in young adults. Gastroenterology. 2020;158:341–353. - PMC - PubMed
    1. Lingas E.C. Early-onset colon cancer: A narrative review of its pathogenesis, clinical presentation, treatment, and prognosis. Cureus. 2023;15:e45404. - PMC - PubMed
    1. Siegel R.L., Wagle N.S., Cercek A., Smith R.A., Jemal A. Colorectal cancer statistics, 2023. CA Cancer J. Clin. 2023;73:233–254. - PubMed

Publication types

MeSH terms

LinkOut - more resources