. 2025 Feb 20;15(3):143.
doi: 10.3390/metabo15030143.

Metabolomics' Change Under β-Cypermethrin Stress and Detoxification Role of CYP5011A1 in Tetrahymena thermophila

Affiliations

Metabolomics' Change Under β-Cypermethrin Stress and Detoxification Role of CYP5011A1 in Tetrahymena thermophila

Wenyong Zhang et al. Metabolites. .

Abstract

Background: β-cypermethrin (β-CYP) exhibits high toxicity to aquatic organisms and poses significant risks to aquatic ecosystems. Tetrahymena thermophila, a protozoa widely distributed in aquatic environments, can tolerate high concentrations of β-cypermethrin. However, the comprehensive detoxification mechanisms remain poorly understood in Tetrahymena.

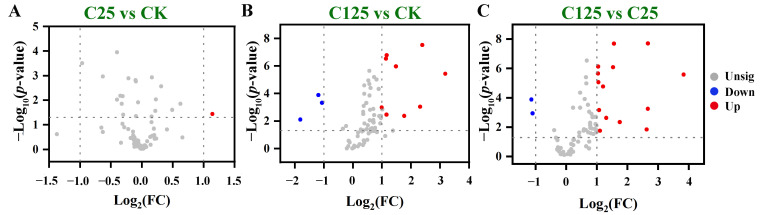
Methods: Untargeted metabolomics was used to explore the detoxification mechanisms of T. thermophila under β-CYP stress.

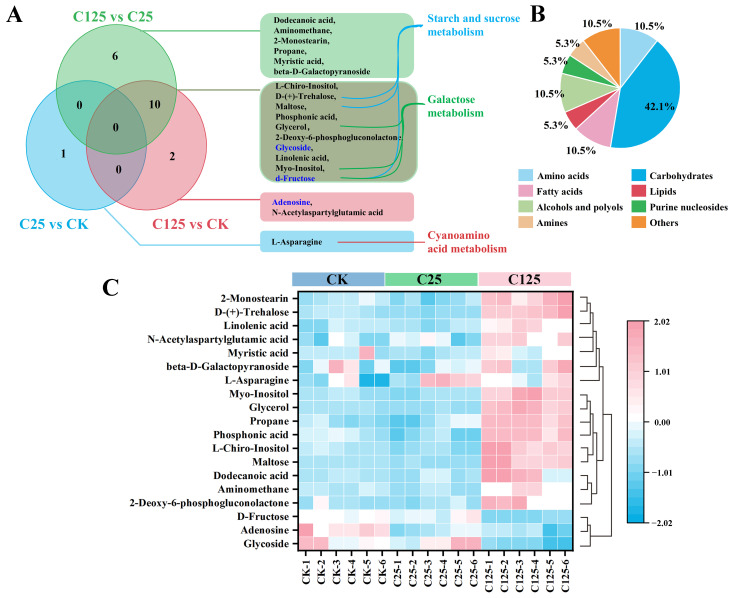
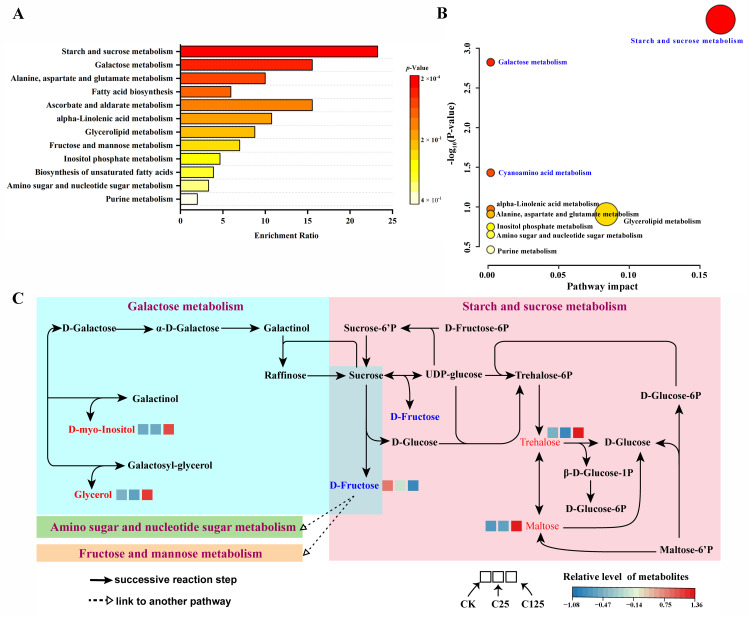
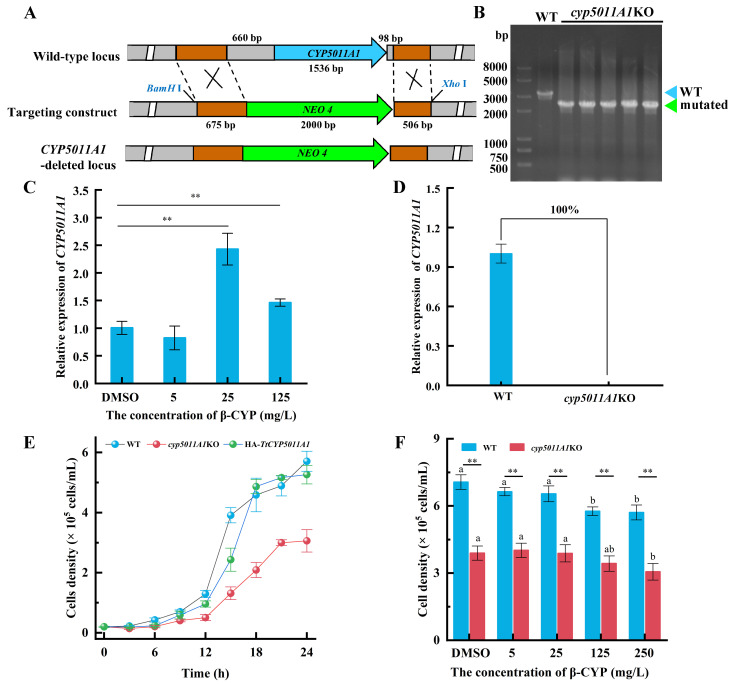
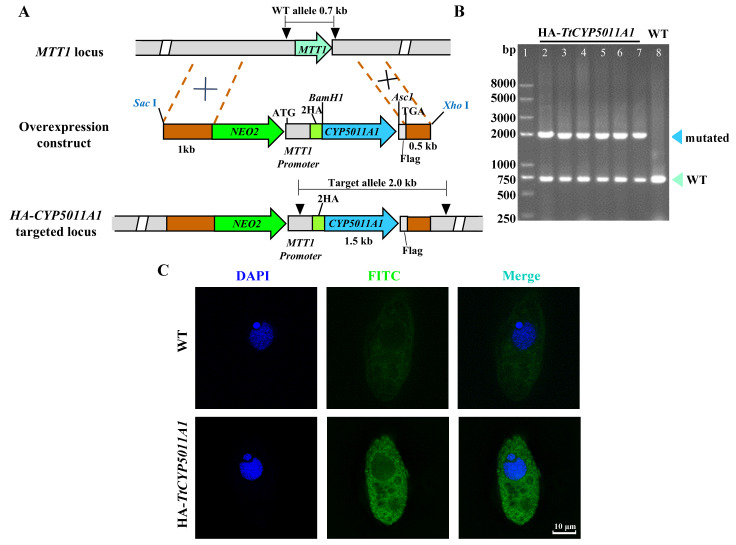
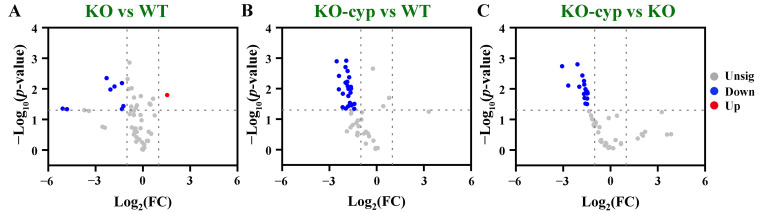
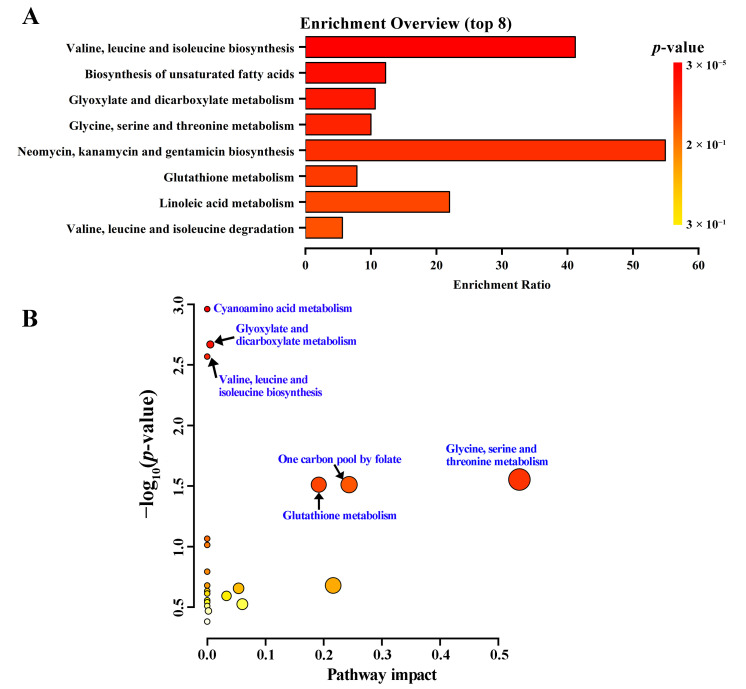
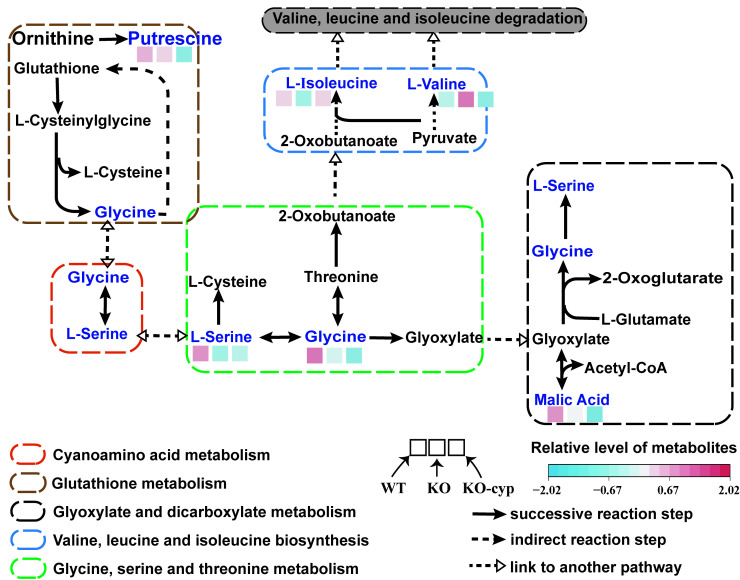
Results: Trehalose, maltose, glycerol, and D-myo-inositol were upregulated under β-CYP exposure in Tetrahymena. Furthermore, the expression level of CYP5011A1 was upregulated under β-CYP treatment. CYP5011A1 knockout mutants resulted in a decreasing proliferation rate of T. thermophila under β-CYP stress. The valine-leucine and isoleucine biosynthesis and glycine-serine and threonine metabolism were significantly affected, with significantly changed amino acids including serine, isoleucine, and valine.

Conclusions: These findings confirmed that T. thermophila develops β-CYP tolerance by carbohydrate metabolism reprogramming and Cyp5011A1 improves cellular adaptations by influencing amino acid metabolisms. Understanding these mechanisms can inform practices aimed at reducing the adverse effects of agricultural chemicals on microbial and environmental health.

Keywords: ?-cypermethrin; CYP5011A1; T. thermophila; metabolomics.


Conflict of interest statement

The authors declare no conflicts of interest.

Figures

Figure 1
Figure 1
Volcano plots of metabolites’ distribution between two comparison groups. (A) C25 vs CK; (B) C125 vs CK; and (C) C125 vs C25. Grey node (unsig) labels the metabolite level, which was not significantly different between the two comparison groups; red node (up) labels the metabolite level in the former group, which was significantly upregulated compared with the latter; and the opposite is true for blue node (down). CK refers to wild-type cells exposed to DMSO; C25 refers to wild-type cells exposed to 25 mg/L β-CYP; and C125 refers to wild-type cells exposed to 125 mg/L β-CYP.
Figure 2
Figure 2
Venn diagram, pie chart of classes, and hierarchically clustered heatmap of significantly changed metabolites (SCMs). (A) Venn diagram of differential metabolites. The corresponding differential metabolites are listed in the rounded rectangles. Metabolites in blue text indicate metabolite levels are under-regulated in the former group compared with those in the latter group. Metabolites being linked to metabolic pathway indicate that these metabolites are involve in the metabolic pathway. (B) The pie chart of classes of differential metabolites. (C) Hierarchically clustered heatmap of SCMs in CK, C25, and C125. Hierarchical clustering of 19 SCMs (p < 0.05, VIP > 1, and |log2FC| > 1) in T. thermophila under exposure to β-CYP using the normalized and pareto-scaled relative metabolite data. The color scale from blue to red indicates relative metabolite levels, from low to high.
Figure 3
Figure 3
Enrichment analysis and pathway analysis of T. thermophila exposed to β-CYP. (A) Enrichment analysis. Yellow and red indicate high and low p-values, respectively. The horizontal axis represents enrichment ratio. A larger enrichment ratio indicates a greater number of metabolites annotated to the pathway. (B) Summary of pathway analysis. Each bubble represents a specific pathway. Bubble size increases with the pathway impact values. Bubble colors represent −log10p-values, with darker colors indicating more critical metabolic pathways. Pathways with a p-value < 0.05 are considered significantly enriched and are labeled with blue text. (C) Schematic diagram of key metabolic pathways in T. thermophila exposed to different concentrations of β-CYP. Upregulated metabolites are marked in red text and downregulated metabolites in blue text in schematic diagram. Different colored square boxes indicate the main differential metabolite levels in CK, C25, and C125. The black solid arrows represent successive reaction steps in cells, while the dotted hollow arrows represent metabolites linked to other metabolic pathways.
Figure 4
Figure 4
Construction of CYP5011A1 knockout mutant strains and comparison of cell density across different strains. (A) Schematic diagram of cyp5011A1KO construction. Cyan arrow represents CYP5011A1 (1536 bp), the green arrow represents the Neo4 cassette (approximately 2000 bp), and the brown rectangular boxes represents the flanking sequences of CYP5011A1. CYP5011A1 was replaced by the Neo4 cassette through homologous recombination to generate mutants. X represents the location where homologous recombination occurs. (B) The identification of mutants cyp5011A1KO. The mutants cyp5011A1KO were identified by PCR. The fragment in WT is approximately 3296 bp, while the fragment in mutants is 2483 bp, as labeled by triangles. (C) Relative expression of CYP5011A1 in WT under exposure to different concentrations of β-CYP. (D) The identification of mutants cyp5011A1KO by qRT-PCR. The relative expression of CYP5011A1 is zero in mutants, confirming the successful generation of CYP5011A1 knockout strains. (E) Comparison of cell density across different strains under 250 mg/L β-CYP stress. (F) Comparison of cell density across different strains exposed to varying concentrations of β-CYP for 24 h. Different letters in the bar chart denote statistically significant differences between the same strains exposed to different β-CYP concentrations, as determined by post hoc multiple comparisons. Asterisk (**) denotes highly significant difference between two groups (p < 0.01 from two-tailed Student’s T-test).
Figure 5
Figure 5
Construction of HA-TtCYP5011A1 and immunofluorescence localization of HA-Cyp5011A1 in T. thermophila. (A) Schematic diagram of HA-TtCYP5011A1 construction. Gene CYP5011A1 (cyan arrow) was inserted downstream of two HA tag (2HA) under the control of MTT1 (metallothionein 1) promoter. The brown rectangular boxes represent the flanking sequences of MTT1. In T. thermophila, the MTT1 coding sequences in the wild-type (WT) strain were replaced by HA-CYP5011A1 with the NEO2 cassette through homologous recombination to generate HA-TtCYP5011A1. X labels the location where homologous recombination occurs. (B) The identification of HA-TtCYP5011A1 by PCR. The fragment in WT is approximately 750 bp, while the fragment in the mutant is 2036 bp. (C) Immunofluorescence localization of HA-Cyp5011A1 in T. thermophila. HA-Cyp5011A1 is localized in the cytoplasm by indirect immunofluorescence via HA tagging (FITC, green). The nuclei are stained blue by DAPI.
Figure 6
Figure 6
Volcano plots of metabolites’ distribution between two comparison groups. (A) KO vs WT; (B) KO-cyp vs WT; and (C) KO-cyp vs KO. Grey nodes (unsig), red nodes (up), and blue nodes (down) have the same meaning as in Figure 1. WT refers to wild-type cells under exposure to DMSO; KO refers to the cyp5011A1KO strain under exposure to DMSO; and KO-cyp refers to the cyp5011A1KO strain exposed to 125 mg/L β-CYP.
Figure 7
Figure 7
Enrichment analysis and pathway analysis of differential metabolites in cyp5011A1KO compared with WT. (A) The enrichment analysis (top 8, p-values < 0.05). Yellow and red indicate high and low p-values, respectively. The horizontal axis represents enrichment ratio with larger values indicating a greater number of metabolites annotated to the pathway. (B) Summary of pathway analysis. Each bubble represents a specific pathway. Bubble size increases with pathway impact values, and colors indicate −log10p-values, with darker colors representing more critical metabolic pathways. Pathways with p-values < 0.05 are considered significantly enriched and are labeled with blue text.
Figure 8
Figure 8
Schematic diagram of related metabolic pathways in cyp5011A1KO compared with WT. Differential metabolites are marked in blue text with colored square box in schematic diagram. The colors within the square boxes indicate the metabolites’ level in cells. Arrows represent the direction of reactions. Dotted black solid arrows indicate metabolites that indirectly participate in reaction steps, while dashed black hollow arrows indicate metabolites involved in other metabolic pathways. Dotted rectangles with rounded corners represent the metabolic pathways.

Similar articles

References

    1. Ahamad A., Kumar J. Pyrethroid pesticides: An overview on classification, toxicological assessment and monitoring. J. Hazard. Mater. Adv. 2023;10:100284. doi: 10.1016/j.hazadv.2023.100284. - DOI
    1. Nazemi A., Khajehali J., Van Leeuwen T. Incidence and characterization of resistance to pyrethroid and organophosphorus insecticides in Thrips tabaci (Thysanoptera: Thripidae) in onion fields in Isfahan, Iran. Pestic. Biochem. Physiol. 2016;129:28–35. doi: 10.1016/j.pestbp.2015.10.013. - DOI - PubMed
    1. Trout R.T., Brown G.C., Potter M.F., Hubbard J.L. Efficacy of two pyrethroid insecticides applied as barrier treatments for managing mosquito (Diptera: Culicidae) populations in suburban residential properties. J. Med. Entomol. 2007;44:470–477. doi: 10.1093/jmedent/44.3.470. - DOI - PubMed
    1. Gu S., Zhang Q., Gu J., Wang C., Chu M., Li J., Mo X. The stereoselective metabolic disruption of cypermethrin on rats by a sub-acute study based on metabolomics. Environ. Sci. Pollut. Res. Int. 2023;30:31130–31140. doi: 10.1007/s11356-022-24359-w. - DOI - PubMed
    1. Ma C., Wei D., Liu P., Fan K., Nie L., Song Y., Wang M., Wang L., Xu Q., Wang J., et al. Pesticide Residues in Commonly Consumed Vegetables in Henan Province of China in 2020. Front. Public Health. 2022;10:901485–901494. doi: 10.3389/fpubh.2022.901485. - DOI - PMC - PubMed

LinkOut - more resources