

The Role of Enoyl Reductase in the Monacolin K Biosynthesis Pathway in Monascus spp
- PMID: 40137237
- PMCID: PMC11943018
- DOI: 10.3390/jof11030199
The Role of Enoyl Reductase in the Monacolin K Biosynthesis Pathway in Monascus spp
Abstract
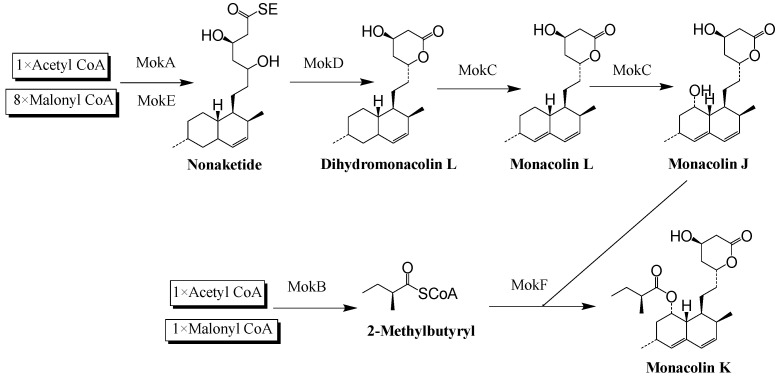
Monacolin K (MK), a secondary metabolite produced by Monascus spp. with the ability to inhibit cholesterol production, is structurally identical to lovastatin produced by Aspergillus terreus. In the lovastatin biosynthetic pathway, the polyketide synthase (PKS) encoded by lovB must work together with the enoyl reductase encoded by lovC to ensure lovastatin production. However, it is unclear whether mokA and mokE in the MK gene cluster of Monascus spp., both of which are highly homologous to lovB and lovC, respectively, also have the same functions for MK biosynthesis. In the current study, the high-yielding MK M. pilosus MS-1 was used as the research object, and it was found that the enoyl reductase domain of MokA may be non-functional due to the lack of amino acids at active sites, a function that may be compensated for by MokE in the MK synthesis pathway. Then, the mokE-deleted (ΔmokE), -complemented (ΔmokE::mokE), and -overexpressed (PgpdA-mokE) strains were constructed, and the results showed that ΔmokE did not produce MK, and ΔmokE::mokE restored MK synthesis, while the ability of PgpdA-mokE to produce MK was increased by 32.1% compared with the original strain MS-1. These results suggest that the MokA synthesized by Monascus spp. must be assisted by MokE to produce MK, just as lovastatin produced by A. terreus, which provides clues for further genetic engineering to improve the yield of MK in Monascus spp.
Keywords: Monascus pilosus; biosynthetic pathway; gene cluster; monacolin K.
Conflict of interest statement
The authors declare no conflicts of interest.
Figures


Similar articles
-
Cloning and characterization of monacolin K biosynthetic gene cluster from Monascus pilosus.J Agric Food Chem. 2008 Jul 23;56(14):5639-46. doi: 10.1021/jf800595k. Epub 2008 Jun 26. J Agric Food Chem. 2008. PMID: 18578535
-
Production of Monacolin K in Monascus pilosus: Comparison between Industrial Strains and Analysis of Its Gene Clusters.Microorganisms. 2021 Apr 2;9(4):747. doi: 10.3390/microorganisms9040747. Microorganisms. 2021. PMID: 33918292 Free PMC article.
-
Effective enhancement of the ability of Monascus pilosus to produce lipid-lowering compound Monacolin K via perturbation of metabolic flux and histone acetylation modification.Food Res Int. 2024 Nov;195:114961. doi: 10.1016/j.foodres.2024.114961. Epub 2024 Aug 23. Food Res Int. 2024. PMID: 39277234
-
An overview on the biosynthesis and metabolic regulation of monacolin K/lovastatin.Food Funct. 2020 Jul 22;11(7):5738-5748. doi: 10.1039/d0fo00691b. Food Funct. 2020. PMID: 32555902 Review.
-
Aspects of the biosynthesis of non-aromatic fungal polyketides by iterative polyketide synthases.Antonie Van Leeuwenhoek. 2000 Dec;78(3-4):287-95. doi: 10.1023/a:1010294330190. Antonie Van Leeuwenhoek. 2000. PMID: 11386351 Review.
References
-
- Chen W.P., He Y., Zhou Y.X., Shao Y.C., Feng Y.L., Li M., Chen F.S. Edible filamentous fungi from the species Monascus: Early traditional fermentations, modern molecular biology, and future genomics. Compr. Rev. Food Sci. Food Saf. 2015;14:555–567. doi: 10.1111/1541-4337.12145. - DOI
-
- Fu J.Q. Historical materials of ancient red yeast rice and red yeast wine. Winemak. Sci. Technol. 2008;19:108–112. (In Chinese)
Grants and funding
LinkOut - more resources
Full Text Sources
Miscellaneous
