MRI-Based Model for Personalizing Neoadjuvant Treatment in Breast Cancer
- PMID: 40137566
- PMCID: PMC11946387
- DOI: 10.3390/tomography11030026
MRI-Based Model for Personalizing Neoadjuvant Treatment in Breast Cancer
Abstract
Background: Functional tumor volume (FTV), measured from dynamic contrast-enhanced MRI, is an imaging biomarker that can predict treatment response in breast cancer patients undergoing neoadjuvant chemotherapy (NAC). The FTV-based predictive model, combined with core biopsy, informed treatment decisions of recommending patients with excellent responses to proceed to surgery early in a large NAC clinical trial.
Methods: In this retrospective study, we constructed models using FTV measurements. We analyzed performance tradeoffs when a probability threshold was used to identify excellent responders through the prediction of pathology complete response (pCR). Individual models were developed within cohorts defined by the hormone receptor and human epidermal growth factor receptor 2 (HR/HER2) subtype.
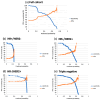
Results: A total of 814 patients enrolled in the I-SPY 2 trial between 2010 and 2016 were included with a mean age of 49 years (range: 24 to 77). Among these patients, 289 (36%) achieved pCR. The area under the ROC curve (AUC) ranged from 0.68 to 0.74 for individual HR/HER2 subtypes. When probability thresholds were chosen based on minimum positive predictive value (PPV) levels of 50%, 70%, and 90%, the PPV-sensitivity tradeoff varied among subtypes. The highest sensitivities (100%, 87%, 45%) were found in the HR-/HER2+ sub-cohort for probability thresholds of 0, 0.62, and 0.72; followed by the triple-negative sub-cohort (98%, 52%, 4%) at thresholds of 0.13, 0.58, and 0.67; and HR+/HER2+ (78%, 16%, 8%) at thresholds of 0.34, 0.57, and 0.60. The lowest sensitivities (20%, 0%, 0%) occurred in the HR+/HER2- sub-cohort.
Conclusions: Predictive models developed using imaging biomarkers, alongside clinically validated probability thresholds, can be incorporated into decision-making for precision oncology.
Keywords: breast cancer; dynamic contrast-enhanced MRI; functional tumor volume; neoadjuvant chemotherapy; pathologic complete response; therapy decision.
Conflict of interest statement
L.J.E. is on the Blue Cross Medical Advisory Panel, is an uncompensated board member of Quantum Leap Healthcare Collaborative, and is involved in an investigator-initiated trial for high-risk DCIS funded by Moderna for a phase 1 study of DCIS. C.Y. receives institutional research grants from NCI/NIH and salary support and travel reimbursement from Quantum Leap Healthcare Collaborative, has a US patent titled, “Breast cancer response prediction subtypes”, (No. 18/174,491), and received a University of California Inventor Share but declares no non-financial competing interests. L.J.v.’t.V. is a part-time employee of and has stock in Agendia NV and serves as an advisor and receives stock options from Exai, Inc., but declares no non-financial competing interests. A.M.D. receives institutional research funding from Novartis, Pfizer, Genentech, and Neogenomics, and serves as a Program Chair on the Scientific Advisory Committee of ASCO, but declares no non-financial competing interests. N.M.H. receives institutional research funding from NIH but declares no non-financial competing interests. All authors declare no conflicts of interest regarding this study.
Figures


References
-
- Yee D., DeMichele A.M., Yau C., Isaacs C., Symmans W.F., Albain K.S., Chen Y.-Y., Krings G., Wei S., Harada S., et al. Association of Event-Free and Distant Recurrence-Free Survival with Individual-Level Pathologic Complete Response in Neoadjuvant Treatment of Stages 2 and 3 Breast Cancer: Three-Year Follow-up Analysis for the I-SPY2 Adaptively Randomized Clinical Trial. JAMA Oncol. 2020;6:1–9. doi: 10.1001/jamaoncol.2020.2535. - DOI - PMC - PubMed
-
- Spring L.M., Fell G., Arfe A., Sharma C., Greenup R., Reynolds K.L., Smith B.L., Alexander B., Moy B., Isakoff S.J., et al. Pathologic Complete Response after Neoadjuvant Chemotherapy and Impact on Breast Cancer Recurrence and Survival: A Comprehensive Meta-analysis. Clin. Cancer Res. 2020;26:2838–2848. doi: 10.1158/1078-0432.CCR-19-3492. - DOI - PMC - PubMed
-
- Marinovich M.L., Macaskill P., Irwig L., Sardanelli F., Mamounas E., von Minckwitz G., Guarneri V., Partridge S.C., Wright F.C., Choi J.H., et al. Agreement between MRI and pathologic breast tumor size after neoadjuvant chemotherapy, and comparison with alternative tests: Individual patient data meta-analysis. BMC Cancer. 2015;15:662. doi: 10.1186/s12885-015-1664-4. - DOI - PMC - PubMed
-
- Hylton N.M., Blume J.D., Bernreuter W.K., Pisano E.D., Rosen M.A., Morris E.A., Weatherall P.T., Lehman C.D., Newstead G.M., Polin S., et al. Locally advanced breast cancer: MR imaging for prediction of response to neoadjuvant chemotherapy—Results from ACRIN 6657/I-SPY TRIAL. Radiology. 2012;263:663–672. doi: 10.1148/radiol.12110748. - DOI - PMC - PubMed
MeSH terms
Substances
Grants and funding
LinkOut - more resources
Full Text Sources
Medical
Research Materials
Miscellaneous

