. 2025 Mar 26;82(1):131.
doi: 10.1007/s00018-025-05648-2.

Microglia regulate myelin clearance and cholesterol metabolism after demyelination via interferon regulatory factor 5

Affiliations

Microglia regulate myelin clearance and cholesterol metabolism after demyelination via interferon regulatory factor 5

Alejandro Montilla et al. Cell Mol Life Sci. .

Abstract

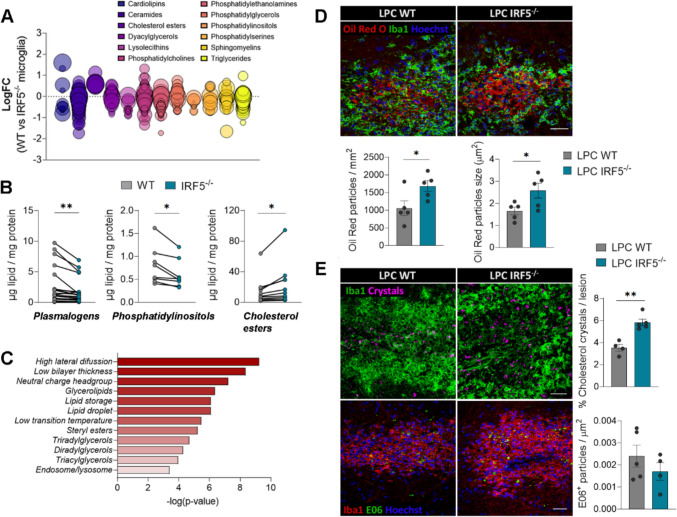
Interferon regulatory factor 5 (IRF5) is a transcription factor that plays a role in orchestrating innate immune responses, particularly in response to viral infections. Notably, IRF5 has been identified as a microglia risk gene linked to multiple sclerosis (MS), but its specific role in MS pathogenesis remains unclear. Through the use of Irf5-/- mice, our study uncovers a non-canonical function of IRF5 in MS recovery. Irf5-/- mice exhibited increased damage in an experimental autoimmune encephalomyelitis (EAE) model and demonstrated impaired oligodendrocyte recruitment into the lesion core following lysolecithin-induced demyelination. Transcriptomic and lipidomic analyses revealed that IRF5 has a role in microglia-mediated myelin phagocytosis, lipid metabolism, and cholesterol homeostasis. Indeed, Irf5-/- microglia phagocytose myelin, but myelin debris is not adequately degraded, leading to an accumulation of lipid droplets, cholesterol esters, and cholesterol crystals within demyelinating lesions. This abnormal buildup can hinder remyelination processes. Importantly, treatments that promote cholesterol transport were found to reduce lipid droplet accumulation and mitigate the exacerbated damage in Irf5-/- mice with EAE. Altogether, our study identified the antiviral transcription factor IRF5 as a key transcriptional regulator of lipid degradation and cholesterol homeostasis and suggest that loss of IRF5 function leads to pathogenic lipid accumulation in microglia, thereby obstructing remyelination. These data and the fact that Irf5 polymorphisms are significantly associated with MS, highlight IRF5 as a potential therapeutic target to promote regenerative responses.

Keywords: Demyelination; IRF5; Lipid homeostasis; Microglia; Multiple sclerosis; Remyelination.


Conflict of interest statement

Declarations. Conflict of interest: All authors declare that they have no conflicts of interest. Ethical approval: All experiments were performed according to the procedures approved by the Ethics Committee of the University of the Basque Country (UPV/EHU). Animals were handled in accordance with the European Communities Council Directive. The study in human tissue samples was approved by the local human ethics committee (CEISH/18/2010), and all participants provided their written informed consent to take part in the study. The study was performed in accordance with the Declaration of Helsinki.

Figures

Fig. 1
Fig. 1
Microglial Irf5 expression is decreased in MS patients. A Relative expression of Irf5 in total mRNA isolated from post-mortem optic nerve samples of control and MS patients (n = 10) as analyzed by qPCR. B In silico quantification of microglial Irf5 expression in healthy and early active MS human brain tissues (n = 4). Raw data obtained from Gene Expression Omnibus (accession number: GSE124335). Data are presented as mean ± SEM and were analyzed by Student's t‐test (A, B, D) and by one-way ANOVA (C). *p < 0.05, **p < 0.01, ***p < 0.001. C Relative expression of Irf5 in FACS isolated microglia (CD11b+/CD45low) from the brain and spinal cord of control mice and from EAE mice at chronic phase (n = 6–8). D Reanalysis of Irf5 expression from scRNAseq data obtained at EAE peak [31, 33]
Fig. 2
Fig. 2
IRF5 deficiency exacerbates EAE recovery phase. A Neurological score of WT and Irf5-/- mice (n = 10 mice per group; one representative experiment of three independent experiments). B Histograms showing clinical parameters associated to EAE induction (onset day) and recovery (days needed to initiate recovery and percentage of recovery from peak), in WT and Irf5-/- mice (n = 13–20). C Representative images of lumbar spinal cord EAE lesions (top), Iba1 (middle) and SMI32 staining’s (bottom) in WT and Irf5-/- mice. Immunohistochemistry was performed at 40 post-immunization. Scale bar = 30 µm. Histograms show the extent of the lesions in relation to the total white matter area of the section analyzed (n = 6–8) and the accumulation of Iba1+ microglia/macrophages (n = 6–11) as well axonal damage (SMI-32) in relation to the lesioned area or the total white matter area, respectively (n = 5). D Representative images showing the accumulation of CD3+ T cells and B220+ B cells in EAE lesions of WT and Irf5-/- mice at day 40 post-immunization. Scale bar = 30 µm. Histograms show the number of cells normalized to the white matter area (n = 6–8). Data are presented as means ± SEM. Statistics were performed with Mann-Whitney U test (neurological score, A) and Student's t–test (B-D). **p < 0.01, ***p < 0.001.
Fig. 3
Fig. 3
IRF5 deficiency alters remyelination after lysolecithin (LPC)-induced lesions. A Scheme showing the experimental design of LPC-induced demyelinated lesions. Analysis was performed at 14 post-injection, a time coincident with the initiation of the remyelinating response. B Representative images of MBP and Iba1 stainings in LPC lesions of WT and Irf5-/- mice. Scale bar = 75 µm. Histograms show the extent of demyelinated area and the accumulation of microglia in the lesions in each mice (n = 4). C Assessment of the number of Olig2+ and CC1+ oligodendrocytes in LPC-induced lesions, delineated by MBP loss (n = 3–4). Scale bar = 75 µm. D Distribution analysis (mean ± SD) of MBP (left), Olig2 (middle) and CC1 (right) immunostaining, in an area comprising equal distances of lesioned and non-lesioned white matter (lesion border indicated with dotted lines; n = 4). Note the higher accumulation of Olig2+ and CC1+ cells outside the lesion core. Data are presented as means ± SEM. Statistics were performed with Student's t-test. *p < 0.05
Fig. 4
Fig. 4
RNA sequencing of WT and Irf5-/- microglia highlights novel roles for IRF5. A (Above) Experimental strategy for isolating spinal cord microglia at 4 ºC to avoid overactivation and RNA sequencing. (Below) Flow cytometry gating strategy for isolation of microglia from the spinal cord of WT and Irf5-/- mice. B Volcano plot depicting gene expression comparison between WT and Irf5-/- microglia. Each dot represents an individual gene. Non-significant genes are marked in gray while significant ones (log2 (FC) > 1 and p-value < 0.05) are marked in colour. C GO enrichment analysis of the DEGs identified between WT and Irf5-/- microglia, showing the top GOs enriched in WT condition. Green plot shows annotations downregulated in Irf5-/- microglia. D Histograms showing alterations in genes involved in GTPase activity (top left), endocytosis (top right) and lipid homeostasis (bottom) (n = 3–4). E GO enrichment analysis of the DEGs identified between WT and Irf5-/- microglia, showing the top GOs enriched in KO condition. Orange plot shows annotations downregulated in knock-out microglia. Data are presented as means ± SEM. Statistics were performed with Student's t–test.*p < 0.05
Fig. 5
Fig. 5
Irf5-/- microglia showed altered motility in vitro but not after demyelination. A Representative frames of the wound healing assay performed on WT and Irf5-/- microglia, at the initial time of the experiment as well as after 12 and 24 hours. Yellow lines delimitate the scratched, non-occupied area at each timepoint. Scale bar = 10 µm. Histograms below show the percentage of the initially scratched area occupied by microglial cells (n = 3 independent experiments). B Scheme showing the experimental design for the histological analysis of microglial migration after LPC demyelinating lesions, in WT and Irf5-/- mice, at day 4 post-injection. C Representative confocal images of LPC-induced lesions 4 days after injection, showing MBP and Iba1 immunostaining. Scale bar = 100 µm. Histograms show the extent of demyelinated area in WT and Irf5-/- mice and Iba1+ immunoreactivity in relation to the lesioned area in each animal (n = 4–5). Data are presented as means ± SEM. Statistics were performed with Student's t–test.*p < 0.05
Fig. 6
Fig. 6
Myelin phagocytosis and degradation are altered in Irf5-/- microglia both in vitro and after demyelination. A Representative images of myelin debris accumulation (characterized by high MBP immunoreactivity) in WT and Irf5-/- EAE lesions, at the recovery phase. Scale bar = 50 µm. Histogram shows the lesioned area occupied by this debris in each section (n = 3). B Representative images of myelin debris accumulation at day 14 post-LPC demyelinating injections, in WT and Irf5-/- mice. Scale bar = 10 µm. Histogram shows the lesioned area occupied by this debris in each animal (n = 3–4). C Representative images of MBP and Iba1 immunostaining in spinal cord sections of WT and Irf5-/- mice. Insets show higher magnifications of the indicated boxes. Scale bar = 20 µm. Histogram shows the phagocytic index of microglia/macrophages in these conditions (n = 3). D Representative images showing phagocytosis (1h) and degradation (24h) of Alexa-488 labelled-myelin by WT and Irf5-/- microglia in vitro. Scale bar = 50 µm. Histogram shows the fluorescence of 488-myelin in the cells, defined as ROIs using Iba1 staining (n = 6 independent experiments). Data are presented as means ± SEM. Statistics were performed with Student's t–test. *p < 0.05, ***p < 0.001
Fig. 7
Fig. 7
IRF5 deficiency leads to defective myelin processing and accumulation of abnormal lipid structures. A Bubble plot showing the concentration differences of specific lipids, classified by lipid classes, accumulated in WT and Irf5-/- microglia, after 48 hour-treatment with myelin (n = 4 independent experiments). Each bubble represents a unique lipid species, and the size of the bubbles represents the significance of the individual lipid comparison. B Histograms showing the concentration of different plasmalogens, phosphatidylinositols and cholesterol esters in WT and Irf5-/- microglia, after 48 hours of myelin challenge. Data are presented as means for every lipid species from 4 independent experiments. C Lipid ontology (LION) enriched terms in Irf5-/- microglia compared to WT microglia. D Immunostaining of Oil Red O (ORO) and Iba1 in LPC-induced lesions (14 dpi) in WT and Irf5-/- mice. Histograms show the number and size of ORO+ particles in the lesions (n = 5). Scale bar = 25 µm. E Representative images of cholesterol crystals, acquired by reflection microscopy (above), and E06+ (below) particles in LPC-induced lesions (14 dpi), both in WT and Irf5-/- mice. Histograms show the percentage of lesioned area occupied by crystals and the number of EO6+ particles normalized to the lesion area (n = 4–5). Scale bar = 30 µm. Data are presented as means ± SEM. Statistics were performed with Student's t-test. *p < 0.05, **p < 0.01
Fig. 8
Fig. 8
IRF5 deficiency alters ch25h expression and cholesterol transport. A Left, gene expression of cholesterol 25-hydroxylase (ch25h) in WT and Irf5-/- microglia isolated by FACS (Fig. 4A). Right, scheme of the metabolic role of ch25h and 25-hydroxy-cholesterol (25HC) in lipid homeostasis. B Relative expression of ch25h and cholesterol transporters Abca1 and Abcg1 in total mRNA isolated from spinal cord of control and chronic EAE mice (n = 4–7). C Irf5 expression in cultured microglia in basal condition and after exposure to myelin (25 μg/ml, 48h) or LPS plus IFNγ (10 ng/ml and 20 ng/ml respectively) (n = 4 independent experiments). Scale bar = 20 μm. D ABCA1 and ABCG1 expression in WT and Irf5-/- microglia in basal conditions and after myelin exposure (25 μg/ml, 48h) (n= 5–7 independent experiments in duplicate). Scale bar = 50 μm. *p < 0.05, **p < 0.01, ***p < 0.001
Fig. 9
Fig. 9
Treatment preventing CE accumulation reverses EAE exacerbated pathology in Irf5-/- mice. A Neurological score of Irf5-/- mice treated with saline, GW3965 (20 mg/kg; i.p.), an LXR agonist, and 2-hydroxypropyl-β-cyclodextrin (HβCD; 400 mg/kg; subcutaneous injection every 48h). Treatments started at 10 days postimmunization to avoid interfering with immune priming (n = 8–10). B Neurological score of WT mice treated with GW3965 and HβCD, as described before (n = 8). C Representative images of lipid droplets (Oil Red O staining) accumulation inside the EAE lesions in Irf5-/- mice without treatment or treated with GW3965 and HβCD Histograms show the number and size of ORO+ particles in the lesions (n = 3–4). Scale bar = 25 µm. Data are presented as means ± SEM. Statistics were performed with Mann-Whitney U test (neurological score, A) and one way ANOVA (B)

References

    1. Dendrou CA, Fugger L, Friese MA (2015) Immunopathology of multiple sclerosis. Nat Rev Immunol 15:545–558. 10.1038/nri3871 - PubMed
    1. Filippi M, Bar-Or A, Piehl F et al (2018) Multiple sclerosis. Nat Rev Dis Prim 4:43. 10.1038/s41572-018-0041-4 - PubMed
    1. Yong VW (2022) Microglia in multiple sclerosis: protectors turn destroyers. Neuron 110:3534–3548. 10.1016/j.neuron.2022.06.023 - PubMed
    1. Distéfano-Gagné F, Bitarafan S, Lacroix S, Gosselin D (2023) Roles and regulation of microglia activity in multiple sclerosis: insights from animal models. Nat Rev Neurosci 24:397–415. 10.1038/s41583-023-00709-6 - PubMed
    1. Yamasaki R, Lu H, Butovsky O et al (2014) Differential roles of microglia and monocytes in the inflamed central nervous system. J Exp Med 211:1533–1549. 10.1084/jem.20132477 - PMC - PubMed

MeSH terms

LinkOut - more resources