. 2025 Apr 22;44(4):115462.
doi: 10.1016/j.celrep.2025.115462. Epub 2025 Mar 25.

The actin and microtubule network regulator WHAMM is identified as a key kidney disease risk gene

Affiliations

The actin and microtubule network regulator WHAMM is identified as a key kidney disease risk gene

Dhanunjay Mukhi et al. Cell Rep. .

Abstract

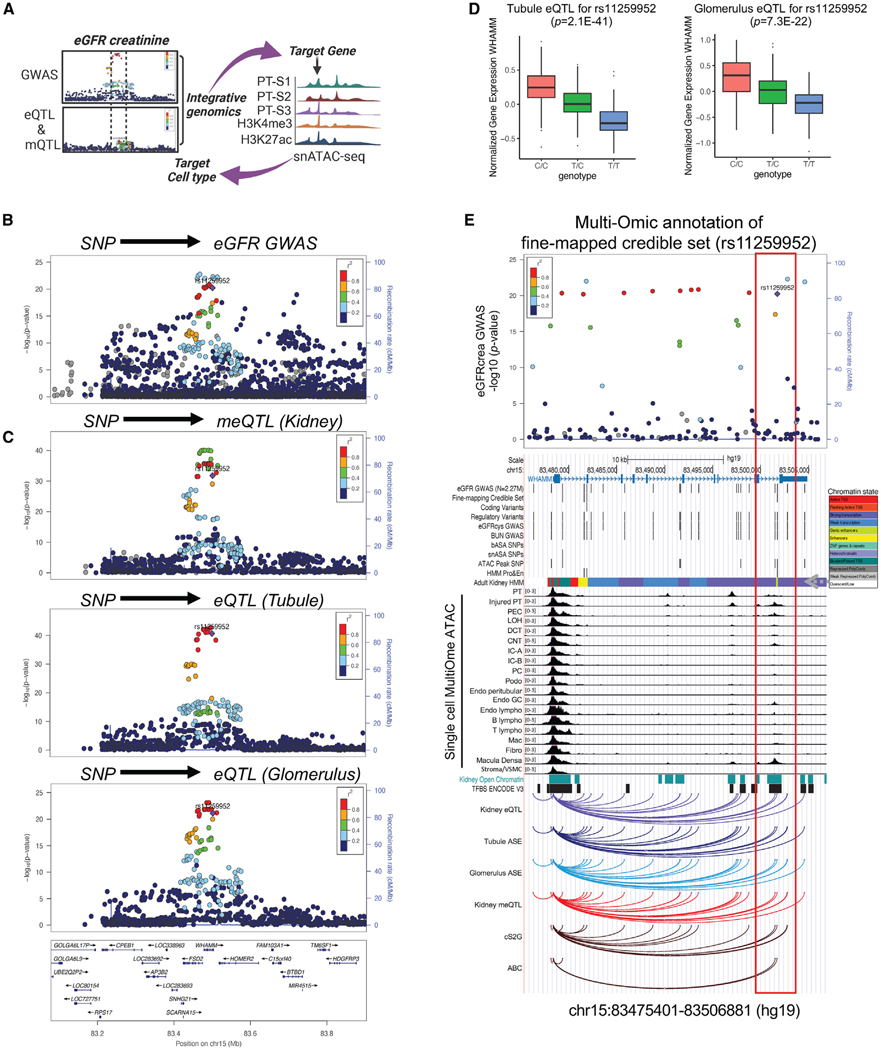
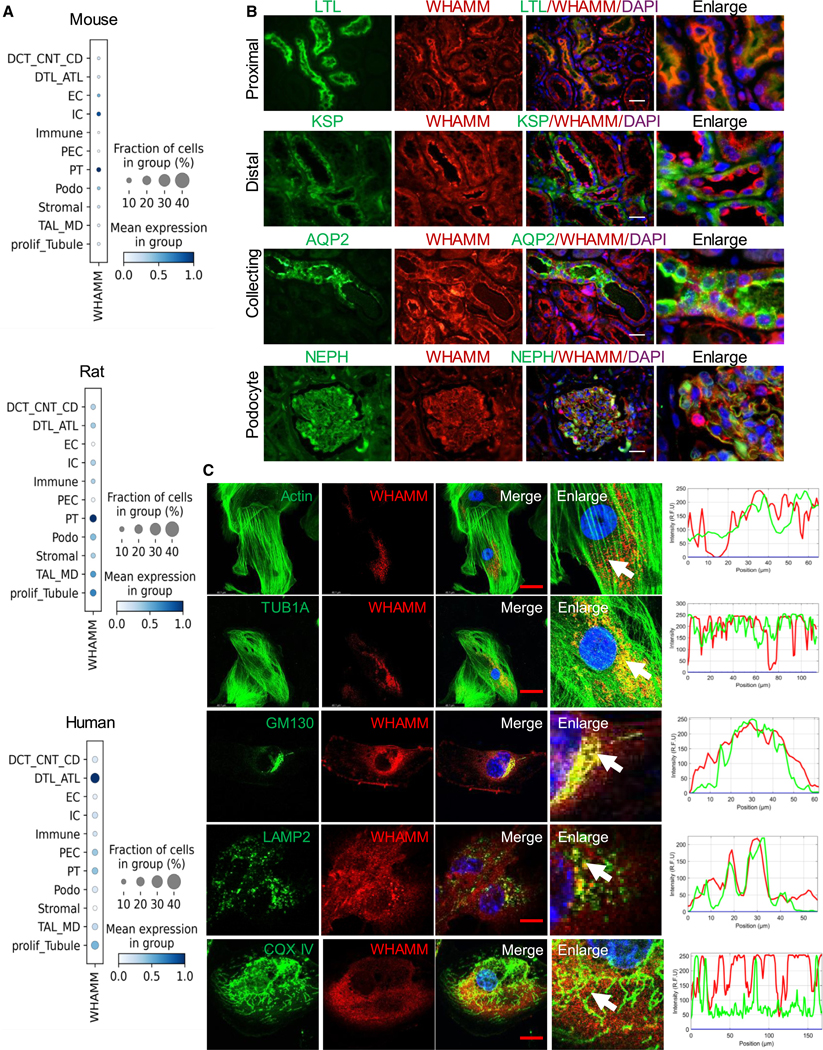
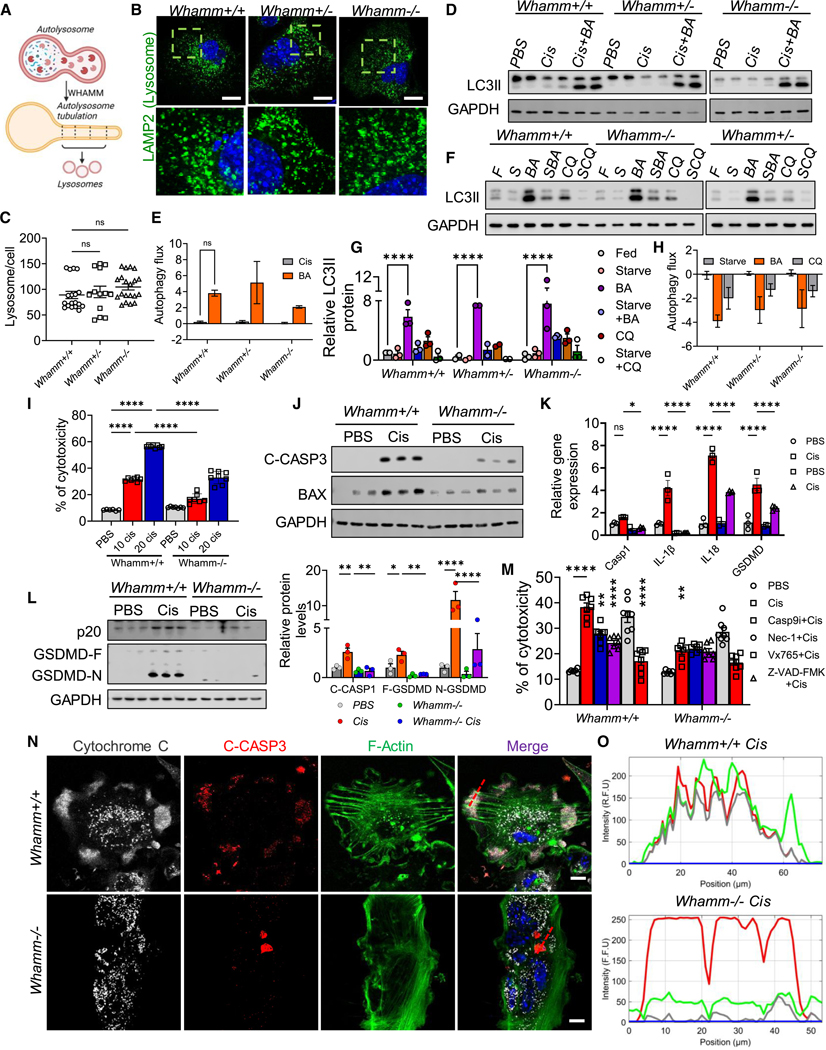
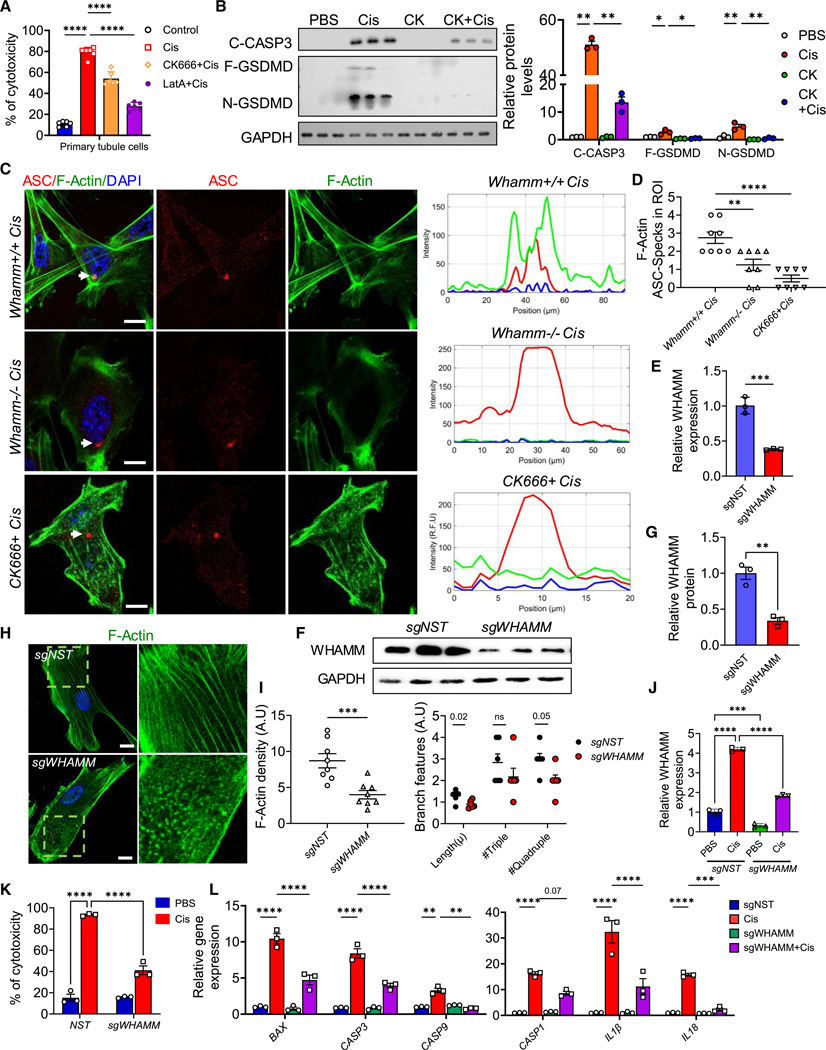
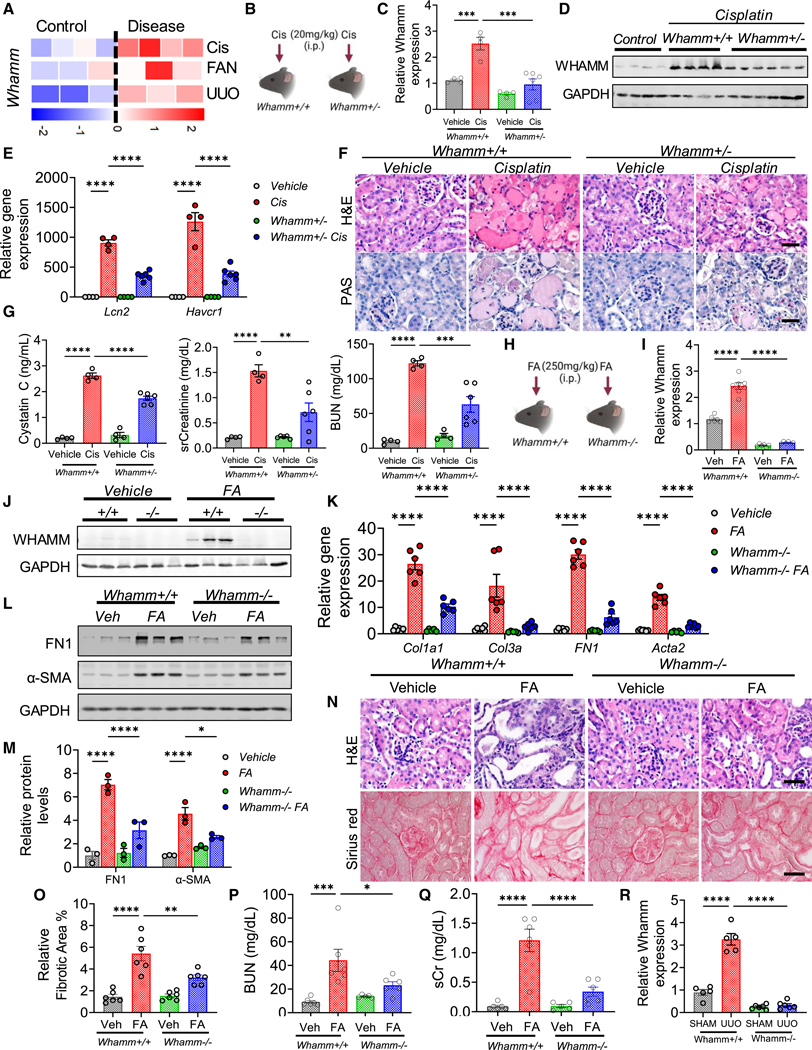
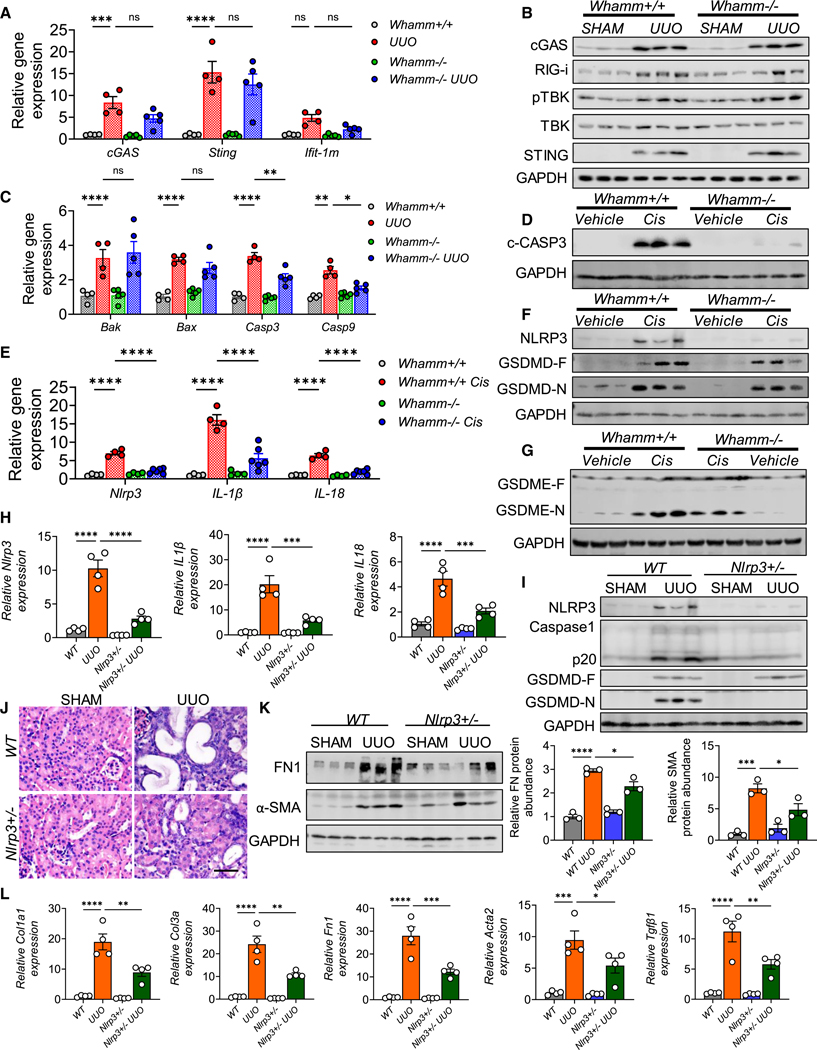
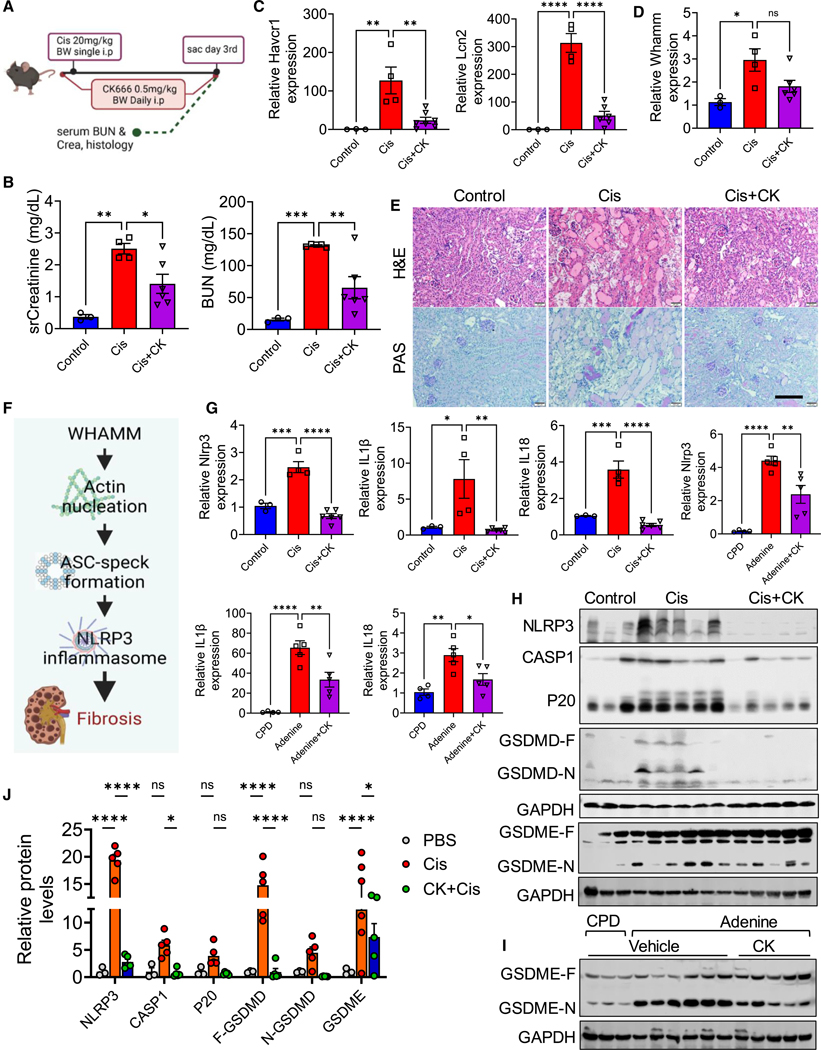
Nearly 850 million people suffer from kidney disease worldwide. Genome-wide association studies identify genetic variations at more than 800 loci associated with kidney dysfunction; however, the target genes, cell types, and mechanisms remain poorly understood. Here, we show that nucleotide variants on chromosome 15 are not only associated with kidney dysfunction but also regulate the expression of Wasp homolog associated with actin, membranes, and microtubules (WHAMM). WHAMM expression is higher in mice and patients with chronic and acute kidney disease. Mice with genetic deletion of Whamm appear healthy at baseline but develop less injury following cisplatin, folic acid, and unilateral ureteral obstruction. In vitro cell studies indicate that WHAMM controls cell death by regulating actin-mediated cytochrome c release from mitochondria and the formation of ASC speck. Pharmacological inhibition of actin dynamics mitigates kidney disease in experimental models. In summary, our study identifies a key role of WHAMM in the development of kidney disease.

Keywords: AKI; CKD; CP: Cell biology; GWAS; WASP family; WHAMM; actin cytoskeleton; autophagy; cell death; kidney tubules.


Conflict of interest statement

Declaration of interests The authors declare no competing interests.

Figures

Figure 1.
Figure 1.. Genetic analysis prioritized WHAMM as a kidney disease gene
(A) Experimental scheme of gene prioritization. (B) LocusZoom plot of WHAMM eGFR GWAS locus in 2.27 million individuals of multi-ethnic ancestry. The x axis shows the chromosomal location, and the y axis shows the strength of association (–log(p)) with kidney function. The fine-mapped variant (rs11259952) was used as the index SNP in each panel, with the color representing its squared correlation (r2) with other variants. (C) Upper: LocusZoom plot of genetic variants associated with kidney methylation (n = 443), (middle) kidney tubule (n = 356), and (lower) glomerulus (n = 303) compartment-specific QTLs. The x axis indicates chromosomal location, and the y axis shows the strength of the association (–log(p)) on chromosome 15. (D) Human kidney WHAMM expression in tubule (n = 356) and glomerulus (n = 303) compartments. The y axis shows normalized WHAMM expression, and the x axis shows genotype information. (E) Multi-omic annotation of the fine-mapped credible set (rs11259952). From top to bottom: GWAS LocusZoom, gene structure, annotation of variants, human kidney chromatin states, single-cell MultiOme ATAC, kidney open chromatin, transcription factor binding sites, kidney eQTL, tubule and glomerulus ASE, Cell2 Gene (cS2G), and ABC. See also Figure S1 and Table S1.
Figure 2.
Figure 2.. Human kidney WHAMM expression and its cellular localization
(A) WHAMM expression in mouse (left), rat (middle), and human (right) kidney single-nucleus RNA sequencing. The color indicates mean expression, and the size of the bubble indicates the percentage of cells expressing WHAMM. (B) Double-immunofluorescence of WHAMM with cell-type-specific markers in human kidney samples. Proximal (LTL, lotus tetragonolobus lectin), distal (KSP, kidney-specific cadherin), collecting tubules (AQP2, aquaporin 2), and podocyte (NEPH, nephrin). Scale bars, 20 μm. (C) Left: confocal imaging for WHAMM (red) with F-actin (phalloidin, green), microtubules (TUB1A, green), cis-Golgi (GM130, green), lysosomes (LAMP2, green), and mitochondria (COX IV, green) in human renal proximal tubule cells. Scale bars 20 μm. Right: arrowheads represent the colocalized region analyzed for profile intensity.
Figure 3.
Figure 3.. Characterizing autophagy and cell death in WHAMM knockout primary tubule cells
(A) The process of autolysosome reformation. (B) Confocal imaging of LAMP2 (green) and DAPI (blue) in Whamm+/+, Whamm+/−, and Whamm−/− primary tubule cells (TECs). Scale bars, 20 μm. (C) Quantification of the number of lysosomes per cell. (D) Immunoblots of LC3II and GAPDH in TECs treated with 20 μM cisplatin (Cis) for 3 h, with or without bafilomycin A (Cis+BA). (E) Autophagy flux in TECs treated with cisplatin for 3 h. (F) Immunoblots of LC3II and GAPDH in TECs under serum starvation for 10 h with various autophagy inhibitors: fed (F), starved (S), BA in the fed state (BA), BA with starvation (SBA), chloroquine in the fed state (CQ), and chloroquine with starvation (SCQ). (G) Quantification of LC3II protein levels in TECs treated with various autophagy inducers and blockers. (H) Autophagy flux was measured in TECs under serum starvation for 10 h. (I) Percent of cytotoxicity in TECs treated with PBS or 20 μM cisplatin. (J) Immunoblots of cleaved caspase-3 (C-CASP3) and BAX in TECs treated with PBS or cisplatin. (K) Transcript levels of Caspase 1, IL-1β, IL-18, and gasdermin d (Gsdmd) in TECs treated with PBS or cisplatin. (L) Left: immunoblots of cleaved caspase-1 (CASP1-p20), gasdermin D full-length (GSDMD-F), cleaved (GSDMD-N) protein, and GAPDH in TECs treated with PBS or cisplatin. Right: quantification of immunoblots normalized to relative GAPDH level. (M) Cell death analysis in TECs treated with PBS or cisplatin, in the presence of inhibitors for caspase-9 (Casp9i), pan-apoptosis (Z-VAD-FMK), necrosis (Nec-1), and pyroptosis (Vx 765). (N) Confocal imaging of F-actin (green), cleaved-CASP3 (red), and cytochrome c (white) in TECs treated with cisplatin. Scale bars, 20 μm. (O) Profile intensity plots of a colocalized region (red dotted lines). Data are presented mean ± SEM. p values were determined by one-way ANOVA in GraphPad Prism 10 software. *p < 0.05, ***p < 0.001, ****p < 0.0001. See also Figures S2 and S3.
Figure 4.
Figure 4.. Role of actin polymerization during apoptosis and pyroptosis
(A) Percent of cytotoxicity of primary tubule cells (TECs) treated with PBS or cisplatin in the presence or absence of CK666 (CK) or latrunculin A (LatA). (B) Left: immunoblots of cleaved caspase-3 (C-CASP3), full-length gasdemrin D (F-GSDMD), cleaved GSDMD (N-GSDMD) protein, and GAPDH in TECs treated with PBS, cisplatin, or CK666 plus cisplatin. Right: quantification of immunoblots normalized to relative GAPDH level. (C) Left: confocal imaging of F-actin and ASC in Whamm+/+ and Whamm−/− TECs treated with cisplatin, and in Whamm+/+ TECs treated with CK666 plus cisplatin. Scale bars, 20 μm. Right: ImageJ analysis for the colocalized region (arrow): (upper) Whamm+/+, (middle) Whamm−/−, (lower) Whamm+/+ with CK666. (D) Quantification of ASC specks in TECs treated with cisplatin or CK666 plus cisplatin per region of interest (ROI). (E) WHAMM transcript levels in human renal proximal tubular epithelial cells (RPTECs) transduced with sgWHAMM or non-target (sgNST) virus. (F) Immunoblot of WHAMM in RPTECs after CRISPRi-mediated WHAMM silencing. (G) Quantification of WHAMM immunoblot normalized to GAPDH level. (H) F-Actin staining in RPTECs after CRISPRi-mediated silencing of WHAMM. Scale bar, 20 μm. Box indicates zoomed area. (I) ImageJ analysis of F-actin density and actin branch features. (J) WHAMM transcript levels in RPTECs following CRISPRi-mediated WHAMM silencing and treated with 40 μM of cisplatin for 24 h. (K) Percent of cytotoxicity in RPTECs after sgWHAMM or sgNST infection and treated with cisplatin for 24 h. (L) Transcript levels of BAX, CASPASE3 (CASP3), CASP9, and CASP1, interleukin 1β (IL-1B), and IL-18 in RPTECs after sgWHAMM or sgNST infection and treated with cisplatin for 24 h. Data are presented mean ± SEM. p values were determined by one-way ANOVA or unpaired t test in GraphPad Prism 10 software. *p < 0.05, ***p < 0.001, ****p < 0.0001. See also Figure S3.
Figure 5.
Figure 5.. Genetic deletion of Whamm protects from cisplatin-AKI and FA-induced nephropathy
(A) Whamm gene expression in RNA-seq from experimental mouse kidney diseases (n= 3–4 per group). Each square is one kidney sample. The rows represent the disease model, cisplatin (Cis), FAN (folic acid), UUO (unilateral-ureteral-obstruction). Colors indicate relative gene expression (blue, low; red, high). (B) Experimental scheme of the cisplatin disease model. (C) Whamm transcript levels in kidneys of Whamm+/+ (n = 4) and Whamm+/− mice (n = 6) injected with saline (vehicle) or cisplatin (Cis). (D) Immunoblots of WHAMM and GAPDH in kidney lysates of vehicle- or cisplatin-treated mice. (E) Kidney transcript levels of Lcn2 and Havcr1 in cisplatin-injected mice. (F) H&E and PAS kidney sections from cisplatin-injected mice. (G) Cystatin C, serum creatinine (sCr), and blood urea nitrogen (BUN) in serum samples of cisplatin-injected mice. (H) Experimental scheme of the folic acid (FA) disease model. (I) Transcript levels of Whamm in Whamm+/+ (n = 6) and Whamm−/− mice (n = 6) injected with FA or vehicle (Veh). (J) Immunoblots of WHAMM and GAPDH in kidney lysates of mice injected with FA. (K) Transcript levels of collagen type 1 (Col1a1), type 3a (Col3a), fibronectin (FN1), and alpha smooth muscle actin (Acta2) in mice injected with FA. (L) Immunoblots of FN1, α-SMA, and GAPDH in kidney lysates of mice injected with FA. (M) Quantification of FN1 and α-SMA normalized to relative GAPDH level. (N) H&E and Sirius red staining in kidney sections of mice injected with FA. Scale bars, 20 μm. (O) Relative percentage of kidney fibrosis in mice injected with FA. (P) BUN in the FA model. (Q) sCr in the FA model. R. Whamm transcript levels in Whamm+/+ (n = 5) and Whamm−/− mice (n = 6) in SHAM and UUO operated kidneys. Data are presented mean ± SEM. p values were determined by one-way ANOVA in GraphPad Prism 10 software. *p < 0.05, ***p < 0.001, ****p < 0.0001. See also Figures S4 and S5.
Figure 6.
Figure 6.. Lower apoptosis and NLRP3 inflammasome activation in Whamm−/− mice
(A) Transcript levels of cGAS, Sting, and Ifit-1m in wild-type (Whamm+/+) (n = 4) and Whamm knockout (Whamm−/−) mice (n = 6) following UUO or SHAM operation. (B) Immunoblots of cGAS, RIG-i, pTBK, TBK, STING, and GAPDH in the UUO model. (C) Transcript levels of Bak, Bax, caspase-3 (Casp3), and Casp9 SHAM or UUO operated kidneys in Whamm+/+ (n = 4) and Whamm−/− mice (n = 5). (D) Immunoblots of cleaved caspase-3 (C-CASP3), and GAPDH in the cisplatin model. (E) Transcript levels of Nlrp3, IL-1β, and IL-18 in Whamm+/+ (n = 4) and Whamm−/− mice (n = 6) injected with vehicle or cisplatin. (F) Immunoblots of NLRP3, gasdermin D full-length (GSDMD-F), cleaved (GSDMD-N) forms, and GAPDH in the cisplatin model. (G) Immunoblots of GSDME-F, GSDME-N, and GAPDH cisplatin models. (H) Transcript levels of Nlrp3, IL-1β, and IL-18 in WT (n = 4) and Nlrp3+/− (n = 4) subjected to SHAM or UUO injury. (I) NLRP3, caspase-1, p20 (cleaved caspase-1), GSDMD-F, and GSDMD-N immunoblots in the UUO model. (J) H&E-stained kidney images. Insets are zoomed regions. Scale bar, 20 μm. (K) Left: immunoblots of FN1, α-SMA, and GAPDH in UUO kidneys. Right: quantification of FN1 and α-SMA normalized to the relative GAPDH level. (L) Transcript levels of Col1a1, Col3a, Fn1, Acta2Tgfβ1 in UUO kidneys of WT and Nlrp3+/− mice (n = 4). Data are presented mean ± SEM. p values were determined by one-way ANOVA in GraphPad Prism 10 software. *p < 0.05, ***p < 0.001, ****p < 0.0001. See also Figure S6.
Figure 7.
Figure 7.. Pharmacological disruption of actin filament branching and network formation in AKI and CKD
(A) Experimental scheme of generating the CK666 (CK)-cisplatin model (CK-Cis). (B) Serum creatinine (sCr) and blood urea nitrogen (BUN) in the CK-Cis model (n = 3–6 mice per group). (C) Transcript levels of Havcr1, and Lcn2 in the CK-Cis model. (D) Whamm transcript level in the CK-Cis model. (E) H&E and PAS staining in kidney sections from the CK-Cis model. Scale bar, 50 μm. (F) The proposed mechanism for WHAMM in kidney disease. (G) Transcript levels of Nlrp3, IL-1β, and IL-18 in the CK-Cis model or mice fed on adenine or control diet (CPD) (n = 4–5 mice per group). (H) Immunoblots of NLRP3, CASP1, cleaved CASP1 (P20), GSDMD-F, GSDMD-N, and GSDME in the CK-Cis model. (I) Immunoblots for cleaved GSDME and GAPDH in kidneys of control (n = 3) or adenine-fed mice (n = 6) injected with CK666 (n = 5). (J) Quantification of NLRP3, CASP1, cleaved CASP1 (P20), GSDMD-F, GSDMD-N, and cleaved GSDME immunoblots in the CK-Cis model. Data are presented mean ± SEM. p values were determined by one-way ANOVA in GraphPad Prism 10 software. *p < 0.05, ***p < 0.001, ****p < 0.0001. See also Figure S7.

Similar articles

References

    1. Evans M, Lewis RD, Morgan AR, Whyte MB, Hanif W, Bain SC, Davies S, Dashora U, Yousef Z, Patel DC, and Strain WD (2022). A Narrative Review of Chronic Kidney Disease in Clinical Practice: Current Challenges and Future Perspectives. Adv. Ther 39, 33–43. 10.1007/s12325-021-01927-z. - DOI - PMC - PubMed
    1. Zoccali C, Vanholder R, Massy ZA, Ortiz A, Sarafidis P, Dekker FW, Fliser D, Fouque D, Heine GH, Jager KJ, et al. (2017). The systemic nature of CKD. Nat. Rev. Nephrol 13, 344–358. 10.1038/nrneph.2017.52. - DOI - PubMed
    1. Tuttle KR, Alicic RZ, Duru OK, Jones CR, Daratha KB, Nicholas SB, McPherson SM, Neumiller JJ, Bell DS, Mangione CM, and Norris KC (2019). Clinical Characteristics of and Risk Factors for Chronic Kidney Disease Among Adults and Children: An Analysis of the CURECKD Registry. JAMA Netw. Open 2, e1918169. 10.1001/jamanetworkopen.2019.18169. - DOI - PMC - PubMed
    1. Mukhi D, and Susztak K. (2020). The transcriptomic signature of the aging podocyte. Kidney Int. 98, 1079–1081. 10.1016/j.kint.2020.08.004. - DOI - PMC - PubMed
    1. Tin A, and Köttgen A. (2020). Genome-Wide Association Studies of CKD and Related Traits. Clin. J. Am. Soc. Nephrol 15, 1643–1656. 10.2215/CJN.00020120. - DOI - PMC - PubMed

LinkOut - more resources