. 2025 Mar 28;11(13):eads6021.
doi: 10.1126/sciadv.ads6021. Epub 2025 Mar 26.

An in vivo screen identifies NAT10 as a master regulator of brain metastasis

Affiliations

An in vivo screen identifies NAT10 as a master regulator of brain metastasis

Jocelyn F Chen et al. Sci Adv. .

Abstract

Emerging evidence has shown that epigenetic regulation plays a fundamental role in cancer metastasis, the major cause of cancer-related deaths. Here, we conducted an in vivo screen for vulnerabilities of brain metastasis and identified N-acetyltransferase 10 (NAT10) as a driver of brain metastasis. Knockdown of NAT10 restrains cancer cell proliferation and migration in vitro and tumor growth and brain metastasis in vivo. The poorly characterized RNA helicase domain of NAT10 is critical for cell growth in vitro, while both RNA helicase and NAT domains are essential for primary tumor growth and brain metastasis in vivo. Mechanically, NAT10 promotes the expression of 3-phosphoglycerate dehydrogenase (PHGDH) and phosphoserine aminotransferase 1 (PSAT1), two enzymes for serine biosynthesis implicated in brain metastasis. Silencing PHGDH or PSAT1 in metastatic breast cancer cells inhibits their growth in the serine/glycine-limited condition, phenocopying the effects of NAT10 depletion. These findings establish NAT10 as a key regulator of brain metastasis and nominate NAT10 as a target for treating metastasis.


Figures

Fig. 1.
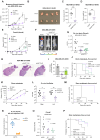
Fig. 1.. In vivo and in vitro screens identified epigenetic dependencies of BCBM.
(A) Schematic of shRNA screens for identifying the epigenetic dependencies of BCBM. pGIPZ plasmid harboring barcode and hairpin targeting certain epigenetic factor was digested and subcloned into the pINDUCER10 plasmid, which contains HSV1-TK/GFP/Fluc (herpes simplex virus 1–thymidine kinase/green fluorescent protein/firefly luciferase) (TGL) triple reporter gene. Epigenetic regulator inducible knockdown (KD) cell lines were equally mixed and injected into mice or cultured under control or DOX (1 μg/ml)–treated condition. Brain (in vivo) and cells (in vitro) were harvested for gDNA and subjected to barcode qPCR as the screening output. IC, intracardiac. (B) Log2 (fold change) of the in vivo versus in vitro screen results for each epigenetic regulator. FC, fold change. (C) Relative abundance of barcode for shRNA against NAT10 in cells cultured with control or DOX treatment. (D) Relative abundance of barcode for shRNA against NAT10, BUD31, and Checkpoint kinase 1 (CHEK1) in the brain tissue from control and DOX-treated mice. BUD31 and CHEK1 serve as positive and negative controls, respectively. Significance in (C) and (D) was determined using unpaired Student’s t test. **P < 0.01; ***P < 0.001.
Fig. 2.
Fig. 2.. NAT10 promotes breast cancer proliferation across subtypes and metastatic organotropisms.
(A) Western blot of indicated proteins in 231-BrM3 cells harboring inducible control or NAT10 targeting shRNAs (shNAT10 #1 and shNAT10 #2) after 3 days of DOX (1 μg/ml) induction. (B and C) Colony formation assays of 231-BrM3 cells with NAT10 knockdown or control after 9 days of either control or DOX (1 μg/ml) treatment. Representative images (B) and quantification (C) are shown. (D) Percentage of cells in G1, S, and G2-M phase from indicated cells fixed at 18 hours post-refeeding. (E) BrdU incorporation assay of 231-BrM3 cells after 3 days of DOX (1 μg/ml) induction. (F to O) Colony formation assays of indicated cells after 9 days of either control or DOX (1 μg/ml) treatment. Representative images [(F), (H), (J), (L), and (N)] and quantification [(G), (I), (K), (M), and (O)] are shown. Significance in (C) to (E), (G), (I), (K), (M), and (O) was determined using unpaired Student’s t test. *P < 0.05; **P < 0.01; ***P < 0.001; ****P < 0.0001.
Fig. 3.
Fig. 3.. NAT10 is essential for primary breast tumor growth and brain metastasis.
(A) Bioluminescence signals of mice injected into the fourth mammary fat pad with 231-BrM3 cells harboring inducible shCtrl or shNAT10 #1. ROI, region of interest. (B) Representative images of primary tumors from mice in (A) on day 58. (C and D) Quantification of primary tumor volume (C) and weight (D) from mice in (A) on day 58. (E) Normalized bioluminescence signals of brain metastases of mice. (F) Representative bioluminescence images of mice in (E) on day 28. (G) Quantification of ex vivo bioluminescence signals of the brain tissues from mice in (E) on day 35 postinjection. (H) Representative hematoxylin and eosin (H&E) stain of sagittal brain tissue slides. Brain metastases were marked with *. (I) Quantification of tumor burden. n = 3 for each group. (J) Kaplan-Meier plot of brain metastasis–free survival in (E). shCtrl (n = 10), shNAT10 #1 (n = 9), and shNAT10 #2 (n = 10). (K) Normalized bioluminescence signals of bone metastasis of mice. (L) Quantification of ex vivo bioluminescence signals of hindlimbs (left and right) from mice in (K) on day 35. (M) Kaplan-Meier plot of bone metastasis–free survival in (K). (N) Relative abundance of barcode for shRNA against NAT10 in lung tissue from control and DOX-treated mice. (O) Quantification of brain metastasis burden from mice on day 35. (P) Kaplan-Meier plot of brain metastasis–free survival in (O). Unpaired two-tailed Student’s t tests were used in (A), (E), (I), (K), and (N) with the data representing average ± SEM. Unpaired Mann-Whitney tests were used in (C), (D), (G), (L), and (O), and each dot represents one mouse. Log-rank Mantel-Cox tests were used in (J), (M), and (P). *P < 0.05; **P < 0.01; ***P < 0.001; ****P < 0.0001.
Fig. 4.
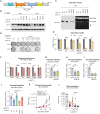
Fig. 4.. RNA helicase and NAT domains are required for NAT10-mediated phenotypes.
(A) Schematic of NAT10 with indicated domains and mutation sites. G641E, acetyltransferase dead mutant; K290A, helicase dead mutant; K426R, NAT10 autoacetylation site mutant. aa, amino acids. (B) Western blot of indicated proteins in 231-BrM3 cells with inducible control or shNAT10, followed by rescuing with empty vector (EV), shRNA-resistant WT NAT10, or mutants. Cells were collected after 3 days of control or DOX (1 μg/ml) induction. (C) Immuno–Northern blots (NB) of ac4C modification in total RNA extracted from indicated 231-BrM3 cells. Cells were induced with DOX (1 μg/ml) for 5 days. (D and E) Colony formation assays of indicated 231-BrM3 cells after 9 days of either control or DOX (1 μg/ml) treatment. Representative images (D) and quantification (E) are shown. (F) Organoid growth assays of indicated 231-BrM3 cells after 12 days of either control or DOX (1 μg/ml) treatment. The three-dimensional (3D) growth of cells was determined by in vitro luciferase activity and normalized to control. (G to I) Transwell migration assays of 231-BrM3 (G), MDA-MB-157 (H), and MDA-MB-231 (I) cells after 3 days of DOX (1 μg/ml) induction. (J) Transwell migration assays of 231-BrM3 cells with indicated genetic manipulations after 5 days of DOX (1 μg/ml) induction. Mean values reflecting the relative migration abilities of each group are labeled in the plot. n.s., not significant. (K) Quantification of bioluminescence (BLU) signals of mice injected into the fourth mammary fat pad with indicated 231-BrM3 cells. The data represent average ± SEM. (L) Quantification of BLU signals of brain metastases in mice on day 35. Each dot represents one animal. Unpaired two-tailed Student’s t test was used in (E) to (K), while unpaired two-tailed Mann-Whitney test was used in (L). *P < 0.05; **P < 0.01; ***P < 0.001; ****P < 0.0001.
Fig. 5.
Fig. 5.. NAT10 promotes PHGDH and PSAT1 expression in an RNA helicase–dependent manner.
(A) The overlap of differentially expressed genes in RNA-seq and differentially expressed proteins in DIA-MS of 231-BrM3 cells with NAT10 knockdown (shNAT10 #1) versus control cells (shCtrl). For both RNA-seq and DIA-MS, the differentially expressed candidates were defined as P < 0.5 and log2 (fold change) > 0.3 or <−0.3. CCND3, Cyclin D3; PARD6B, partitioning defective 6 homolog beta; PPP1R12C, protein phosphatase 1 regulatory subunit 12C; FAM98A, family with sequence similarity 98 member A; PTK2, protein tyrosine kinase; HLA-DRA, major histocompatibility complex, class II, DR Alpha; GINS1, GINS complex subunit 1; MTA1, metastasis associated 1. (B) Glucose-derived l-serine biosynthesis pathway. Glu, glutamate; NAD+, nicotinamide adenine dinucleotide (oxidized form); NADH, reduced form of NAD+; α-KG, α-ketoglutarate. (C and D) Relative mRNA levels (C) and protein levels (D) in 231-BrM3 cells with indicated genetic manipulations. (E) The relative translation rate of 231-BrM3 with or without NAT10 knockdown. (F) Western blots of indicated proteins in parental MDA-MB-231, 231-BrM2, and 231-BrM3 cell lines. (G) PHGDH mRNA levels in 13 paired primary and metastatic breast tumors from our previous dataset (GSE148005). In total, 11 of 13 metastatic breast tumors show higher PHGDH expression than in primary tumors (lines in red). Met, metastasis. (H) NAT10, PHGDH, and PSAT1 mRNA levels in primary breast tumors and their matched metastases in the AURORA US Metastasis Project (GSE193103). Pri, primary breast tumors; LN mets, lymph node metastasis. P values are marked in red if lower than 0.05. Unpaired Student’s t test was used in (C) and (E), while paired Student’s t test was used in (G) and (H). **P < 0.01; ***P < 0.001; ****P < 0.0001.
Fig. 6.
Fig. 6.. NAT10-regulated PHGDH and PSAT1 are critical for the proliferation of metastatic breast cancer cells under serine/glycine-limited conditions.
(A) The concentration of serine, glycine, and glucose in DMEM-like, CSF-like, and w/o-Ser/Gly media. (B and C) Growth curves of 231-BrM3 and MDA-MB-231 cells in customized culture media (B) and the confluency at the end point (day 6) (C). (D and E) Growth curves of 231-BrM3 cells with or without NAT10 knockdown in customized culture media (D) and the confluency at the end point (day 6) (E), with average confluency labeled. (F) Western blots of 231-BrM3 cells with scrambled control and shRNA against PHGDH or PSAT1. (G) Growth curves of control or 231-BrM3 cells with PHGDH or PSAT1 knockdown in customized culture media. (H) Validation of PHGDH or PSAT1 reexpression in NAT10-depleted 231-BrM3 cells by Western blots. (I) Growth curves of control cells, NAT10-depleted 231-BrM3 cells with EV, PHGDH rescue, or PSAT1 rescue in customized culture media. (J) A model depicting the roles of NAT10 in brain metastasis, created with BioRender. Unpaired Student’s t test was used in (C) and (E). *P < 0.05; ****P < 0.0001.

References

    1. Chen J. F., Yan Q., The roles of epigenetics in cancer progression and metastasis. Biochem. J. 478, 3373–3393 (2021). - PMC - PubMed
    1. Martin A. M., Cagney D. N., Catalano P. J., Warren L. E., Bellon J. R., Punglia R. S., Claus E. B., Lee E. Q., Wen P. Y., Haas-Kogan D. A., Alexander B. M., Lin N. U., Aizer A. A., Brain metastases in newly diagnosed breast cancer: A population-based study. JAMA Oncol. 3, 1069–1077 (2017). - PMC - PubMed
    1. Cagney D. N., Martin A. M., Catalano P. J., Redig A. J., Lin N. U., Lee E. Q., Wen P. Y., Dunn I. F., Bi W. L., Weiss S. E., Haas-Kogan D. A., Alexander B. M., Aizer A. A., Incidence and prognosis of patients with brain metastases at diagnosis of systemic malignancy: A population-based study. Neuro Oncol. 19, 1511–1521 (2017). - PMC - PubMed
    1. Xiao W., Zheng S., Yang A., Zhang X., Zou Y., Tang H., Xie X., Breast cancer subtypes and the risk of distant metastasis at initial diagnosis: A population-based study. Cancer Manag. Res. 10, 5329–5338 (2018). - PMC - PubMed
    1. Lin N. U., Claus E., Sohl J., Razzak A. R., Arnaout A., Winer E. P., Sites of distant recurrence and clinical outcomes in patients with metastatic triple-negative breast cancer: High incidence of central nervous system metastases. Cancer 113, 2638–2645 (2008). - PMC - PubMed

MeSH terms

Substances