. 2025 Mar 28;11(13):eadt3311.
doi: 10.1126/sciadv.adt3311. Epub 2025 Mar 26.

Mycobacterium tuberculosis phagosome Ca2+ leakage triggers multimembrane ATG8/LC3 lipidation to restrict damage in human macrophages

Affiliations

Mycobacterium tuberculosis phagosome Ca2+ leakage triggers multimembrane ATG8/LC3 lipidation to restrict damage in human macrophages

Di Chen et al. Sci Adv. .

Abstract

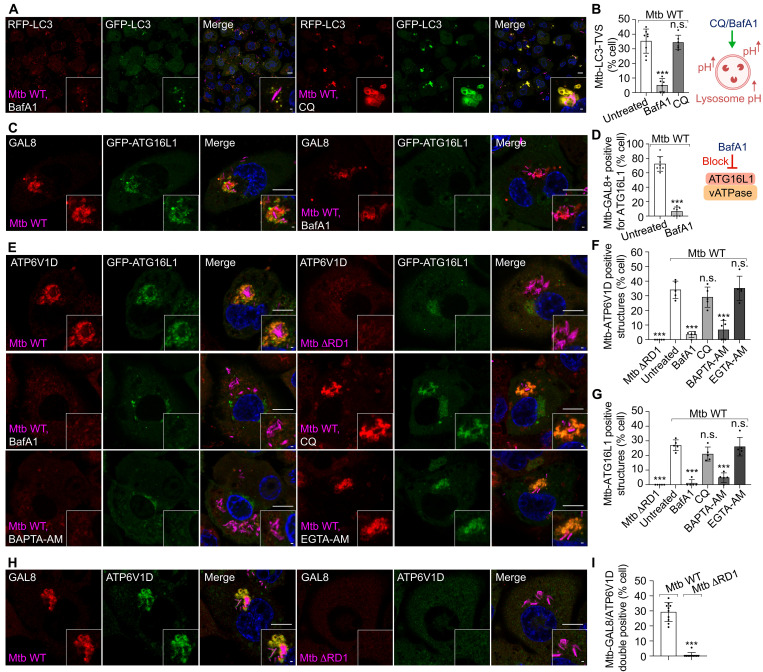
The role of canonical autophagy in controlling Mycobacterium tuberculosis (Mtb), referred to as xenophagy, is understood to involve targeting Mtb to autophagosomes, which subsequently fuse with lysosomes for degradation. Here, we found that Ca2+ leakage after Mtb phagosome damage in human macrophages is the signal that triggers autophagy-related protein 8/microtubule-associated proteins 1A/1B light chain 3 (ATG8/LC3) lipidation. Unexpectedly, ATG8/LC3 lipidation did not target Mtb to lysosomes, excluding the canonical xenophagy. Upon Mtb phagosome damage, the Ca2+ leakage-dependent ATG8/LC3 lipidation occurred on multiple membranes instead of single or double membranes excluding the noncanonical autophagy pathways. Mechanistically, Ca2+ leakage from the phagosome triggered the recruitment of the V-ATPase-ATG16L1 complex independently of FIP200, ATG13, and proton gradient disruption. Furthermore, the Ca2+ leakage-dependent ATG8/LC3 lipidation limited Mtb phagosome damage and restricted Mtb replication. Together, we uncovered Ca2+ leakage as the key signal that triggers ATG8/LC3 lipidation on multiple membranes to mitigate Mtb phagosome damage.


Figures

Fig. 1.
Fig. 1.. Ca2+ leakage after Mtb phagosome damage triggers ATG8/LC3 lipidation.
(A and B) Live-cell imaging sequence showing Ca2+ dynamic changes on the Mtb phagosome in THP-1 macrophages stably expressing LAMP1-GCaMP6f during Mtb WT (A) and Mtb ΔRD1 (B) infection. The square indicates the zoomed area. The Mtb phagosome segmentation and live fluorescence signal tracking were analyzed using TrackMate. The dashed circle represents the Mtb area used for LAMP1-GCaMP6f signal quantification. The background areas were random areas in the same cell without Mtb. The live-cell imaging started after 2-hour Mtb uptake. “0” in the series represents the time point for this sequence start. (C) Quantification of the amplitude change (ΔF/F0) of Mtb-LAMP1-GCaMP6f signal during 6 hpi under the indicated treatment conditions. Data points correspond to individual Mtb phagosomes = 12 to 16 from 3 to 10 independent experiments. (D) THP-1 macrophages stably expressing mCherry-LC3B at 2.5 hpi during Mtb WT and Mtb ΔRD1 infection (MOI: 2) under the indicated treatments. Zoomed-in high-resolution areas are shown in the corner. (E) Quantification shows the percentage of infected cells (% cell) showing Mtb-LC3-TVS related to (D). n (number of infected cells) = 118 to 163; data points correspond to individual technical replicates from three independent experiments. (F) Live-cell imaging sequence showing mCherry-LC3 and LAMP1-GCaMP6f changes during Mtb-WT infection. Images were processed with a Gaussian blur using a sigma (radius) of 1. The dashed circles represent the Mtb area used for mCherry-LC3 and LAMP1-GCaMP6f quantification in fig. S1H. Scale bars, in (A), (B), and (D): 10 μm (main images) and 1 μm (zoomed in); in (F): 1 μm.
Fig. 2.
Fig. 2.. Mtb phagosome damage–dependent Atg8/LC3 multimembrane lipidation does not target Mtb to lysosomes.
(A) Live-cell imaging sequence showing RFP-GFP-LC3 changes after Mtb infection. White square indicates zoomed-in area. The dashed circle represents the Mtb area used for Mtb-RFP-GFP-LC3 signal quantification in (B). Mtb dissociates from LC3-positive structures from 750 min. (B) Ratio change (F/F0) of RFP-LC3 and GFP-LC3 fluorescence intensity and the ratio change of RFP-LC3 (F/F0)/GFP-LC3 (F/F0) in (A). (C) Cumulative line scan ratio change in fluorescence intensity of RFP-LC3 (F/F0) to GFP-LC3 (F/F0) surrounding Mtb. n = 3. (D) Mtb WT and Mtb ΔRD1 infection (MOI: 2) in THP-1 macrophages stably expressing RFP-GFP-LC3B at 2.5 hpi under indicated treatments. (E) Quantification shows the percentage of infected cells (MOI: 2) showing RFP-LC3–positive and GFP-LC3–negative Mtb-LC3-TVS under indicated treatments and different postinfection time points related to (D). n (number of infected cells) = 97 to 195; data points correspond to individual technical replicates from three independent experiments. h, hours. (F) Quantification shows the percentage of infected cells showing both RFP-LC3– and GFP-LC3–positive Mtb-LC3-TVS related to (D). n (number of infected cells) = 105 to 195; data points correspond to individual technical replicates from three independent experiments. (G) CLEM analysis shows the RFP-LC3– and GFP-LC3–positive Mtb-LC3-TVS (2.5 hpi, MOI: 2) and LC3-negative phagosome during Mtb ΔRD1 infection. SEM, scanning electron microscopy. Scale bars, in (A) and (D): 10 μm (main images) and 1 μm (zoomed-in area); in (G): 1 μm (main images) and 200 nm (zoomed-in area).
Fig. 3.
Fig. 3.. Fusion of endolysosomes with Mtb LC3+ phagosomes provides multiple membrane sources.
(A) Live-cell imaging sequence and diagram showing GFP-LC3 and LTR changes during Mtb-WT infection. After Mtb phagosome damage, Mtb segregated (from 126 min) and the remaining LC3-positive compartment underwent acidification. Dashed circle represents the Mtb area used for LTR signal quantification in (C). (B) Live-cell imaging sequence and diagram showing GFP-LC3 and LTR changes during Mtb-WT infection. After Mtb phagosome damage, Mtb remained in GFP-LC3–positive compartments (Mtb-LC3-TVS). Mtb-LC3-TVS continuously fused with endolysosomes without acidification. Dashed circle represents the Mtb area used for Mtb compartment LTR signal quantification in (D). (C) Ratio change (F/F0) of GFP-LC3 and LTR fluorescence intensity surrounding Mtb in (A). (D) Ratio change (F/F0) of GFP-LC3 and LTR fluorescence intensity surrounding Mtb in (B). (E) Percentage of Phenotype 1 and Phenotype 2 related to (A) and (B), n = 41 Mtb-LC3 positive compartments. This analysis includes all observed instances of Mtb-triggered LC3-TVS formation captured over 48 hours of live-cell imaging. (F) CLEM analysis shows a nascent Mtb-LC3-TVS interacting (arrowhead) with small vesicles (indicated by *) in THP-1 macrophages stably expressing RFP-GFP-LC3B during Mtb WT infection (2.5 hpi, MOI: 2). Scale bars, in (A) and (B): 1 μm; in (F): 1 μm (main images) and 200 nm (zoomed-in area).
Fig. 4.
Fig. 4.. Ca2+ leakage–dependent ATG8/LC3 lipidation requires the ATG16L1-LC3 lipidation system but not the FIP200-ATG13 complex.
(A) Mtb WT infection (MOI: 2) in ATG7 KO, ATG16L1 KO, ATG13 KO, and FIP200 KO THP-1 macrophages stably expressing RFP-GFP-LC3B at 2.5 hpi. (B) Quantification shows the percentage of infected cells showing Mtb-LC3-TVS in WT and ATG7 KO, ATG16L1 KO, ATG13 KO, and FIP200 KO cells related to (A). The dataset for WT condition matches data in Fig. 2F. n (number of infected cells) = 80 to 195; data points correspond to individual technical replicates from three independent experiments. (C) p62 and LC3 staining in ATG7 KO, ATG16L1 KO, ATG13 KO, and FIP200 KO THP-1 macrophages infected with Mtb WT at 2.5 hpi. (D) Percentage of infected cells showing Mtb-p62–positive structures in WT and ATG7 KO, ATG16L1 KO, ATG13 KO, and FIP200 KO cells related to (C) and fig. S2L. n (number of infected cells) = 80 to 185; data points correspond to individual technical replicates from three independent experiments. (E) CLEM shows the Mtb-LC3-TVS in FIP200 KO THP-1 macrophages and LC3-negative membrane surrounding Mtb in ATG7 and ATG16L1 KO THP-1 macrophages during Mtb WT infection (2.5 hpi, MOI: 2). Scale bars, in (A) and (C): 10 μm (main images) and 1 μm (inserted area); in (E): 1 μm (main images) and 200 nm (enlarged area).
Fig. 5.
Fig. 5.. GAL8 is recruited to the Mtb-LC3-TVS during early and late damage.
(A) GAL8 staining in THP-1 macrophages stably expressing GFP-LC3B after Mtb WT infection (2.5 hpi, MOI: 2) under treatment with BAPTA-AM and EGTA-AM. (B) GAL8 and GAL3 staining in THP-1 macrophages after Mtb WT and Mtb ΔRD1 infection (2.5 hpi, MOI: 2) under indicated treatments. (C) Percentage of Mtb-LC3-TVS positive for GAL8 related to (A) and fig. S3D. n (number of infected cells) = 51 to 72; data points correspond to individual technical replicates from three independent experiments. (D) Percentage of infected cells with Mtb-GAL3 positive, Mtb-GAL8 positive, and Mtb-GAL3/GAL8 double positive compartments. n (number of infected cells) = 96 to 151; data points correspond to individual technical replicates from three independent experiments. (E) Percentage of infected cells showing the Mtb-GAL3 positive, Mtb-GAL8 positive, and Mtb-GAL3/GAL8 double positive structures at 2.5, 8, and 24 hpi. n (number of infected cells) = 101 to 151; data points correspond to individual technical replicates from three independent experiments. The datasets for 2.5 hpi matches data from (D). Scale bars, in (A) and (B): 10 μm (main images) and 1 μm (inserted area).
Fig. 6.
Fig. 6.. Ca2+ leakage triggers the recruitment of V-ATPase–ATG16L1 to Mtb-LC3-TVS.
(A) Mtb infection (MOI: 2) in THP-1 macrophages stably expressing RFP-GFP-LC3B at 2.5 hpi under BafA1 and CQ treatment. (B) Percentage of infected cells showing Mtb-LC3-TVS under BafA1 and CQ treatment, related to (A). The dataset for control cells matches data from Fig. 2F. Diagram shows endolysosome pH after BafA1and CQ treatment. n (number of infected cells) = 122 to 195; data points correspond to individual technical replicates from three independent experiments. (C) GAL8 staining in THP-1 macrophages stably expressing GFP-ATG16L1 at 2.5 hpi during Mtb infection (MOI: 2) under BafA1 treatment. (D) Quantification shows the percentage of Mtb-GAL8 positive structures positive for ATG16L1 under BafA1 treatment, related to (C). Diagram shows the function of BafA1 in blocking VATPase-ATG16L1 complex assembly. n (number of infected cells) = 178 and 202; data points correspond to individual technical replicates from 3 independent experiments. (E) ATP6V1D staining in THP-1 macrophages stably expressing GFP-ATG16L1 at 2.5 hpi during Mtb WT and Mtb ΔRD1 infection (MOI: 2) under indicated treatments. (F and G) Percentage of infected cells showing Mtb-ATP6V1D positive (F) and Mtb-ATG16L1 positive (G) structures under the indicated treatments, related to (E). n (number of infected cells) = 93 to 130; data points correspond to individual technical replicates from three independent experiments. (H) GAL8 and ATP6V1D staining in THP-1 macrophages infected with Mtb WT and Mtb ΔRD1 at 2.5 hpi. (I) Percentage of Mtb WT– and Mtb ΔRD1–infected cells showing the GAL8– and ATP6V1D–double positive structures, related to (H). n (number of infected cells) = 215 and 175; data points correspond to individual technical replicates from three independent experiments. Scale bars, 10 μm (main images) and 1 μm (inserted area).
Fig. 7.
Fig. 7.. ATG8/LC3 lipidation restricts phagosome damage and Mtb infection.
(A) GAL8 and GAL3 staining in WT and ATG16L1 KO and FIP200 KO THP-1 macrophages after Mtb WT and Mtb ΔRD1 infection (2.5 hpi, MOI: 2). (B and C) Percentage of infected cells showing the Mtb-GAL8 positive and Mtb-GAL3 positive structures in WT and ATG7 KO, ATG16L1 KO, ATG13 KO, and FIP200 KO THP-1 macrophages related to (A) and fig. S5A. The datasets for WT cells are same as Fig. 5D. n (number of infected cells) = 96 and 174; data points correspond to individual technical replicates from three independent experiments. (D) Representative micrographs at indicated time points of ATG16L1 KO and FIP200 KO THP-1 macrophages infected with Mtb WT (red) in the presence of PI+ necrotic cells (yellow). Bright-field images show the localization of macrophages. Data are representative from one of three independent experiments. (E) Quantification shows the fold change of Mtb area at 70 hpi with WT Mtb in WT, ATG7 KO, ATG16L1 KO, and FIP200 KO THP-1 macrophages. Data are from three independent biological replicates, each of which represents the mean of three technical replicates. (F) Quantification shows the fold change in the number of PI-positive cells 70 hpi with WT Mtb, compared to noninfected cells, in WT, ATG7 KO, ATG16L1 KO, and FIP200 KO THP-1 macrophages. Data are from three independent biological replicates, each of which represents the mean of three technical replicates. Scale bars, in (A): 10 μm; in (D): 50 μm.

References

    1. Kabeya Y., Mizushima N., Ueno T., Yamamoto A., Kirisako T., Noda T., Kominami E., Ohsumi Y., Yoshimori T., LC3, a mammalian homologue of yeast Apg8p, is localized in autophagosome membranes after processing. EMBO J. 19, 5720–5728 (2000). - PMC - PubMed
    1. Deretic V., Duque T., Trosdal E., Paddar M., Javed R., Akepati P., Membrane atg8ylation in canonical and noncanonical autophagy. J. Mol. Biol. 436, 168532 (2024). - PMC - PubMed
    1. Sanjuan M. A., Dillon C. P., Tait S. W., Moshiach S., Dorsey F., Connell S., Komatsu M., Tanaka K., Cleveland J. L., Withoff S., Green D. R., Toll-like receptor signalling in macrophages links the autophagy pathway to phagocytosis. Nature 450, 1253–1257 (2007). - PubMed
    1. Durgan J., Lystad A. H., Sloan K., Carlsson S. R., Wilson M. I., Marcassa E., Ulferts R., Webster J., Lopez-Clavijo A. F., Wakelam M. J., Beale R., Simonsen A., Oxley D., Florey O., Non-canonical autophagy drives alternative ATG8 conjugation to phosphatidylserine. Mol. Cell 81, 2031–2040.e8 (2021). - PMC - PubMed
    1. Heckmann B. L., Teubner B. J., Tummers B., Boada-Romero E., Harris L., Yang M., Guy C. S., Zakharenko S. S., Green D. R., LC3-associated endocytosis facilitates β-amyloid clearance and mitigates neurodegeneration in murine Alzheimer’s disease. Cell 178, 536–551.e514 (2019). - PMC - PubMed

MeSH terms