. 2025 Mar 28;11(13):eadp5782.
doi: 10.1126/sciadv.adp5782. Epub 2025 Mar 26.

Activity-dependent regulation of Cdc42 by Ephexin5 drives synapse growth and stabilization

Affiliations

Activity-dependent regulation of Cdc42 by Ephexin5 drives synapse growth and stabilization

Samuel Petshow et al. Sci Adv. .

Abstract

Synaptic Rho guanosine triphosphatase (GTPase) guanine nucleotide exchange factors (RhoGEFs) play vital roles in regulating the activity-dependent neuronal plasticity that is critical for learning. Ephexin5, a RhoGEF implicated in the etiology of Alzheimer's disease and Angelman syndrome, was originally reported in neurons as a RhoA-specific GEF that negatively regulates spine synapse density. Here, we show that Ephexin5 activates both RhoA and Cdc42 in the brain. Furthermore, using live imaging of GTPase biosensors, we demonstrate that Ephexin5 regulates activity-dependent Cdc42, but not RhoA, signaling at single synapses. The selectivity of Ephexin5 for Cdc42 activation is regulated by tyrosine phosphorylation, which is regulated by neuronal activity. Last, in contrast to Ephexin5's role in negatively regulating synapse density, we show that, downstream of neuronal activity, Ephexin5 positively regulates synaptic growth and stabilization. Our results support a model in which plasticity-inducing neuronal activity regulates Ephexin5 tyrosine phosphorylation, driving Ephexin5-mediated activation of Cdc42 and the spine structural growth and stabilization vital for learning.


Figures

Fig. 1.
Fig. 1.. Activity-dependent Cdc42, but not RhoA, signaling is regulated by E5.
(A) Immunoblot showing active RhoA (Rhotekin pull-down), isolated from whole brain lysates (input) of P18 to P21 E5KO or WT littermate mice. (B) Active RhoA signal/total RhoA signal normalized to WT is reduced in E5KO brains (red; 5 brains) relative to WT littermates (black; 5 brains). (C) Immunoblot showing active Cdc42 (PAK pull-down), isolated from whole brain lysates (input) of P18 to P21 E5KO or WT littermates. (D) Active Cdc42 signal/total Cdc42 signal and normalized to WT is reduced in E5KO brains (red; 5 brains) relative to WT littermates (black; 5 brains). (E) Fluorescence lifetime images of dendrites of WT and E5KO CA1 pyramidal neurons expressing Cdc42 FRET sensor before (0 min) and after (1 min) glutamate uncaging (HFU, yellow cross) on individual dendritic spines (yellow arrowheads). Warmer colors indicate sensor activation. (F) Target spines of E5KO (red) neurons show reduced HFU-induced Cdc42 activity relative to WT (black). (G) Peak Cdc42 activation (0 to 2 min post-HFU) is reduced in target spines of E5KO (red; 8 spines/8 cells) compared to WT (black; 9 spines/9 cells). (H) Fluorescence lifetime images of dendrites of WT and E5KO CA1 pyramidal neurons expressing RhoA FRET sensor before (0 min) and after (1 min) glutamate uncaging (HFU, yellow cross) on individual dendritic spines. (I) HFU-induced RhoA activity is robustly elevated in target spines of both WT (black) and E5KO (red) neurons. (J) Peak RhoA activation (0 to 2 min post-HFU) in target spines of E5KO (red; 8 spines/8 cells) is not different from those of WT (black; 9 spines/9 cells). Scale bars, 1 μm. Student’s t test in (B), (D), (G) and (J). Data are presented as means ± SEM. *P < 0.05 and **P < 0.01. n.s., not significant.
Fig. 2.
Fig. 2.. E5 tyrosine phosphorylation is developmentally regulated and activity dependent.
(A) Immunoblots of lysates from whole brains of P7 or P19 WT and E5KO mice subjected to IP by E5 antibody. (B) Pan-phosphotyrosine signal (pTyr)/E5 signal from IPed E5 (pTyr/E5) is lower in P19 (gray; 4 mice) compared to P7 (white; 4 mice) brains. (C) Input E5/total protein was not different between P7 (white; 4 mice) and P19 (gray; 4 mice). (D) Immunoblots of lysates from acute hippocampal slices treated with cLTP or vehicle for 5 or 20 min and subjected to IP by E5 antibody. (E) pTyr/E5 is reduced in cLTP (gray; 4 biological replicates) compared to vehicle (white; 4 biological replicates). (F) Input E5/total protein is unchanged in cLTP (gray; 4 replicates) compared to vehicle (white; 4 replicates). (G) Immunoblots of lysates from acute brain slices treated with cLTP, cLTP + MG132, or vehicle for 20 min and subjected to IP by E5 antibody. (H) pTyr/E5 is reduced in cLTP and cLTP + MG132 (gray; 4 biological replicates) compared to vehicle (white; 4 biological replicates). (I) Input E5/total protein is unchanged in cLTP and MG132 (gray; 4 biological replicates) compared to vehicle (white; 4 biological replicates). (J) Immunoblots from (A), highlighting the overlap of pTyr (red) and upper E5 (green) bands. (K) Proportion E5 in the upper band decreases from P7 to P19. (L) Immunoblots from (G), highlighting the overlap of pTyr (red) and E5 (green) bands. (M) Proportion of E5 in the upper band is unchanged following cLTP and cLTP + MG132. Two-way analysis of variance (ANOVA) with Bonferroni’s correction for multiple comparisons in (E), (F), (H), (I), and (M) and Student’s t test in (B), (C), and (K). Data are presented as means ± SEM. *P < 0.05 and **P < 0.01.
Fig. 3.
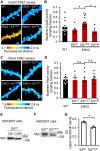
Fig. 3.. Blocking phosphorylation of E5 at Y361 elevates Cdc42 activation.
(A) Fluorescence lifetime images of dendrites of WT and E5KO CA1 pyramidal neurons expressing Cdc42 FRET biosensor and either E5WT, E5LQR, or E5Y361F. Warmer colors indicate sensor activation. (B) Dendritic Cdc42 activation is elevated in E5KO neurons expressing E5Y361F (15 cells) compared to E5KO neurons expressing E5WT (8 cells) or E5LQR (6 cells). (C) Fluorescence lifetime images of dendrites of WT and E5KO CA1 pyramidal neurons expressing RhoA FRET biosensor and either E5WT, E5LQR, or E5Y361F. (D) Dendritic RhoA activation is unchanged in E5KO neurons expressing E5Y361F (9 cells) compared to E5KO neurons expressing E5WT (7 cells) or E5LQR (8 cells). n.s., not significant. (E) Immunoblot of lysates from HEK293T cells expressing Myc-tagged E5WT treated with CIAP or vehicle control for 20 min. (F) Immunoblot of lysates from HEK293T cells expressing Myc-tagged E5WT or E5Y361F. (G) Proportion of E5 in the upper band is lower for E5Y361F than for E5WT. Scale bars, 1 μm. Two-way ANOVA with Bonferroni’s correction for multiple comparisons in (B) and (D) and Student’s t test in (G). Data are presented as means ± SEM. *P < 0.05.
Fig. 4.
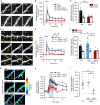
Fig. 4.. E5 GEF activity is required for activity-dependent long-term spine growth and Cdc42 activation.
(A) Images of dendrites from eGFP-expressing CA1 neurons in slice cultures from WT and E5KO animals before (0 min) and after (2 and 30 min) target spine (yellow arrowheads) stimulation with HFU (yellow cross). (B and C) Target spines from E5KO neurons (red; 8 spines/8 cells) did not show the HFU-induced long-term growth observed in spines from WT littermates (black; 6 spines/6 cells). Unstimulated (unstim.) spines (open circles) showed no changes. (D) Images of dendrites from WT CA1 neurons expressing eGFP (WT) or E5KO CA1 neurons coexpressing eGFP and E5WT or E5LQR before (0 min) and after (2 and 30 min) target spine (yellow arrowheads) stimulation with HFU (yellow cross). (E and F) Target spines from E5KO neurons expressing E5LQR (red; 7 spines/7 cells) did not show the HFU-induced long-term growth observed in E5KO neurons expressing E5WT (blue; 7 spines/7 cells) or WT control littermates (black; 7 spines/7 cells). Unstimulated spines (open circles) showed no changes. (G) Fluorescence lifetime images of dendrites from WT and E5KO neurons expressing Cdc42 FRET sensor and either E5WT or E5LQR before (0 min) and after (1 min) target spine (yellow arrowheads) stimulation with HFU (yellow cross). Warmer colors indicate sensor activation. (H) HFU-induced Cdc42 activation in target spines from WT neurons (black) or E5KO neurons expressing E5WT (blue) or E5LQR (red). (I) Peak Cdc42 activation (0 to 2 min post-HFU) is reduced in E5KO neurons expressing E5LQR (red; 8 spines/8 cells) compared to E5WT (blue; 7 spines/7 cells) and WT neurons (black; 12 spines/12 cells). Scale bars, 1 μm. Two-way ANOVA with Bonferroni’s correction for multiple comparisons in (C) and (F) and Student’s t test in (I). Data are presented as means ± SEM. *P < 0.05, **P < 0.01, and ***P < 0.001.
Fig. 5.
Fig. 5.. E5 Y361F mutant rescues activity-dependent spine growth and Cdc42 activation in E5KO neurons.
(A) Images of dendrites from E5KO CA1 neurons coexpressing eGFP and E5WT or E5Y361F before (0 min) and after (2 and 30 min) targetspine (yellow arrowheads) stimulation with HFU (yellow cross). (B and C) Target spines from E5KO neurons expressing E5Y361F (green; 9 spines/9 cells) showed a nonsignificant trend toward increased HFU-induced long-term growth as compared to E5WT (blue; 9 spines/9 cells). Unstimulated spines (open circles) showed no changes. (D) Fluorescence lifetime images of dendrites of E5KO neurons expressing Cdc42 FRET sensor and either E5WT or E5Y361F before (0 min) and after (1 min) target spine (yellow arrowheads) stimulation with HFU (yellow cross). Warmer colors indicate sensor activation. (E) HFU-induced Cdc42 activation in target spines from E5KO neurons expressing E5WT (blue) or E5Y361F (green). (F) E5KO neurons expressing E5Y361F (green; 9 spines/9 cells) showed a trend toward decreased peak Cdc42 activation (0 to 2 min post-HFU) compared to E5WT (blue; 10 spines/10 cells). (G and H) Baseline sensor activation, expressed as an unnormalized binding fraction, was markedly elevated in E5Y361F (green)–expressing cells compared to E5WT (blue)–expressing cells. Scale bars, 1 μm. Student’s t test in (C), (F) and (H). Data are presented as means ± SEM. ***P < 0.001.

References

    1. Hayashi-Takagi A., Yagishita S., Nakamura M., Shirai F., Wu Y., Loshbaugh A. L., Kuhlman B., Hahn K. M., Kasai H., Labelling and optical erasure of synaptic memory traces in the motor cortex. Nature 525, 333–338 (2015). - PMC - PubMed
    1. Holtmaat A., Wilbrecht L., Knott G. W., Welker E., Svoboda K., Experience-dependent and cell-type-specific spine growth in the neocortex. Nature 441, 979–983 (2006). - PubMed
    1. Kasai H., Ziv N. E., Okazaki H., Yagishita S., Toyoizumi T., Spine dynamics in the brain, mental disorders and artificial neural networks. Nat. Rev. Neurosci. 22, 407–422 (2021). - PubMed
    1. Matsuzaki M., Honkura N., Ellis-Davies G. C. R., Kasai H., Structural basis of long-term potentiation in single dendritic spines. Nature 429, 761–766 (2004). - PMC - PubMed
    1. Bosch M., Castro J., Saneyoshi T., Matsuno H., Sur M., Hayashi Y., Structural and molecular remodeling of dendritic spine substructures during long-term potentiation. Neuron 82, 444–459 (2014). - PMC - PubMed

Substances