. 2025 Mar 28;11(13):eadt3142.
doi: 10.1126/sciadv.adt3142. Epub 2025 Mar 26.

The clinical antiprotozoal drug halofuginone promotes weight loss by elevating GDF15 and FGF21

Affiliations

The clinical antiprotozoal drug halofuginone promotes weight loss by elevating GDF15 and FGF21

Suowen Xu et al. Sci Adv. .

Abstract

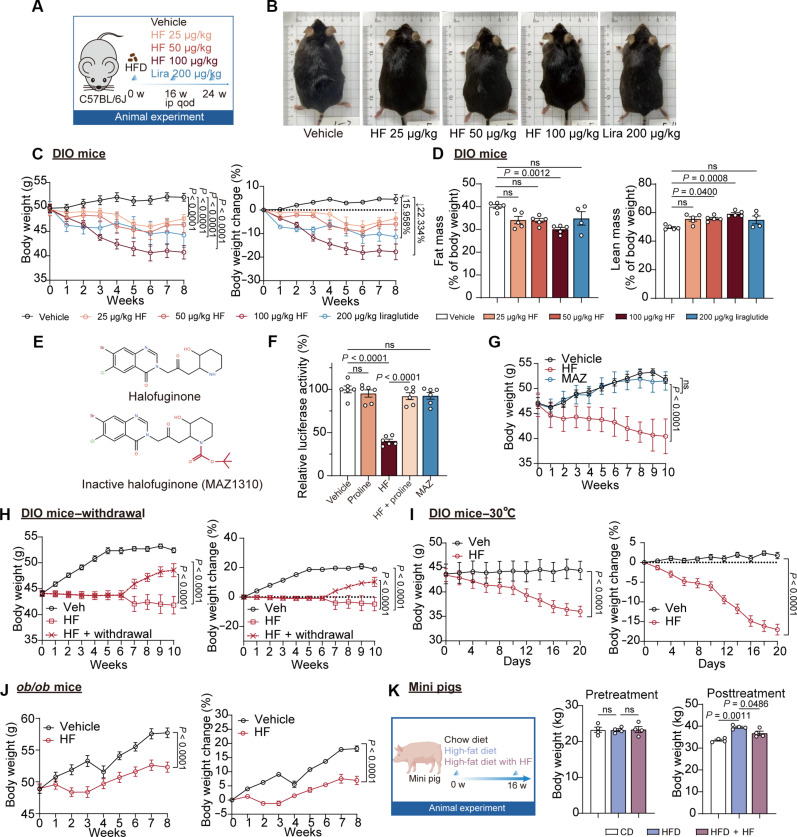
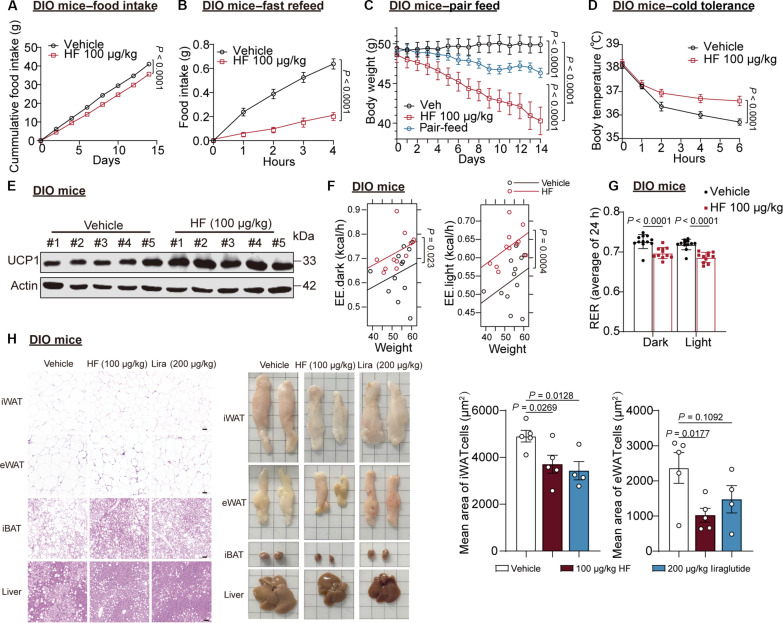
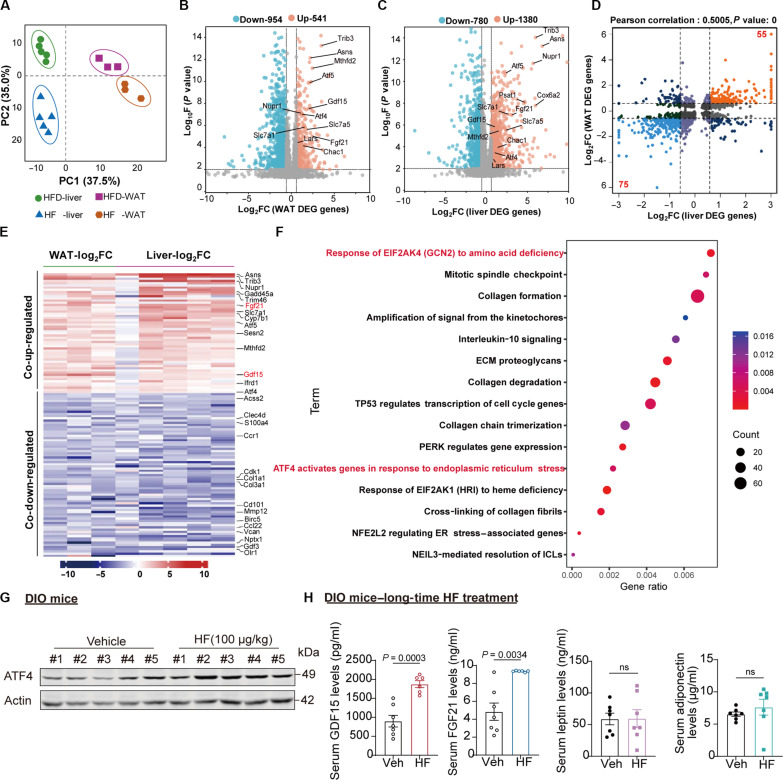
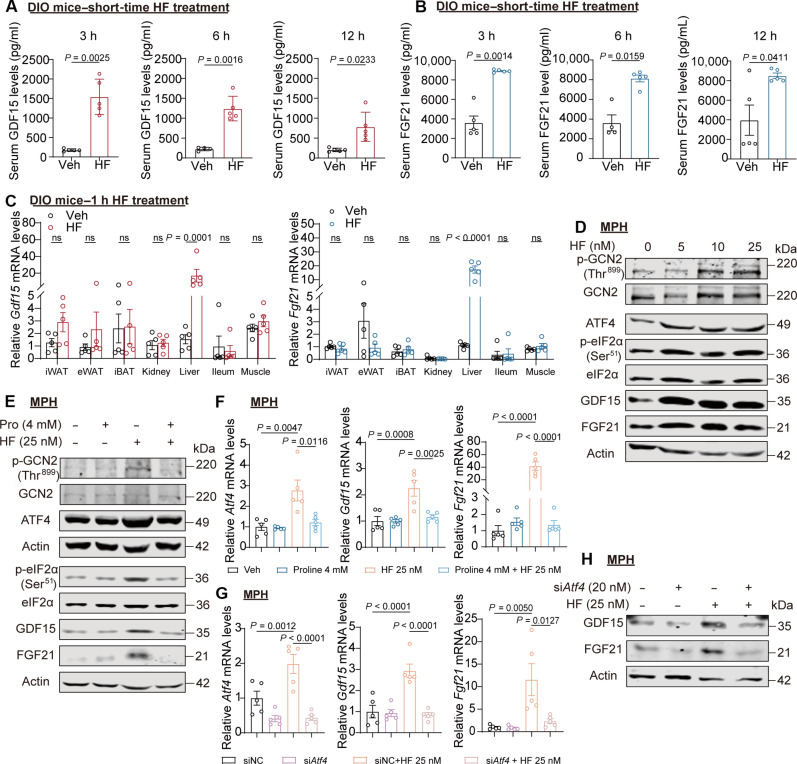
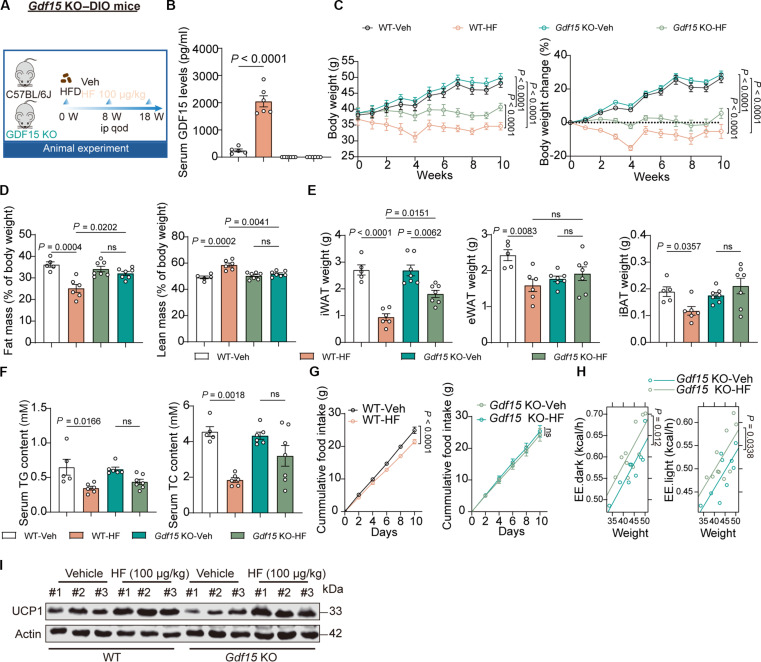
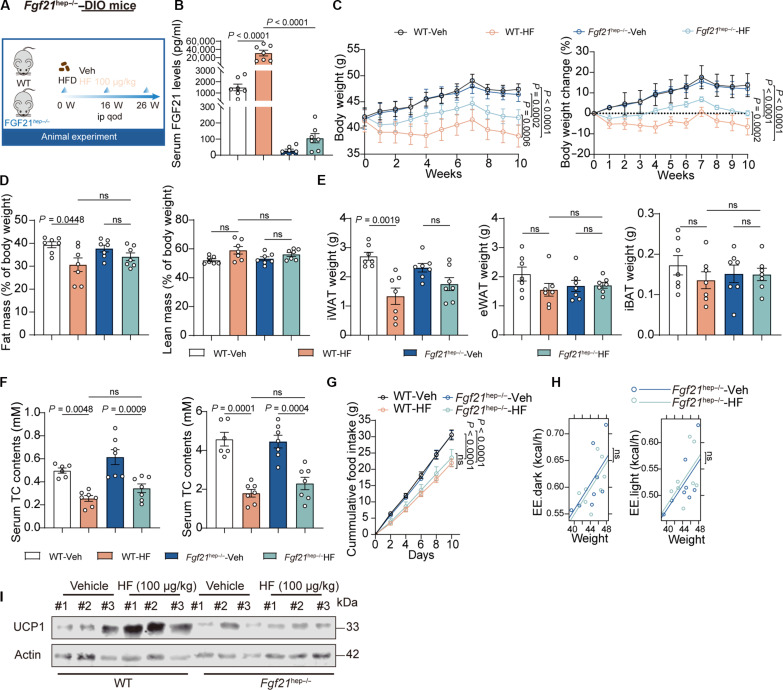
Obesity is a debilitating global pandemic with a huge cost on health care due to it being a major underlying risk factor for several diseases. Therefore, there is an unmet medical need for pharmacological interventions to curb obesity. Here, we report that halofuginone, a Food and Drug Administration-approved anti-scleroderma and antiprotozoal drug, is a promising anti-obesity agent in preclinical mouse and pig models. Halofuginone suppressed food intake, increased energy expenditure, and resulted in weight loss in diet-induced obese mice while also alleviating insulin resistance and hepatic steatosis. Using molecular and pharmacological tools with transcriptomics, we identified that halofuginone increases fibroblast growth factor 21 (FGF21) and growth differentiation factor 15 (GDF15) levels via activating integrated stress response. Using Gdf15 and Fgf21 knockout mice, we show that both hormones are necessary to elicit anti-obesity changes. Together, our study reports the beneficial metabolic effects of halofuginone and underscores its utility in treating obesity and its associated metabolic complications, which merits clinical assessment.


Figures

Fig. 1.
Fig. 1.. HF promotes weight loss in obese animal models.
(A to D) Male C57BL/6J mice were fed an HFD for 16 weeks (w) and then randomly assigned to five groups: (i) vehicle group; (ii) 25 μg/kg, (iii) 50 μg/kg, and (iv) 100 μg/kg HF treatment group; and (v) 200 μg/kg liraglutide treatment group. The mice were treated with intraperitoneal (ip) injections of vehicle or indicated drugs every 2 days. (A) Schematic diagram of study design. (B) Representative gross images of mice. (C) Body weight and % body weight change (vehicle or HF group, n = 5; liraglutide group, n = 4). (D) Fat mass and lean mass (% of body weight) by nuclear magnetic resonance scans (vehicle or HF group, n = 5; liraglutide group, n = 4). ns, not significant. (E) Chemical structure of HF and MAZ1310 (EPRS1 inactive compound). (F) Luciferase mRNA was incubated with rabbit reticulocyte lysate (RRL), and the translation process was measured using a luminescence assay (HF, 200 nM; proline, 8 mM; MAZ1310, 200 nM). (G) Body weight of DIO mice during vehicle, HF treatment (100 μg/kg), or MAZ treatment (100 μg/kg) (vehicle or MAZ group, n = 5; HF group, n = 4). (H) Body weight and % body weight change of DIO mice during vehicle, HF treatment or HF withdrawal treatment (n = 10). (I) Body weight and % body weight change of DIO mice in a TN environment (30°C) during 20 days of HF treatment (100 μg/kg, n = 8). (J) Body weight and % body weight change of ob/ob mice during vehicle or HF treatment (vehicle group, n = 7; HF group, n = 8, 100 μg/kg). (K) Body weight of obese minipigs before HF treatment and after 16-week HF treatment (n = 4). Data in (D) were analyzed by one-way analysis of variance (ANOVA) followed by Bonferroni’s multiple comparisons test. Data in (C), (F) to (H), and (K) were determined through two-way ANOVA followed by Bonferroni’s multiple comparisons test. Data in (I) and (J) were determined through two-way ANOVA.
Fig. 2.
Fig. 2.. HF suppresses food intake and increases energy expenditure.
(A) Cumulative food intake of DIO mice (single cage) treated with vehicle or HF (100 μg/kg) (n = 8). (B) Food intake after fast-refeed DIO mice treated with vehicle or HF (100 μg/kg) (n = 8). (C) Changes in body weight during pair-feeding (n = 8). (D) Cold tolerance of DIO mice treated with vehicle or HF (100 μg/kg) (n = 5 to 6). (E) UCP1 protein abundance in iBAT of vehicle- or HF (100 μg/kg)–treated DIO mice (n = 5). (F) Energy expenditure (EE) in DIO mice treated with vehicle or HF (100 μg/kg) (vehicle group, n = 12; HF group, n = 11). (G) Average 24 hours (h) RER in DIO mice treated with vehicle or HF (100 μg/kg) (vehicle group, n = 12; HF group, n = 11). (H) Representative images of hematoxylin and eosin staining of adipose tissues and liver, and the quantification of adipocyte size of eWAT and iWAT (vehicle or HF group, n = 5; liraglutide group, n = 4). Scale bar, 50 μm. Data are presented as means ± SEM. Data in (A), (B), and (D) were determined through two-way ANOVA. Data in (C) were determined through two-way ANOVA by Bonferroni’s multiple comparisons test. Data in (F) were determined through ANCOVA using body mass as a covariate. Bar graphs in (G) analyzed by two-way ANOVA followed by Bonferroni’s multiple comparisons test. Data in (H) analyzed by one-way ANOVA followed by Fisher’s least significant difference test.
Fig. 3.
Fig. 3.. HF induces the up-regulation of GDF15 and FGF21.
(A) Principal components analysis from RNA-seq of vehicle- or HF (100 μg/kg)–treated mouse liver and WAT tissues (WAT, n = 3; liver, n = 5). (B) Volcano plot of significantly down-regulated (blue) and up-regulated (red) genes in WAT from mice as described in (A) (|Log2FC| > 1.5, P value <0.01). (C) Volcano plot of significantly down-regulated (blue) and up-regulated (red) genes in liver from mice as described in (A) (|Log2FC| > 1.5, P value<0.01). (D) The nine-quadrant plot shows the correlation between differentially expressed proteins in the WAT and liver groups. (E) Heatmap analysis of differentially expressed genes in livers and WAT from vehicle- and HF-treated mice. (F) Reactome enrichment pathway analysis implicates GCN2/ATF4-associated cellular responses to stress pathway in HF-treated group. Significantly overrepresented pathways (FDR < 0.05) were grouped and depicted. The size of the circles corresponds to the number of genes in each module. (G) Levels of ATF4 protein in liver tissues of DIO mice injected with vehicle or HF (100 μg/kg), n = 5. (H) Serum GDF15 (vehicle group, n = 7; HF group, n = 6), FGF21 (vehicle group, n = 7; HF group, n = 6), leptin (n = 7), and adiponectin (n = 7) protein levels of DIO mice injected with HF (100 μg/kg) for 8 week. Data are means ± SEM. P values for the data of GDF15 and leptin were calculated by two-sided unpaired t tests. P values for the data of FGF21 and adiponectin were calculated by two-sided unpaired t tests with Welch’s correction.
Fig. 4.
Fig. 4.. HF elevates GDF15 and FGF21 expression via the ISR signaling pathway.
(A) Serum GDF15 protein levels of DIO mice injected with HF (100 μg/kg) at indicated time [n = 5, except for the vehicle group at 6 hours (n = 4)]. (B) Serum FGF21 protein levels of DIO mice injected with HF (100 μg/kg) at indicated time [n = 5, except for the vehicle group at 6 hours (n = 4)]. (C) Levels of Gdf15 and Fgf21 mRNAs in indicated organs of DIO mice injected with vehicle or HF (100 μg/kg) at 1 hour (n = 5). (D and E) Protein levels (p-GCN2, GCN2, ATF4, p-eIF2α, eIF2α, GDF15, and FGF21) in mouse primary hepatocytes (MPH). (F) Levels of Atf4, Gdf15, and Fgf21 mRNAs in MPH treated with HF (25 nM) in the presence or absence of proline (4 mM) for 24 hours (n = 5). (G) Levels of Atf4, Gdf15, and Fgf21 mRNAs in control siRNA (siNC) or Atf4 siRNA (siAtf4)–treated MPH exposed to HF (25 nM) (n = 5). (H) Protein levels (GDF15, and FGF21) in MPH. Data are presented as means ± SEM. Data in (A), 3 and 12 hours in (B) were calculated using two-sided unpaired t tests with Welch’s correction. Data in 6 hours in (B) were analyzed by nonparametric tests. Bar graphs in (C) analyzed by two-way ANOVA followed by Bonferroni’s multiple comparisons test. Data in (F) and (G) analyzed by two-way ANOVA followed by Tukey’s multiple comparisons test.
Fig. 5.
Fig. 5.. GDF15 mediates weight-loss effect of HF by inhibiting food intake.
(A to F) Eight-week-old male WT and Gdf15 KO mice were fed with HFD for 8 weeks. WT and Gdf15 KO mice were then randomly assigned to vehicle or HF (100 μg/kg) group and injected every 2 days for 8 weeks. (B) Serum GDF15 levels. (C) Body weight and % body weight change (WT-Veh, n = 5; WT-HF, n = 6; Gdf15 KO-Veh, n = 7; Gdf15 KO-HF, n = 7). (D) Fat mass and lean mass (% body weight). (E) Weights of adipose tissues. (F) Serum TC and TG levels (WT-Veh, n = 5; WT-HF, n = 6; Gdf15 KO-Veh, n = 6; Gdf15 KO-HF, n = 7). (G) Cumulative food intake of single cage WT or Gdf15 KO mice treated with vehicle or HF (100 μg/kg) (n = 4). (H) EE in Gdf15 KO mice treated with vehicle or HF (100 μg/kg) (vehicle group, n = 9; HF group, n = 10). (I) UCP1 protein abundance in iBAT of HF (100 μg/kg)–treated WT and Gdf15 KO mice (n = 3). Data are presented as means ± SEM. Data in (B) to (F) were determined through two-way ANOVA followed by Bonferroni’s multiple comparisons test. Data in (G) were determined through two-way ANOVA. Data in (H) were determined through ANCOVA using body mass as a covariate.
Fig. 6.
Fig. 6.. FGF21 mediates weight-loss effect of HF by increasing energy expenditure.
(A to F) Eight-week-old male Fgf21flox/flox mice (WT) and Fgf21hep−/− mice were fed with HFD for 16 weeks and then randomly divided into vehicle or HF (100 μg/kg) group and injected every 2 days for 10 weeks. (B) Serum FGF21 levels (n = 7). (C) Body weight and % body weight change (n = 7). (D) Fat mass and lean mass (% body weight) (n = 7). (E) Weights of adipose tissues (n = 7). (F) Serum TC and TG levels (Veh, n = 6; other group, n = 7). (G) Cumulative food intake of single cage WT or Fgf21hep−/− mice treated with vehicle or HF (100 μg/kg) (n = 4). (H) EE in Fgf21hep−/− mice treated with vehicle or HF (100 μg/kg) (vehicle group, n = 8; HF group, n = 8). (I) UCP1 protein abundance in BAT of HF (100 μg/kg)–treated WT and Fgf21hep−/− mice (n = 3). Data are presented as mean ± SEM. Data in (B) to (G) were determined through two-way ANOVA by Bonferroni’s multiple comparisons test. Data in (H) were determined through ANCOVA using body mass as a covariate.

Similar articles

Cited by

References

    1. Hepler C., Weidemann B. J., Waldeck N. J., Marcheva B., Cedernaes J., Thorne A. K., Kobayashi Y., Nozawa R., Newman M. V., Gao P., Shao M., Ramsey K. M., Gupta R. K., Bass J., Time-restricted feeding mitigates obesity through adipocyte thermogenesis. Science 378, 276–284 (2022). - PMC - PubMed
    1. Sakers A., De Siqueira M. K., Seale P., Villanueva C. J., Adipose-tissue plasticity in health and disease. Cell 185, 419–446 (2022). - PMC - PubMed
    1. Calle E. E., Rodriguez C., Walker-Thurmond K., Thun M. J., Overweight, obesity, and mortality from cancer in a prospectively studied cohort of U.S. adults. N. Engl. J. Med. 348, 1625–1638 (2003). - PubMed
    1. Afshin A., Forouzanfar M. H., Reitsma M. B., Sur P., Estep K., Lee A., Marczak L., Mokdad A. H., Moradi-Lakeh M., Naghavi M., Salama J. S., Vos T., Abate K. H., Abbafati C., Ahmed M. B., Al-Aly Z., Alkerwi A. A., Al-Raddadi R., Amare A. T., Amberbir A., Amegah A. K., Amini E., Amrock S. M., Anjana R. M., Ärnlöv J., Asayesh H., Banerjee A., Barac A., Baye E., Bennett D. A., Beyene A. S., Biadgilign S., Biryukov S., Bjertness E., Boneya D. J., Campos-Nonato I., Carrero J. J., Cecilio P., Cercy K., Ciobanu L. G., Cornaby L., Damtew S. A., Dandona L., Dandona R., Dharmaratne S. D., Duncan B. B., Eshrati B., Esteghamati A., Feigin V. L., Fernandes J. C., Fürst T., Gebrehiwot T. T., Gold A., Gona P. N., Goto A., Habtewold T. D., Hadush K. T., Hafezi-Nejad N., Hay S. I., Horino M., Islami F., Kamal R., Kasaeian A., Katikireddi S. V., Kengne A. P., Kesavachandran C. N., Khader Y. S., Khang Y.-H., Khubchandani J., Kim D., Kim Y. J., Kinfu Y., Kosen S., Ku T., Defo B. K., Kumar G. A., Larson H. J., Leinsalu M., Liang X., Lim S. S., Liu P., Lopez A. D., Lozano R., Majeed A., Malekzadeh R., Malta D. C., Mazidi M., McAlinden C., McGarvey S. T., Mengistu D. T., Mensah G. A., Mensink G. B. M., Mezgebe H. B., Mirrakhimov E. M., Mueller U. O., Noubiap J. J., Obermeyer C. M., Ogbo F. A., Owolabi M. O., Patton G. C., Pourmalek F., Qorbani M., Rafay A., Rai R. K., Ranabhat C. L., Reinig N., Safiri S., Salomon J. A., Sanabria J. R., Santos I. S., Sartorius B., Sawhney M., Schmidhuber J., Schutte A. E., Schmidt M. I., Sepanlou S. G., Shamsizadeh M., Sheikhbahaei S., Shin M.-J., Shiri R., Shiue I., Roba H. S., Silva D. A. S., Silverberg J. I., Singh J. A., Stranges S., Swaminathan S., Tabarés-Seisdedos R., Tadese F., Tedla B. A., Tegegne B. S., Terkawi A. S., Thakur J. S., Tonelli M., Topor-Madry R., Tyrovolas S., Ukwaja K. N., Uthman O. A., Vaezghasemi M., Vasankari T., Vlassov V. V., Vollset S. E., Weiderpass E., Werdecker A., Wesana J., Westerman R., Yano Y., Yonemoto N., Yonga G., Zaidi Z., Zenebe Z. M., Zipkin B., Murray C. J. L., Health effects of overweight and obesity in 195 countries over 25 years. N. Engl. J. Med. 377, 13–27 (2017). - PMC - PubMed
    1. Blüher M., Obesity: Global epidemiology and pathogenesis. Nat. Rev. Endocrinol. 15, 288–298 (2019). - PubMed

MeSH terms