. 2025 Jun 16;85(12):2199-2217.
doi: 10.1158/0008-5472.CAN-24-3173.

Cancer-Associated Fibroblasts Foster a High-Lactate Microenvironment to Drive Perineural Invasion in Pancreatic Cancer

Affiliations

Cancer-Associated Fibroblasts Foster a High-Lactate Microenvironment to Drive Perineural Invasion in Pancreatic Cancer

Tingting Li et al. Cancer Res. .

Abstract

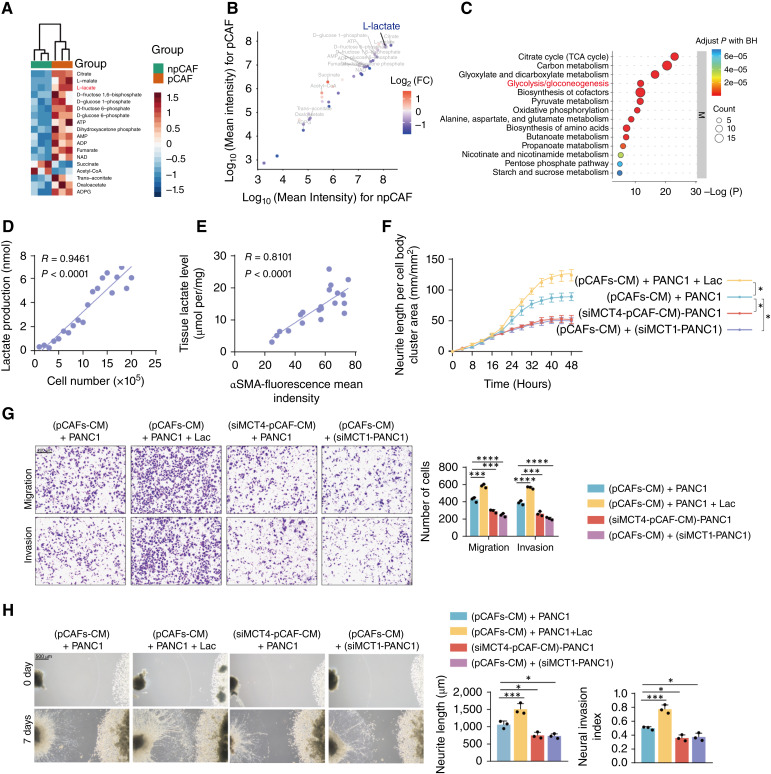
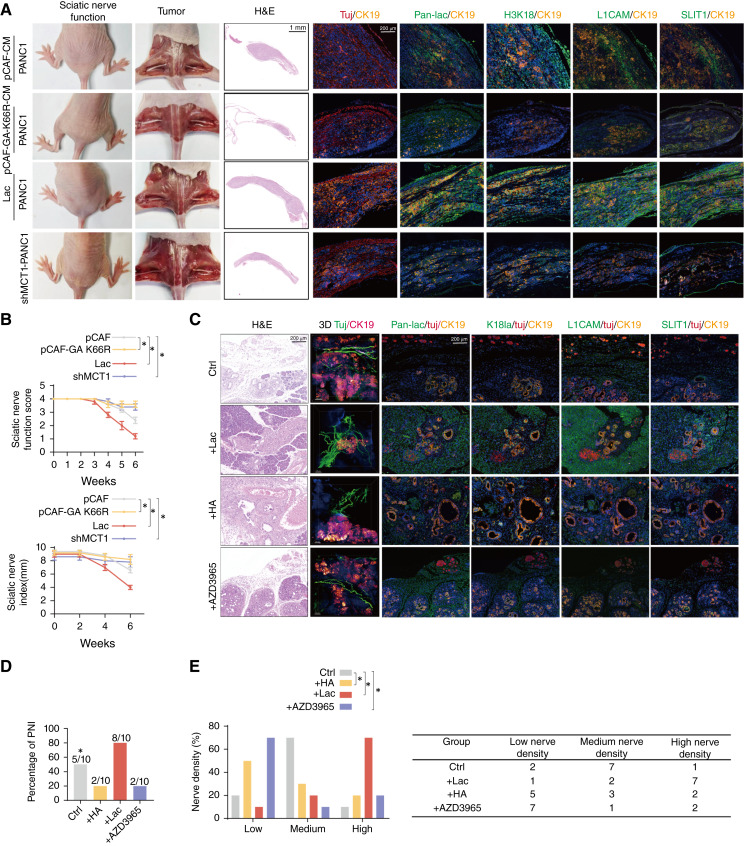
Perineural invasion (PNI) is a pivotal prognostic factor in pancreatic cancer, associated with aggressive tumor behavior and adverse patient outcomes. The recognized clinical impact of PNI highlights the need to better understand the molecular mechanisms underlying PNI-induced phenotypes. In this study, we isolated PNI-associated cancer-associated fibroblasts (pCAF), which demonstrated a markedly enhanced capacity to promote neural invasion in pancreatic cancer compared with non-PNI-associated CAFs. Single-cell, high-throughput sequencing and metabolomics data showed a significant upregulation of glycolysis in pCAFs, fostering a high-lactate tumor microenvironment conducive to cancer progression. pCAF-derived lactate was absorbed by tumor cells, facilitating histone H3K18 lactylation. The lactate-induced epigenetic modification activated the transcription of neural invasion-associated genes, such as L1CAM and SLIT1, thereby driving PNI in pancreatic cancer. Further exploration of metabolic reprogramming in pCAFs revealed enhanced acetylation of the glycolytic enzyme GAPDH, which correlated with increased enzymatic activity and glycolytic flux. Targeting GAPDH and lactylation modifications significantly inhibited neural invasion in a genetically engineered mouse model. Clinical data suggested that high levels of H3K18 lactylation correlate with severe PNI and poorer patient prognosis. Together, these findings provide critical insights into the role of CAFs in promoting PNI of pancreatic cancer, highlighting glycolytic reprogramming and lactate-driven histone modifications as potential therapeutic targets for PDAC.

Significance: Targeting cancer-associated fibroblast metabolism or histone lactylation in pancreatic cancer cells to reverse epigenetic remodeling induced by lactate accumulation in the tumor microenvironment are potential therapeutic strategies to inhibit perineural invasion.


Conflict of interest statement

No disclosures were reported.

Figures

None
Graphical abstract
Figure 1.
Figure 1.
The role of pCAFs in promoting neural invasion in pancreatic cancer. A, Schematic illustration of the Transwell coculture system for neuronal and tumor cells. Tumor cells were pretreated with fibroblast-derived CM. B, Quantitative analysis of neurite length in neuronal cells cultured in the Transwell system with npCAF or pCAF-CM. Phase contrast images were captured every 4 hours. UN, untreated cancer cells. n = 3 independent experiments; one-way ANOVA test; data are shown as the means ± SD. C, Representative image (left) and quantitative analysis (right) of PANC1 cell migration and invasion in the Transwell system following treatment with npCAF or pCAF-CM. Scale bars, 200 μm (n = 3 independent experiments; one-way ANOVA test; data are shown as the means ± SD). D, Schematic illustration of the 3D coculture system of tumor cells and DRG. Tumor cells were pretreated with fibroblast-derived culture medium. E, Left, representative image of a coculture of murine DRG with PANC1 cells treated with npCAF or pCAF culture medium. Right, quantitative analysis of the neuroinvasive ability of PANC1 cells. Scale bar, 500 μm. n = 3 independent experiments; one-way ANOVA test; data are shown as the means ± SD. F, Diagram showing the setup of sciatic nerve invasion models. PANC1 cells were pretreated with culture medium derived from npCAF or pCAF and then injected into the sciatic nerves of nude mice (n = 5 mice per group). G, Hind limb function was assessed weekly by scoring sciatic nerve function (n = 10 mice per group; Kruskal–Wallis test with Dunn multiple comparisons test; data are shown as the means ± SD). H, Sciatic nerve function was assessed every 2 weeks by determining the sciatic nerve index (n = 10 mice per group; Kruskal–Wallis test with Dunn multiple comparisons test; data are shown as the means ± SD). I, Gross and surgical images, hematoxylin and eosin (H&E) staining images of sciatic nerve invasion. The dotted line represents the boundary of the tumor. Scale bar, 1,000 μm. *, P < 0.05; **, P < 0.01; ***, P < 0.001; ****, P < 0.0001.
Figure 2.
Figure 2.
Metabolic reprogramming in pCAFs. A, Uniform Manifold Approximation and Projection (UMAP) plots of single cells identified by scRNA-seq, colored by major cell types. B, Heatmap displaying the most differentially expressed genes across each major cell type. C and D, UMAP plots and pie charts showing the distribution of different cell types in PDAC tissues with or without PNI. E, KEGG functional enrichment analysis of signaling pathway in CAFs from PDAC tissues with or without PNI. F and G, UMAP plots and bar plots displaying the reclustering of fibroblasts in scRNA-seq data from PDAC tissues with and without PNI. H, Gene set enrichment analysis of the glycolysis pathway comparing myCAFs with other CAF subtypes. I, Left, representative images of mIF staining for PDPN, αSMA, and CK19 in PDAC tissues with (PNI+) and without neural invasion (PNI). PDPN was used as a pan-CAF marker, αSMA was used as a myCAF marker, IL6 was used as an iCAF marker, and CK19 was used as a tumor marker. The corresponding intensity plots of regions of interest (straight yellow lines) in the mIF image are displayed on the right, respectively. Red curves, PDPN relative fluorescence intensity; green curves, αSMA or IL6 relative fluorescence intensity. The red-green overlap represents the colocalization of PDPN with αSMA or IL6. Higher peak intensity indicates stronger fluorescence expression. The dotted line represents the boundary of the tumor. ImageJ was used to quantify fluorescence intensity in these areas. Scale bars, 200 μm.
Figure 3.
Figure 3.
GAPDH acetylation regulates metabolic reprogramming in pCAFs. A, Western blot of the expression of GAPDH, PFKP, PKM2, and HK2 in npCAF or pCAF. B, qRT–PCR analysis of GAPDH, PFKP, PKM2, and HK2 in npCAF or pCAF. C, The enzyme activity of pyruvate kinase (PK), phosphofructokinase (PFK), hexokinase, and GAPDH in npCAF or pCAF. D, Pan-acetylation level was analyzed by immunoblotting with an anti-acetyl lysine antibody. E, An immunoprecipitation blot showing the GAPDH acetylation level, using a GAPDH antibody in vitro. F, The GAPDH acetylation modification site (red). G, The enzymatic activities of GAPDH variants (K66R, K139R, K186R, K263R) in vitro, with lysine (K) at positions 66, 139, 186, or 263 with arginine (R) to simulate a nonacetylated state. H, Three-dimensional stereostructure of GAPDH, with the green box representing K66. I, The K66 site in GAPDH is conserved across species. Alignment shows lysine residues corresponding to human GAPDH K66, highlighted in red. J, Effect of different GAPDH K66 mutations on acetylation levels. K66Q indicates that the lysine at position 66 is substituted by glutamine. K66R indicates that the lysine at position 66 is substituted by arginine. K–N, Effects of GAPDH K66 on aerobic glycolysis. The GAPDH K66 wild-type or K66-mutant pCAFs were assessed for oxygen consumption rate (OCR) as an indicator of oxidative phosphorylation and deduced levels of basal respiration and ATP production (K). Rot/AA, combination of rotenone and antimycin A. The ECAR was used to assess glycolytic flux and glycolytic capacity (L). The rate of glucose uptake (M) and lactate production (N) were analyzed in GAPDH K66 WT or K66-mutant pCAF. O, Representative Coomassie Aram staining image of GAPDH-associated proteins in pCAFs. The red line indicates the bands corresponding to distinct proteins enriched by GAPDH that were analyzed by LC-MS. P, MS identification of GAPDH-binding proteins. Q, The in vitro interactions of P300 and GAPDH were detected by immunoprecipitation. *, P < 0.05; **, P < 0.01; ***, P < 0.001.
Figure 4.
Figure 4.
pCAF-derived lactate influences perineural invasion in pancreatic cancer. A and B, Heatmap scatter plot showing the relative abundance of metabolites between npCAFs and pCAFs groups. BH, Benjamini-Hochberg; FC, fold change. C, Pathway enrichment analysis indicating upregulated metabolic pathways in pCAFs. The size of the dots represents the number of metabolites involved, and the color indicates the adjusted P values. D, Correlation between cell number and lactate production in pCAFs. The R values and P values were determined by Pearson correlation analysis. E, Correlation between αSMA fluorescence intensity and lactate production in PDAC tissues, n = 20. The R values and P values were determined by Pearson correlation analysis. F, Neurite length within the Transwell system was quantitatively analyzed under the indicated treatment. PANC1 cells under CM from pCAFs (pCAFs-CM) alone, or pCAFs with siMCT1 treatment (siMCT4-pCAFs-CM) or tumor cell culture medium with lactate supplementation or PANC1 with MCT1 depletion. Phase contrast images of neuronal cells were captured at 4-hour intervals (n = 5 independent experiments; one-way ANOVA test; data are shown as the means ± SD). G, Representative image (left) and quantitative analysis (right) of PANC1 cell migration and invasion in the Transwell system with the indicated treatment. Scale bar, 200 μm. n = 3 independent experiments; one-way ANOVA test; data are shown as the means ± SD. H, Neuroinvasive capacity of PANC1 cells following the specified treatment. Scale bar, 500 μm. n = 3 independent experiments; one-way ANOVA test; data are shown as the means ± SD. *, P < 0.05; ***, P < 0.001; ****, P < 0.0001.
Figure 5.
Figure 5.
pCAF-derived lactate regulates PNI through H3K18la. A–E, Tumor cells were treated with CM isolated from npCAFs or pCAFs and were used for subsequent experiments. A, Western blot of pan-lysine lactylation (Pan-Kla) levels in tumor cells treated as indicated. B, Immunofluorescence staining for Pan-Kla in PANC1 cells under the indicated treatments. Scale bar, 20 μm. C, Representative silver staining image of lactylation-associated proteins in PANC1 cells treated with pCAFs-CM. The red line highlights the protein bands enriched by the anti-lactylation antibody, which were subsequently analyzed by LC-MS. D, Western blot of H3K9la, H3K56la, and H3K18la in tumor cells treated as indicated. E, Immunofluorescence staining for H3K18la in tumor cells under the indicated treatments. Scale bar, 20 μm. F–I, PANC1 cells transfected with vector, plasmid with H3K18E (lysine to glutamate mutant), or plasmid with H3K18R (lysine to arginine mutant) were used for subsequent experiments. F, Western blot of H3K18la in PANC1 cells under the indicated treatments. G, Quantitative analysis of neurite length in the Transwell system under the indicated treatments. Phase contrast images of neuronal cells were acquired every 4 hours (n = 5 independent experiments; one-way ANOVA test; data are shown as the means ± SD). H, Representative image (left) and quantitative analysis (right) of PANC1 cell migration and invasion in the Transwell system under the indicated treatments. Scale bars, 200 μm. n = 3 independent experiments; one-way ANOVA test; data are shown as the means ± SD. I, Neuroinvasive capacity of PANC1 cells following the specified treatment. Scale bars, 500 μm. n = 3 independent experiments; one-way ANOVA test; data are shown as the means ± SD. J, mIF staining analysis of pan-lysine lactylation in PNI+ and PNI PDAC tissues. Tuj1 was used as a neuron marker. CK19 was used as a tumor marker. Scale bars, 200 μm. K, mIF staining analysis of H3K18la in PNI+ and PNI PDAC tissues. Tuj1 was used as a neuron marker, and CK19 was used as a tumor marker. Scale bars, 200 μm. *, P < 0.05; **, P < 0.01; ***, P < 0.001; ****, P < 0.0001.
Figure 6.
Figure 6.
H3K18la activates L1CAM and SLIT1 transcription in pancreatic cancer. A and B, Distribution of H3K18la sites relative to the translation start site (TSS). C, The pie diagram shows the genomic occupancy of H3K18 binding sites as revealed by ChIP-seq in PANC1 cells. D, KEGG analysis of H3K18la peaks. E, Bioinformatics analysis filtered L1CAM and SLIT1 as downstream targets of H3K18la. F, Integrative Genomics Viewer tracks for L1CAM and SLIT1 from ChIP-seq analysis; peaks are marked with red triangles. G, ChIP-qPCR assay of H3K18la status in the L1CAM and SLIT1 genomic region in PANC1 cells (n = 3 independent experiments; independent samples t test; data are shown as the means ± SD). H–K, qRT–PCR analysis of L1CAM and SLIT1 mRNA in PANC1 cells and PANC1 cells subjected to specific treatments as described previously (n = 3 independent experiments; one-way ANOVA test; data are shown as the means ± SD). L–O, Western blot of L1CAM and SLIT1 in PANC1 cells and PANC1 cells subjected to specific treatments as described previously. P, mIF staining analysis of L1CAM and SLIT1 in PNI+ and PNI PDAC tissues. S100 was used as a neuron marker, and CK19 was used as a tumor marker. Scale bars, 200 μm. *, P < 0.05; **, P < 0.01; ****, P < 0.0001.
Figure 7.
Figure 7.
pCAFs enhance PNI of pancreatic cancer via lactate-mediated H3K18la in vivo. A, Gross and surgical images, hematoxylin and eosin (H&E) staining, and mIF images. mIF showed pan-lac, H3K18, L1CAM, and SLIT1 expression in the sciatic nerve invasion model. The dotted line indicates the tumor boundary. Tuj1 served as a neuronal marker, and CK19 was used as a tumor marker. H&E, scale bars, 1,000 μm. mIF, scale bars, 200 μm. B, Sciatic nerve function scores and sciatic nerve indexes of mice treated as indicated (n = 5 mice per group). Kruskal–Wallis test with Dunn multiple comparisons test; data are shown as the means ± SD. C–E, KPC mice (LSL-KRASG12D/+; LSL-TRP53R172H/+; PDX-1-CRE+/+) were divided into four groups, with three groups respectively receiving i.p. injections of sodium lactate (1 g/kg), oral administration of the MCT1 inhibitor AZD3965 (100 mg/kg), and i.p. injections of heptenoic acid (1 mg/kg). n = 10 mice per group. C, Representative hematoxylin and eosin staining. mIF and 3D reconstruction images showing PNI status and pan-lac, H3K18, L1CAM, and SLIT1 expression in KPC mice treated as indicated. Tuj1 served as a neuron marker. CK19 was used as a tumor marker. Hematoxylin and eosin and mIF, scale bars, 200 μm. 3D scale bars, 500 μm. D, Proportion of PNI in KPC mice under the specified treatments (n = 10 mice per group). Fisher exact test. E, Nerve density percentage (left) and number (right) in KPC mice following the indicated treatments (n = 10 mice per group; χ2 test). *, P < 0.05. HA, heptenoic acid.
Figure 8.
Figure 8.
Pan-lac/H3K18la is associated with PNI and poor prognosis in patients with PDAC. A, mIF results for pan-lac, H3K18, L1CAM, and SLIT1 expression in patients with PDAC (n = 152). Scale bars, 200 μm. B–E, Quantitative breakdown of the specimen percentages featuring low or high expression of pan-lac (B), H3K18 (C), L1CAM (D), and SLIT1 (E) across PNI and PNI+ groups. F, Lactate levels of PNI and PNI+ tissues. G–N, Kaplan–Meier analysis of overall survival (OS) and DFS of patients with PDAC categorized by high or low pan-lac expression (G and H), high or low H3K18 expression (I and J), high or low L1CAM expression (K and L), and high or low SLIT1 expression (M and N). O, Schematic illustration delineating the mechanism by which pCAFs promote pancreatic cancer PNI by shaping a high-lactate TME, upregulating tumor cell histone H3K18la and transcriptionally activating the expression of genes associated with neural infiltration. Data are presented as mean ± SD. ****, P < 0.0001. O, Created with BioRender.com. Hu, C. (2025) https://BioRender.com/h04t962.

References

    1. Winkler F, Venkatesh HS, Amit M, Batchelor T, Demir IE, Deneen B, et al. Cancer neuroscience: state of the field, emerging directions. Cell 2023;186:1689–707. - PMC - PubMed
    1. Bapat A A, Hostetter G, Von Hoff DD, Han H. Perineural invasion and associated pain in pancreatic cancer. Nat Rev Cancer 2011;11:695–707. - PubMed
    1. Demir IE, Boldis A, Pfitzinger P L, Teller S, Brunner E, Klose N, et al. Investigation of Schwann cells at neoplastic cell sites before the onset of cancer invasion. J Natl Cancer Inst 2014;106:dju184. - PubMed
    1. Sinha S, Fu Y-Y, Grimont A, Ketcham M, Lafaro K, Saglimbeni J A, et al. PanIN neuroendocrine cells promote tumorigenesis via neuronal cross-talk. Cancer Res 2017;77:1868–79. - PMC - PubMed
    1. Lin Q, Zheng S, Yu X, Chen M, Zhou Y, Zhou Q, et al. Standard pancreatoduodenectomy versus extended pancreatoduodenectomy with modified retroperitoneal nerve resection in patients with pancreatic head cancer: a multicenter randomized controlled trial. Cancer Commun (Lond) 2023;43:257–75. - PMC - PubMed