. 2025 Mar 20;53(6):gkaf222.
doi: 10.1093/nar/gkaf222.

Targeted translation inhibition of chloroplast and mitochondrial mRNAs by designer pentatricopeptide repeat proteins

Affiliations

Targeted translation inhibition of chloroplast and mitochondrial mRNAs by designer pentatricopeptide repeat proteins

Nikolay Manavski et al. Nucleic Acids Res. .

Abstract

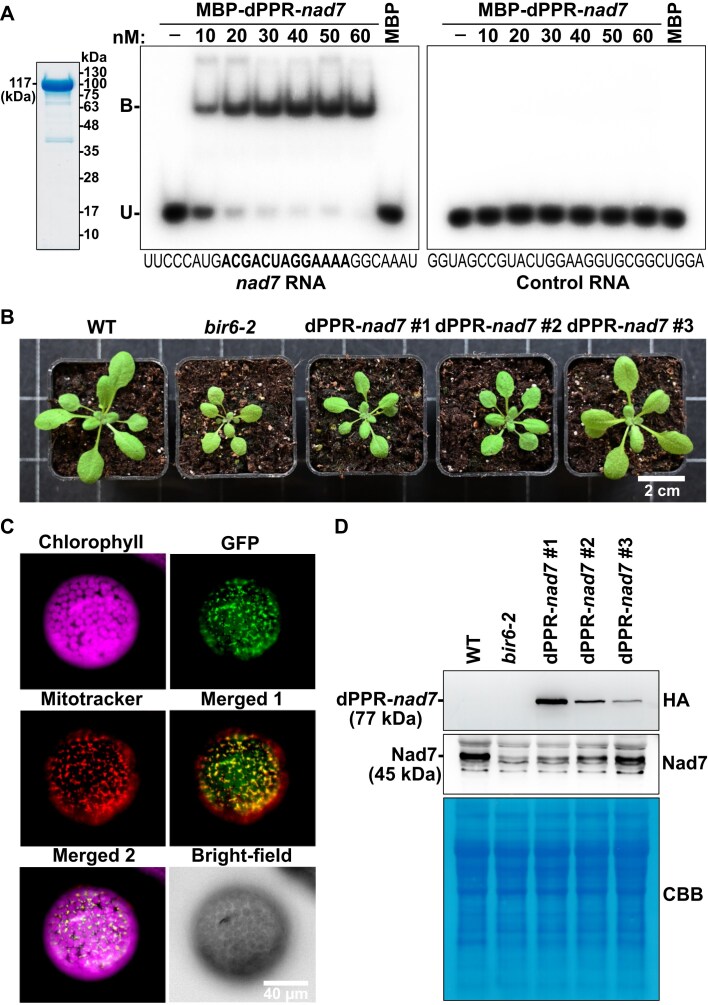
Pentatricopeptide repeat (PPR) proteins are crucial for organellar gene expression. To establish a tool for gene expression manipulation in Arabidopsis plastids and genetically inaccessible mitochondria, we engineered designer (dPPR) proteins to specifically inhibit the translation of organellar mRNAs by masking their start codons. Unlike prior methods for targeted downregulation of gene expression, which rely on re-targeting native PPR proteins to RNA sequences closely related to their original targets, our approach employs a synthetic P-type PPR scaffold that can be designed to bind any RNA sequence of interest. Here, using dPPR-psbK and dPPR-nad7, we targeted the psbK mRNA in chloroplasts and the nad7 mRNA in mitochondria, respectively. dPPR-psbK effectively bound to psbK mRNA and inhibited its translation with high specificity, resulting in disrupted PSII supercomplexes and reduced photosynthetic efficiency. dPPR-nad7 suppressed nad7 translation, affecting NADH oxidase activity in complex I and growth retardation. Comparing phenotypes with tobacco psbK knockouts and nad7 knockdown bir6-2 mutants, along with quantitative proteomics, showed no clear evidence of physiologically relevant off-target effects. Our findings establish dPPR proteins as precise tools for targeted translation inhibition, facilitating functional studies of organellar genes and offering a novel approach with potential for manipulating organellar gene expression in diverse plant species.


Conflict of interest statement

None declared.

Figures

Graphical Abstract
Graphical Abstract
Figure 1.
Figure 1.
In vitro binding, subcellular localization, and phenotype of dPPR-psbK mutant plants. (A) EMSA with increasing concentrations of purified dPPR-psbK fused to maltose-binding protein (MBP) and radiolabeled RNA containing the target psbK-binding site (highlighted in bold). A control EMSA with RNA of unrelated sequence demonstrates binding specificity. Reactions using purified MBP protein show that MBP alone does not bind RNA. The purity of MBP-dPPR-psbK was confirmed by SDS–PAGE followed by CBB staining. B represents bound, and U represents unbound RNA. (B) Chloroplast localization of transiently expressed dPPR-psbK-GFP in isolated N. benthamiana protoplasts. Images show eGFP fluorescence, chlorophyll autofluorescence, a merged image of both signals, and a bright-field image of the protoplast. (C) Phenotypic comparison of three independent dPPR-psbK transgenic lines grown alongside WT plants, shown at 3 weeks of age.
Figure 2.
Figure 2.
Phenotype comparison and photosynthetic performance of Arabidopsis dPPR-psbK lines and tobacco psbK knockout plants. (A) Images of 3-week-old Arabidopsis and tobacco plants with corresponding chlorophyll fluorescence imaging (Fv/Fm) below. Plant genotypes are labelled. Effective quantum yields of PSII are displayed on a false-color scale. (B) Photosynthetic parameters Fv/Fm, Φ(II), Φ(NO), Φ(I), Φ(ND), and Φ(NA) calculated for the plants shown in (A). Statistically significant differences from the WT are determined using Student’s t-tests (**P ≤ 0.01, ***P ≤ 0.001).
Figure 3.
Figure 3.
Molecular phenotype of Arabidopsis and tobacco psbK mutants examined by BN–PAGE. Chlorophyll-normalized, solubilized thylakoid complexes from Arabidopsis (A) and tobacco plants (B) were separated by BN–PAGE followed by SDS–PAGE and CBB staining of the second dimension. Protein complexes in the first dimension are indicated, genotypes are labeled. The squares highlight the reduced levels of PSII supercomplexes in both dPPR-psbK and ΔpsbK mutants. Sizes of the protein marker bands (kDa) are indicated on the left side of the gels.
Figure 4.
Figure 4.
Suppression of psbK translation in dPPR-psbK plants. (A) Steady-state levels of representative subunits of photosynthetic complexes. Immunoblot analyses were conducted using isolated thylakoids normalized to equal chlorophyll levels. For immnodecoration of the soluble dPPR-psbK protein, total protein extracts normalized to fresh weight were used. PsbK was detected in total protein and thylakoids (*). CBB staining was used as loading control. The detected proteins and their corresponding molecular weights are shown on the right, while the associated thylakoid membrane complexes are indicated on the left. ATP S., ATP synthase. (B) Polysome loading analysis of psbK and control transcripts psbA and psaA in WT and dPPR-psbK plants. Methylene Blue (M.B.) staining of the recovered fractions [1–12] is shown. The three different psbK transcript isoforms (mono-, di-, and tricistron) are indicated and illustrated schematically above the blots.
Figure 5.
Figure 5.
In vitro RNA recognition, phenotype, and subcellular localization of dPPR-nad7. (A) EMSA conducted with recombinant MBP-dPPR-nad7 protein and an nad7 specific RNA probe. The experimental setup and result presentation are similar to those in Fig. 1A. (B) Phenotype of bir6-2 and dPPR-nad7 lines. The plant phenotype of three independent dPPR-nad7 lines was compared with WT and bir6-2. (C) Mitochondrial localization of dPPR-nad7 fused to GFP. dPPR-nad7-GFP was transiently expressed in N. benthamiana protoplasts and cells were subsequently stained with the MitoTracker Orange CMTMRos (Invitrogen, Thermo Fisher Scientific). Fluorescence signals from GFP, the mitotracker, and chlorophyll, along with a bright-field image of the protoplast, are shown. The overlap of GFP and mitotracker fluorescence in merged image 1 demonstrates mitochondrial localization of dPPR-nad7-GFP, while merged image 2 excludes co-localization with chloroplasts. (D) Immunodetection of dPPR-nad7 and Nad7 in mitochondrial extracts from WT, bir6-2, and dPPR-nad7 lines #1–3.
Figure 6.
Figure 6.
Impairment of nad7 translation by dPPR-nad7 expression. (A) Steady-state levels of Nad7 and other mitochondrial proteins were examined by immunodetection. Detected proteins are listed on the right with their molecular weights. Corresponding complexes are shown on the left. Genotypes are indicated above. CBB staining of total mitochondrial extracts was used as loading control. CS, citrate synthase. (B) Polysome loading analysis of nad7 and nad4 in WT and dPPR-nad7 plants. The experimental setup and presentation are as described in Fig. 4B. (C) In-gel Complex I activity staining. Solubilized mitochondrial membrane proteins from WT, bir6-2, and dPPR-nad7 plants were separated by BN–PAGE. NADH oxidase activity of Complex I was assessed by incubating the gel in an NADH/NBT mix. The sizes of the protein marker bands are indicated on the left, while the detected complexes are labeled on the right. Asterisks denote faint bands, which likely represent assembly intermediates retaining residual oxidase activity. Complex I bands were quantified using ImageJ, and the relative Complex I activity efficiency (%) compared to WT is displayed below the gel. CI, Complex I; CIII, Complex III; DLDH, dihydrolipoamide dehydrogenase.
Figure 7.
Figure 7.
Quantitative proteomics analysis of dPPR-psbK and dPPR-nad7 plants. Volcano plots displaying differentially expressed proteins (DEPs) in dPPR-psbK (A) and dPPR-nad7 (B) compared to Col-0. DEPs were identified using a Student’s t-test, with the log2 fold change plotted against the −log10 adjusted P-value. Significantly up- or downregulated nonorganellar-encoded proteins (fold change > |1|, P-value ≤ 0.05) are shown in black. In plot (A), chloroplast-encoded proteins in dPPR-psbK versus Col-0 are highlighted in a distinct color, while in plot (B) mitochondria-encoded proteins in dPPR-nad7 versus Col-0 are marked with another distinct color. FC, fold change.

References

    1. Martin W, Rujan T, Richly E et al. . Evolutionary analysis of arabidopsis, cyanobacterial, and chloroplast genomes reveals plastid phylogeny and thousands of cyanobacterial genes in the nucleus. Proc Natl Acad Sci USA. 2002; 99:12246–51.10.1073/pnas.182432999. - DOI - PMC - PubMed
    1. Marienfeld J, Unseld M, Brennicke A The mitochondrial genome of Arabidopsis is composed of both native and immigrant information. Trends Plant Sci. 1999; 4:495–502.10.1016/S1360-1385(99)01502-2. - DOI - PubMed
    1. Svab Z, Hajdukiewicz P, Maliga P Stable transformation of plastids in higher plants. Proc Natl Acad Sci USA. 1990; 87:8526–30.10.1073/pnas.87.21.8526. - DOI - PMC - PubMed
    1. Kazama T, Okuno M, Watari Y et al. . Curing cytoplasmic male sterility via TALEN-mediated mitochondrial genome editing. Nat Plants. 2019; 5:722–30.10.1038/s41477-019-0459-z. - DOI - PubMed
    1. Forner J, Kleinschmidt D, Meyer EH et al. . Targeted introduction of heritable point mutations into the plant mitochondrial genome. Nat Plants. 2022; 8:245–56.10.1038/s41477-022-01108-y. - DOI - PMC - PubMed

MeSH terms

Substances

LinkOut - more resources