Clinical Trial
. 2025 Mar 26;13(3):e010222.
doi: 10.1136/jitc-2024-010222.

Systemic immunomodulation by irreversible electroporation versus stereotactic ablative body radiotherapy in locally advanced pancreatic cancer: the CROSSFIRE trial

Affiliations
Clinical Trial

Systemic immunomodulation by irreversible electroporation versus stereotactic ablative body radiotherapy in locally advanced pancreatic cancer: the CROSSFIRE trial

Bart Geboers et al. J Immunother Cancer. .

Abstract

Background: Irreversible electroporation (IRE) and stereotactic ablative body radiotherapy (SABR) are cytoreductive therapies for locally advanced pancreatic cancer (LAPC). Both may signify immunogenic cell death. We aimed to compare systemic immune responses between the treatments.

Methods: As part of the randomized phase II CROSSFIRE trial (NCT02791503), comparing the oncological efficacy of IRE to SABR in patients with LAPC, pre- and post-treatment (2 weeks and 3 months) peripheral blood samples were collected. Frequency and activation status of lymphocytic and myeloid subsets were determined using flow cytometry. T cell responses to pancreatic cancer associated with Wilms tumor-1 (WT-1) and survivin tumor antigens were determined by interferon-γ enzyme-linked immunospot assay.

Results: In total, 20 IRE and 20 SABR-treated participants were analyzed (20 men; median age 65 (IQR 55-70)). IRE induced immediate decreases in systemic regulatory T cell (Treg) and conventional type-1 dendritic cell rates, coinciding with CD4+/CD8+ T cell activation by upregulation of PD-1, which was associated with improved overall survival (OS). SABR similarly induced immediate CD4+/CD8+ T cell activation by upregulation of Ki67 and CD25 but resulted in asynchronously delayed Treg downregulation. SABR also induced a durable increase in CD4+ EM T cells, associated with improved OS. Ablation-induced WT-1 or survivin-specific T cell responses were observed in 9/16 (56%) immune competent participants (IRE n=5, SABR n=4) and were associated with longer OS.

Conclusion: Distinct immune stimulatory responses associated with improved OS, suggest that SABR might benefit from combined Treg depletion strategies while IRE could benefit from PD-1 checkpoint inhibition.

Trial registration number: The trial was registered on clinical trials.gov (NCT02791503).

Keywords: Abscopal; Adenocarcinoma; Immune modulatory.


Conflict of interest statement

Competing interests: MM is a paid consultant for Angio Dynamics, editor for Springer’s journal of Cardiovascular and Interventional Radiology, and founder and director of MedPeers. HS, FEFT, and BG received research funding from Angio Dynamics for the conduct of the PANFIRE I/II and III trials and CROSSFIRE trial. TDdG received research funding from Idera Pharmaceuticals and Glycostem and consultancy fees from LAVA Therapeutics, GE Health and Mendus. AR, DV, JB, MD, SML, RB, SN, BB, ES, PvdT, RP, and JdV have no relevant competing interests to declare.

Figures

Figure 1
Figure 1. Study flow diagram. A total of four participants were excluded prior to treatment due to rapid disease progression with metastases (n=2 SABR, n=1 IRE) and one unexpected death due to COVID-19 (n=1 IRE). Another 25 participants were excluded from immune analysis, because they refused participation (n=8), had insufficient PBMC yield at >1 postprocedural time point (n=5), or due to COVID-19-related incomplete data collection (n=11, > 1 missed blood sample collection). IRE, irreversible electroporation; PBMC, peripheral blood mononuclear cell; SABR, stereotactic ablative body radiotherapy.
Figure 2
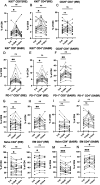
Figure 2. T cell frequencies, checkpoint, and activation markers. (A–C) Pre- and post-treatment activation marker fluctuations in 20 IRE-treated participants showed transient but significant proliferation of effector T cells by upregulation of (A) Ki67 on CD8+ (p=0.04) and (B) CD4+ T cells (p=0.03) and (C) non-significant upregulation of CD25 on CD4+ T cells 2 weeks after treatment. (D–F) Pre- and post-treatment activation marker fluctuations in 20 SABRtreated participants showed marked effector T cell proliferation by transient but significant upregulation of (D) Ki67 on CD8+ (p=0.002) and (E) CD4+ (p=0.02) T cells and (F) CD25 upregulation on CD4+ T cells (p=0.003). (G–J) Pre- and post-treatment checkpoint expression fluctuations in 20 IRE and 20 SABR-treated participants showed transient but significant upregulation of PD-1 expression on both (G) CD8+ (p=0.035) and (H) CD4+ (p=0.005) T cells 2 weeks post-IRE returning to baseline at 3 months. No PD-1 upregulation was observed after SABR on (I) CD8+ or (J) CD4+ T cells. (K–N) Pre- and post-treatment naïve and effector memory cell frequencies in 20 IRE and 20 SABRtreated participants showed a significant shift of (K) CD4+ naïve to (L) CD4+ effector memory T cells 2 weeks after IRE (p=0.035), and (M–N) SABR (p=0.0002), which was maintained up to 3 months (p=0.02) in the SABR-treated participants. All frequencies are expressed as percentages of total CD3+CD4+ or CD3+CD8+ T cells. *p=0.05 to 0.01, **p=0.01 to 0.001, ***p=0.001 to 0.0001; repeated-measures one-way analysis of variance or mixed effects analysis with post hoc Dunnett’s multiple comparison test were used for analysis in GraphPad V9.0.0. EM, effector memory; IRE, irreversible electroporation; SABR, stereotactic ablative body radiotherapy; T0, baseline measurement; T=2 wk, measurement 2 weeks post-treatment; T3mo, measurement 3 months post-treatment.
Figure 3
Figure 3. Regulatory T cell (Treg) frequencies. (A–C) Treg subset fluctuations pre- and post-treatment in 20 IRE-treated participants showed significant downregulation of (A) activated Treg (aTreg) (p=0.0009) and (C) total Treg subsets (p=0.0015) and (B) a trend for resting Treg (rTreg) downregulation (p=0.058) 2 weeks post-IRE. (D–F) Treg subset fluctuations pre- and post-treatment in 20 SABR-treated participants showed significant downregulation of (D) aTregs (p=0.039), no change in (E) rTreg, and (F) a trend for total Treg downregulation (p=0.16) 3 months post-SABR. All frequencies are expressed as percentages of total CD3+CD4+ T cells. *p=0.05 to 0.01, **p=0.01 to 0.001, ***p=0.001 to 0.0001; repeated-measures one-way analysis of variance or mixed effects analysis with post hoc Dunnett’s multiple comparison test were used for analysis in GraphPad V9.0.0. IRE, irreversible electroporation; PBMC, peripheral blood mononuclear cell; SABR, stereotactic ablative body radiotherapy; T0, baseline measurement; T=2 wk, measurement 2 weeks post-treatment; T3mo, measurement 3 months post-treatment.
Figure 4
Figure 4. Natural killer cell frequencies and activation markers. (A–D) Flow cytometrically measured regulatory and effector natural killer (NK) cell rates pre- and post-treatment in 20 IRE and 20 SABR-treated patients showed a significant shift from (A) regulatory (decrease at 2 weeks (p=0.014) and 3 months (p=0.044)) to (B) effector NK cells (increase at 2 weeks (p=0.028) and 3 months (p=0.043)) after IRE. (C–D) After SABR regulatory NK remained unchanged, but a transient decrease in systemic effector NK after 2 weeks was observed (p<0.0001) with (F–G) accompanying increased expression of HLA-DR on both subsets (regulatory, p=0.034/effector, p=0.008). *p=0.05 to 0.01, **p=0.01 to 0.001, ***p=0.001 to 0.0001, ****p<0.0001; repeated-measures one-way analysis of variance or mixed effects analysis with post hoc Dunnett’s multiple comparison test were used for analysis in GraphPad V9.0.0. IRE, irreversible electroporation; SABR, stereotactic ablative body radiotherapy.
Figure 5
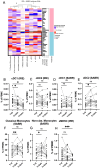
Figure 5. Myeloid cell frequencies. (A) Heatmap of changes in myeloid cell frequencies at 2 weeks post-treatment as compared with baseline (∆ 2 weeks), sorted by treatment. Values were normalized between 0 and 100 within each subset based on percentages of total PBMC. *Significantly decreased T2wk measurement compared with T0 measurement after IRE. ˆSignificantly increased T2wk measurement compared with T0 measurement after SABR. The black frame indicates the distinction between the generally increased myeloid cell frequencies after SABR compared with IRE. (B–C) Dendritic cell (DC) subset fluctuations pre- and post-treatment in 20 IRE and 20 SABR-treated participants showed (B) significantly decreased cDC1 cells 2 weeks (p=0.015) and 3 months (p=0.03) after IRE (C) without significant changes in cDC2 frequencies. (D) Unchanged cDC1 levels and (E) significantly increased cDC2 frequencies 2 weeks after SABR (p=0.017). (F–G) Monocyte subset fluctuations showed increased (F) classical (p=0.011) and (G) non-classical (p=0.007) monocyte frequencies 2 weeks after SABR. (H) IRE-treated patients showed a marked decrease in early myeloid derived suppressor cells (eMDSC) frequencies 3 months after treatment (p=0.0008). *p=0.05 to 0.01, **p=0.01 to 0.001, ***p=0.001 to 0.0001, ****p<0.0001; repeated-measures one-way analysis of variance or mixed effects analysis with post hoc Dunnett’s multiple comparison test were used for analysis in GraphPad V9.0.0. IRE, irreversible electroporation; PBMC, peripheral blood mononuclear cell; SABR, stereotactic ablative body radiotherapy.
Figure 6
Figure 6. Effector T cell activation in relation to overall survival. (A) Tumor-specific (ie, either against survivin or WT-1) T cell responses before and after treatment, shown for all individual immune competent patients (ie, with a positive recall antigen response, n=16) included in the enzyme-linked immunosorbent spot (ELISpot) analysis. Highest antigen-specific spots at any post-treatment time point are shown. Colored symbols indicate responders; black open symbols indicate non-responders. (B–E) Overall, immune responders had significantly longer overall survival (OS) compared with non-responders (B–C) (p=0.0078), which was also observed in the separate (D) IRE (p=0.0367) and (E) SABR cohorts (p=0.1044). (F) IRE-treated immune responders were observed to maintain PD-1 expression on CD8+ T cells up to 3 months after treatment (p=0.0262) when compared with non-responders. (G–H) Linear regression analysis showed positive correlations between PD-1 upregulation on (G) CD8+ T cells (p=0.046) and (H) CD4+ T cells (p=0.024) at T=2 weeks post-IRE compared with baseline (Δ 2 weeks) and overall survival from diagnosis. (I) SABR-treated immune responders showed a significant increase in CD4+ effector memory (EM) cells 3 months after treatment. (J–K) Linear regression analysis showed a positive association between increased frequencies of (J) CD8+ EM T cells (p=0.0262) and (K) CD4+ EM T cells (p=0.0356) at 3 months post-SABR compared with baseline (Δ 3 months), and OS from diagnosis. All frequencies are expressed as percentages of total CD3+CD4+/CD8+ T cells. *p=0.05 to 0.01, **p=0.01 to 0.001, ***p=0.001 to 0.0001; repeated-measures one-way anova and mixed effects analysis with post hoc Dunnett’s multiple comparison test were used for analysis in GraphPad V9.0.0. IFNγ, interferon-γ; IRE, irreversible electroporation; SABR, stereotactic ablative body radiotherapy; WT-1, Wilms tumor-1.

References

    1. Rawla P, Sunkara T, Gaduputi V. Epidemiology of Pancreatic Cancer: Global Trends, Etiology and Risk Factors. World J Oncol. 2019;10:10–27. doi: 10.14740/wjon1166. - DOI - PMC - PubMed
    1. Suker M, Beumer BR, Sadot E, et al. FOLFIRINOX for locally advanced pancreatic cancer: a systematic review and patient-level meta-analysis. Lancet Oncol. 2016;17:801–10. doi: 10.1016/S1470-2045(16)00172-8. - DOI - PMC - PubMed
    1. Hui L, Chen Y. Tumor microenvironment: Sanctuary of the devil. Cancer Lett. 2015;368:7–13. doi: 10.1016/j.canlet.2015.07.039. - DOI - PubMed
    1. Huang C, Iovanna J, Santofimia-Castaño P. Targeting Fibrosis: The Bridge That Connects Pancreatitis and Pancreatic Cancer. Int J Mol Sci. 2021;22:4970. doi: 10.3390/ijms22094970. - DOI - PMC - PubMed
    1. Das M, Zhou X, Liu Y, et al. Tumor neoantigen heterogeneity impacts bystander immune inhibition of pancreatic cancer growth. Transl Oncol. 2020;13:100856. doi: 10.1016/j.tranon.2020.100856. - DOI - PMC - PubMed

Publication types

Associated data