. 2025 Mar 26;15(1):97.
doi: 10.1038/s41398-025-03321-7.

Shared early molecular mechanisms revealed in P301S and 5xFAD Alzheimer's disease mouse models

Affiliations

Shared early molecular mechanisms revealed in P301S and 5xFAD Alzheimer's disease mouse models

Huda Suloh et al. Transl Psychiatry. .

Abstract

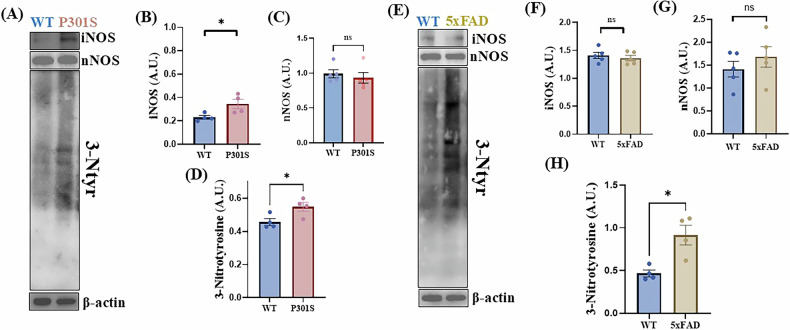
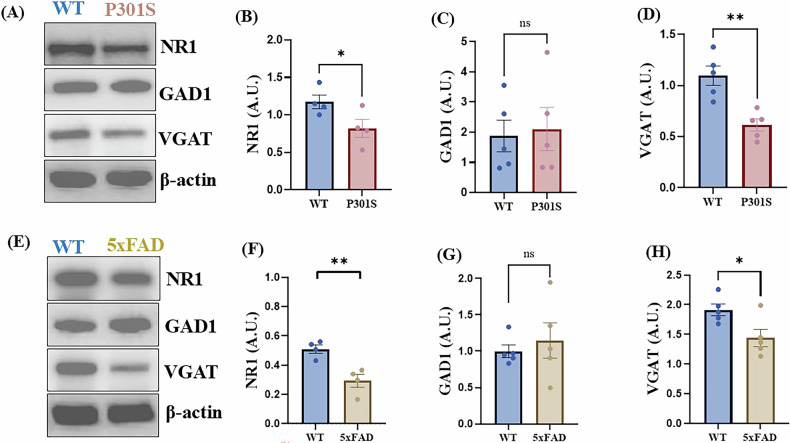
Alzheimer's disease (AD) is the most common neurodegenerative disorder characterized by early molecular events that influence disease progression. Still, the molecular mechanisms caused by different mutations of AD are not understood. We have performed a multidisciplinary study to investigate and compare the early stages of the pathology in two transgenic AD mouse models: P301S and 5xFAD. Using SNOTRAP-based mass spectrometry, we assessed changes in S-nitrosylation, a nitric oxide-mediated post-translational modification, of proteins in both models during their juvenile age. The increased levels of 3-nitrotyrosine confirmed nitrosative stress in the mutant mice. Systems biology analysis revealed shared processes between the models, particularly in the γ-aminobutyric acid (GABA)ergic and glutamatergic neurotransmission processes. In the P301S model, we identified 273 S-nitrosylated (SNOed) proteins in the cortex, with 244 proteins uniquely SNOed in the diseased mice. In the 5xFAD model, 309 SNOed proteins were identified. We have found altered proteins expression of different glutamate/GABA-related markers in the cortex and hippocampus of both AD mouse models. Additionally, the phosphorylation levels of the mTOR signaling components revealed hyperactivation of this pathway in P301S mice. Conversely, 5xFAD mice showed no significant changes in mTOR signaling except for elevated phosphorylation of the ribosomal protein S6 in the cortex. Our findings revealed key molecular mechanisms in the two AD mouse models during their early stages. These mechanisms could serve as potential biomarkers and therapeutic targets for early-stage AD.


Conflict of interest statement

Competing interests: HA is a CSO of Point6 Bio and Neuro-NOS. No funds from both companies were received for this study. All other authors do not hold any competing interests.

Figures

Fig. 1
Fig. 1. Schematic workflow of the SNOTRAP-based MS analysis of P301S and 5xFAD samples followed by systems biology analysis and biochemical validation using Western blot analysis.
*Tg transgenic mice.
Fig. 2
Fig. 2. Systems biology analysis of P301S and 5xFAD models.
A Shifts in the SNO pattern in P301S mice compared to their WT counterparts. The spheres contain the number of proteins S-nitrosylated in the mutant and WT mice or shared between the mutant and WT mice. B Biological processes related to the pathology which were enriched in the P301S brains. C Pathways analysis that might be regulated by the SNO-proteins in P301S brains. D Shifts in the SNO rates in 5xFAD mice compared to their WT counterparts. E Biological processes related to the pathology which were enriched in the 5xFAD brains. F Pathways analysis that might be regulated by the SNO-proteins in 5xFAD brains. G The shared processes related to AD that were enriched in both models.
Fig. 3
Fig. 3. iNOS, nNOS and 3-Nitrotyrosine (3-Ntyr) levels in the cortices of P301S and 5xFAD mice, and their WT counterparts.
A Representative WB for iNOS, nNOS and 3-Ntyr of the cortices of P301S mice and their WT counterparts. B The relative abundance of iNOS normalized to β-actin (a marker of protein loading). WT mice (n = 4), P301S mice (n = 4). C The relative abundance of nNOS normalized to β-actin. WT mice (n = 5), P301S mice (n = 5). D The relative abundance of 3-Ntyr normalized to β-actin. WT mice (n = 5), P301S mice (n = 5). E Representative WB for iNOS, nNOS, and 3-Ntyr prepared from the cortices of 5xFAD mice and their WT counterparts. F The relative abundance of iNOS normalized to β-actin. WT mice (n = 5), 5xFAD mice (n = 5). G The relative abundance of nNOS normalized to β-actin. WT mice (n = 5), P301S mice (n = 5). H The relative abundance of 3-Ntyr normalized to β-actin. WT mice (n = 5), 5xFAD mice (n = 5). An unpaired/independent two-tailed test was used. *p ≤ 0.05, ns non significant.
Fig. 4
Fig. 4. iNOS, nNOS and 3-Ntyr levels in the hippocampi of P301S and 5xFAD mice, and their WT counterparts.
A Representative WB for iNOS, nNOS and 3-Ntyr of the hippocampi of P301S mice and their WT counterparts. B The relative abundance of iNOS normalized to β-actin. WT mice (n = 4), P301S mice (n = 4). C The relative abundance of nNOS normalized to β-actin. WT mice (n = 5), P301S mice (n = 5) D The relative abundance of 3-Ntyr normalized to β-actin. WT mice (n = 4), P301S mice (n = 4). E Representative WB for iNOS, nNOS, and 3-Ntyr of the hippocampi of 5xFAD mice and their WT counterparts. F The relative abundance of iNOS normalized to β-actin. WT mice (n = 5), 5xFAD mice (n = 5). G The relative abundance of nNOS normalized to β-actin. WT mice (n = 5), 5xFAD mice (n = 5). H The relative abundance of 3-Ntyr normalized to β-actin. WT mice (n = 4), 5xFAD mice (n = 4). An unpaired/independent two-tailed test was used. *p ≤ 0.05, ns non significant.
Fig. 5
Fig. 5. The levels of the glutamatergic and GABAergic system proteins in the cortices of P301S and 5xFAD mice, and their WT counterparts.
A Representative WB for NR1, GAD1, and VGAT of the cortices of P301S and WT mice. B The relative abundance of NR1 normalized to β-actin. WT mice (n = 5), P301S mice (n = 5). C The relative abundance of GAD1 normalized to β-actin. WT mice (n = 5), P301S mice (n = 5). D The relative abundance of VGAT normalized to β-actin. WT mice (n = 5), P301S mice (n = 5). E Representative WB for NR1, GAD1, and VGAT of the cortices of 5xFAD and WT mice. F The relative abundance of NR1 normalized to β-actin. WT mice (n = 4), 5xFAD mice (n = 4). G The relative abundance of GAD1 normalized to β-actin. WT mice (n = 5), 5xFAD mice (n = 5). H The relative abundance of VGAT normalized to β actin. WT mice (n = 4), 5xFAD mice (n = 4). An unpaired/independent two-tailed test was used, *p ≤ 0.05, ns non significant.
Fig. 6
Fig. 6. The levels of the glutamatergic and GABAergic system proteins in the hippocampi of P301S and 5xFAD mice, and their WT counterparts.
A Representative WB for NR1, GAD1, and VGAT of the hippocampi of P301S and WT mice. B The relative abundance of NR1 normalized to β-actin. WT mice (n = 4), P301S mice (n = 4). C The relative abundance of GAD1 normalized to β actin. WT mice (n = 5), P301S mice (n = 5). D The relative abundance of VGAT normalized to β-actin. WT mice (n = 5), P301S mice (n = 5). E Representative WB for NR1, GAD1, and VGAT of the hippocampi of 5xFAD and WT mice. F The relative abundance of NR1 normalized to β-actin. WT mice (n = 4), 5xFAD mice (n = 4). G The relative abundance of GAD1 normalized to β-actin. WT mice (n = 5), 5xFAD mice (n = 5). H The relative abundance of VGAT normalized to β-actin. WT mice (n = 4), 5xFAD mice (n = 4). An unpaired/independent two -tailed test were used, *p ≤ 0.05, **p ≤ 0.01, ns non significant.*p < 0.05; **p < 0.01 vs. WT; ns non significant.
Fig. 7
Fig. 7. The levels of the mTOR-related proteins in the cortices of P301S and 5xFAD mice, and their WT counterparts.
A Representative WB for p-AKT, AKT, TSC2, p-mTOR, mTOR, p-RPS6, and RPS6 of the cortices of P301S and WT mice. B The relative abundance of p-AKT normalized for AKT and β-actin. WT mice (n = 5), P301S mice (n = 5). C The relative abundance of TSC2 normalized to β-actin. WT mice (n = 5), P301S mice (n = 5). D The relative abundance of p-mTOR normalized to mTOR and β-actin. WT mice (n = 4), P301S mice (n = 4). E The relative abundance of p-RPS6 normalized to RPS6 and β-actin. WT mice (n = 4), P301S mice (n = 4). F Representative WB for p-AKT, AKT, TSC2, p-mTOR, mTOR, p-RPS6, and RPS6 of the cortices of 5xFAD and WT mice. G The relative abundance of p-AKT normalized to AKT and β-actin. WT mice (n = 5), 5xFAD mice (n = 5). H The relative abundance of TSC2 normalized to β-actin. WT mice (n = 5), 5xFAD mice (n = 5). I The relative abundance of p-mTOR normalized to mTOR and β-actin. WT mice (n = 5), 5xFAD mice (n = 5). J The relative abundance of p-RPS6 normalized to RPS6 and β-actin. WT mice (n = 4), 5xFAD mice (n = 4). An unpaired/independent two-tailed test were used, *p ≤ 0.05, **p ≤ 0.01, ns non significant.
Fig. 8
Fig. 8. The levels of the mTOR-related proteins in the hippocampi of P301S and 5xFAD mice, and their WT counterparts.
A Representative WB for p-AKT, AKT, TSC2, p-mTOR, mTOR, p-RPS6, and RPS6 of the hippocampi of P301S and WT mice. B The relative abundance of p-AKT normalized to AKT and β-actin. WT mice (n = 4), P301S mice (n = 4). C The relative abundance of TSC2 normalized to β-actin. WT mice (n = 5), P301S mice (n = 5). D The relative abundance of p-mTOR normalized to mTOR and β-actin. WT mice (n = 5), P301S mice (n = 5). E The relative abundance of p-RPS6 normalized to RPS6 and β-actin. WT mice (n = 5), P301S mice (n = 5). F Representative WB for p-AKT, AKT, TSC2, p-mTOR, mTOR, p-RPS6, and RPS6 of the hippocampi of 5xFAD and WT mice. G The relative abundance of p-AKT normalized to AKT and β-actin. WT mice (n = 5), 5xFAD mice (n = 5). H The relative abundance of TSC2 normalized to β-actin. WT mice (n = 5), 5xFAD mice (n = 5). I The relative abundance of p-mTOR normalized to mTOR and β-actin. WT mice (n = 5), 5xFAD mice (n = 5). J The relative abundance of p-RPS6 normalized to RPS6 and β-actin. WT mice (n = 5), 5xFAD mice (n = 5). An unpaired/independent two-tailed test were used, *p ≤ 0.05, ns non significant.

Similar articles

Cited by

References

    1. Mencer S, Kartawy M, Lendenfeld F, Soluh H, Tripathi MK, Khaliulin I, et al. Proteomics of autism and Alzheimer’s mouse models reveal common alterations in mTOR signaling pathway. Transl Psychiatry. 2021;11:1–10. - PMC - PubMed
    1. Tripathi MK, Kartawy M, Amal H. The role of nitric oxide in brain disorders: autism spectrum disorder and other psychiatric, neurological, and neurodegenerative disorders. Redox Biol. 2020;34:101567. - PMC - PubMed
    1. Zvěřová M. Clinical aspects of Alzheimer’s disease. Clin Biochem. 2019;72:3–6. - PubMed
    1. Kuslansky G, Buschke H, Katz M, Sliwinski M, Lipton RB. Screening for Alzheimer’s disease: the memory impairment screen versus the conventional three‐word memory test. J Am Geriatrics Soc. 2002;50:1086–91. - PubMed
    1. Morshed N, Ralvenius WT, Nott A, Watson LA, Rodriguez FH, Akay LA, et al. Phosphoproteomics identifies microglial Siglec‐F inflammatory response during neurodegeneration. Mol Syst Biol. 2020;16:e9819. - PMC - PubMed

LinkOut - more resources