Multicenter Study
. 2025 Mar 26;15(1):10419.
doi: 10.1038/s41598-025-94692-w.

Longitudinal fecal microbiota and volatile metabolomics preceding necrotizing enterocolitis in preterm infants: a case-control study

Affiliations
Multicenter Study

Longitudinal fecal microbiota and volatile metabolomics preceding necrotizing enterocolitis in preterm infants: a case-control study

S El Manouni El Hassani et al. Sci Rep. .

Erratum in

Abstract

Alterations in fecal microbiota and volatile organic compound (VOC) profiles of preterm infants have been demonstrated before onset of necrotizing enterocolitis (NEC). However, NEC-specific signatures need to be identified before potential application as predictive biomarker in clinical practice. A prospective multicenter case-control study was conducted to identify preclinical fecal microbiota and VOC profiles of infants that developed NEC. Microbiota analysis (PCR-based IS-pro technique) and VOC analysis (gas chromatography-mass spectrometry) were performed on fecal samples collected up to three days before clinical NEC onset. In 112 infants (56 NEC, 56 matched controls), sufficient number fecal samples were collected for either microbiota or VOC analysis. Prior to NEC onset, Clostridium perfringens (p = 0.023, unadjusted) was more present in infants with NEC, versus controls. VOC analysis showed a clear distinction between fecal profiles of NEC cases and controls (area under the curve = 0.82). Fourteen unique VOC features contributed to this discrimination. Fecal microbiota and VOC profiles may serve as early indicators of NEC, and allow for increased understanding of pathophysiological mechanisms of NEC, but larger validation cohorts are needed before an overarching NEC-specific predictive microbiota-based biomarker can be implemented.

Keywords: Metabolomics; Microbiome; Necrotizing enterocolitis; Stool; Volatile organic compounds.


Conflict of interest statement

Declarations. Competing interests: The authors declare no competing interests. Ethics statement: The study was approved by all local Medical Ethical Review Boards (protocol number A2016.313) and written informed consent was obtained from the legal guardians of all included infants. All experiments were performed in accordance with relevant guidelines and regulations.

Figures
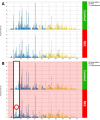
Fig. 1
Fig. 1
Cumulative IS-profiles of infants with NEC (all NEC-stages) versus controls. The peak length is displayed on the x-axis and corresponds to IS-fragment length. The peak height on the y-axis reflects the number of infants in which the corresponding peak was found. (A) In infants with NEC, Clostridium perfringens (peak length 235; p = 0.023, FDR adjusted p = 0.15) was significantly more observed compared to controls. (B) The highlighted version of A. IS, interspace; NEC, necrotizing enterocolitis; FAFV, Firmicutes, Actinobacteria, Fusobacteria and Verrucomicrobia.
Fig. 2
Fig. 2
Shannon diversity index for all phyla between NEC cases and controls. (A) The Shannon diversity index is displayed for all phyla combined, and the three phyla (Bacteroidetes, FAFV, and Proteobacteria) separate. The image shows the differences between all NEC cases versus control group for all three time points separately. There were no significant differences observed. (B) The difference in Shannon diversity index is displayed over time from three days before diagnosis (t-3) to one day before diagnosis (t-1) for both NEC cases and controls for all phyla combined, and the three phyla separately. Each point resembles a sample. A line is drawn between samples from the same infant. There were no significant differences in Shannon diversity over time. NEC, necrotizing enterocolitis; FAFV, Firmicutes, Actinobacteria, Fusobacteria and Verrucomicrobia; − 3, − 2, and − 1 represent three, two and one day(s) before diagnosis, respectively.
Fig. 3
Fig. 3
Mean absolute and relative abundance for all phyla per time point between NEC cases and controls. (A) The mean absolute abundance per time point (− 3, − 2, and − 1), phylum (Bacteroidetes, FAFV, and Proteobacteria), and study group (NEC vs controls) is displayed. There were no significant differences. (B) This shows relative abundance per time point, phylum and study group. (C) The mean absolute abundance is displayed over time from three days before diagnosis (t-3) to one day before diagnosis (t-1) for both NEC cases and controls for the three phyla separately. Each point resembles a sample. A line is drawn between samples from the same infant. There were no significant differences in mean and absolute abundance, and no differences in mean absolute abundance over time. NEC, necrotizing enterocolitis; FAFV, Firmicutes, Actinobacteria, Fusobacteria and Verrucomicrobia; − 3, − 2, and − 1 represent three, two and one day(s) before diagnosis, respectively; RFU, relative fluorescence units.
Fig. 4
Fig. 4
Similarities between samples as measured by cosine similarity measure. Similarity values range between zero and one. Higher cosine similarity values demonstrate an increase in sample similarity. (A) Includes all sample pairs irrelevant of disease state. This demonstrates that all samples are moderately similar (similarity index 0.7). (B) Shows the similarity between study groups, indicating that samples within the NEC and within the control group are more similar to each other (similarity index 0.9). (C) Demonstrating intra-individual similarity. This shows that control samples are more stable over time compared to NEC samples. NEC, necrotizing enterocolitis.
Fig. 5
Fig. 5
Receiver-operating-characteristic curves and features performance by logistic regression classification. (A) Receiver-operating-characteristic curves for the different feature sets as obtained by logistic regression classification (n = 44 infants with NEC vs. 44 controls). Diagonal dashed line represents a random guess. (B) Influence of the number of features on the performance of the logistic regression classification model. A plateau is reached when 14 features are included in the classification model. Including more than 15 features did not result in an improved diagnostic accuracy in differentiating infants with NEC from controls (n = 44 infants with NEC vs. 44 controls). AUC, area under curve; Fs-frag, fragment feature including single day features (e.g. one of the three time points); Fd-frag fragment feature differences between two time points (e.g. between day one and two or day two and three); Fs-chro, chromatogram feature including single day features; Fd-chro, chromatogram feature differences between two time points; Ffrag fragment feature in which all time points and differences between time points are included; Fchro, chromatogram feature in which all time points and differences between time points are included. FFC, all fragment and chromatogram features were included in the classification model.

References

    1. Thyoka, M. et al. Advanced necrotizing enterocolitis part 1: Mortality. Eur. J. Pediatric Surg.22(1), 8–12 (2012). - PubMed
    1. Eaton, S., Rees, C. M. & Hall, N. J. Current research on the epidemiology, pathogenesis, and management of necrotizing enterocolitis. Neonatology111(4), 423–430 (2017). - PubMed
    1. Rich, B. S. & Dolgin, S. E. Necrotizing enterocolitis. Pediatr. Rev.38(12), 552–559 (2017). - PubMed
    1. Sharma, R. & Hudak, M. L. A clinical perspective of necrotizing enterocolitis: Past, present, and future. Clin. Perinatol.40(1), 27–51 (2013). - PMC - PubMed
    1. Neu, J. Prevention of necrotizing enterocolitis. Clin. Perinatol.49(1), 195–206 (2022). - PubMed

Publication types

LinkOut - more resources