. 2025 Mar 26;15(1):10374.
doi: 10.1038/s41598-025-93916-3.

Single-cell RNA sequencing reveals potential therapeutic targets in the tumor microenvironment of lung squamous cell carcinoma

Affiliations

Single-cell RNA sequencing reveals potential therapeutic targets in the tumor microenvironment of lung squamous cell carcinoma

Junda Fan et al. Sci Rep. .

Abstract

Lung squamous cell carcinoma (LUSC), accounting for 30% of lung cancer cases, lacks adequate research due to limited understanding of its molecular abnormalities. Our study analyzed public LUSC datasets to explore the tumor microenvironment (TME) composition using scRNA-seq from two cohorts. Applying non-negative matrix factorization, we identified unique malignant cell phenotypes, or meta-programs (MPs), based on gene expression patterns. Survival analysis revealed the clinical relevance of these MPs. Findings illuminated a TME landscape enriched with immune cells-CD8 + T, exhausted T, CD4 + T, and naive T cells-and suggested roles for myeloid cells, like cDC1 and pDCs, in LUSC progression. Different MPs highlighted the heterogeneity of malignant cells and their clinical implications. Targeting MP-specific genes may enable personalized therapy, especially for early-stage LUSC. This study offers insights into immune cell function in tumor dynamics, identifies MPs, and paves the way for novel LUSC strategies, enhancing early intervention, personalized treatment, and prognosis, ultimately improving patient outcomes.

Keywords: Bioinformatics; Lung cancer; Non-negative matrix factorization; Single-cell RNA sequencing; Tumor microenvironment.


Conflict of interest statement

Declarations. Competing interests: The authors declare no competing interests.

Figures

Fig. 1
Fig. 1
Identification of cellular composition in the tumor microenvironment (TME) of lung squamous cell carcinoma (LUSE) from two independent cohorts. (a) Projection of all cells from the two cohorts into a UMAP (Uniform Manifold Approximation and Projection) space, with cells colored by their sources. (b) Unsupervised clustering reveals major cell types in the merged dataset, with cells in the UMAP plot colored according to their respective cell types. (c) Heatmap visualization of inferred copy number variation (CNV) profiles for each cell, based on transcriptomic data. The colorbar at the top of the heatmap represents the clustering result of cells based on their CNV profiles. (d) Dotplot displaying marker genes identified in the major cell types within the merged dataset. The size of each dot indicates the expression prevalence of the corresponding gene, while the dot color represents the average expression of the gene across the entire population of the corresponding cell type.
Fig. 2
Fig. 2
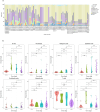
Analysis of Cellular Proportions in the LUSC TME. (a) Stacked barplot illustrating the major cell types present in all tumor samples included in this study. The samples are ordered by disease stage, and the color represents the corresponding cell type. The height of each color within a sample indicates the proportion of that specific cell type. (b) Violin plots depicting the proportions of the given cell type in samples from different tumor stages. A t-test was performed to assess the statistical significance of differences in cell type proportions between the two tumor stages.
Fig. 3
Fig. 3
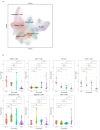
The exploration of T cells within the TME of LUSC. (a) UMAP plot illustrating the identification of 7 distinct T cell subpopulations using the Leiden algorithm in this investigation. (b) Violin plots presenting the relative proportions of the specific T cell subpopulation in samples from various tumor stages. Statistical significance of differences in cell type proportions between the two tumor stages was evaluated using a t-test.
Fig. 4
Fig. 4
The subpopulations of myeloid cells present in the TME of LUSC. (a) UMAP plot demonstrating the identification of all myeloid cell subpopulations using unsupervised clustering. (b) Violin plots displaying the relative proportions of the specific myeloid cell subpopulation in samples from different tumor stages. The statistical significance of differences in cell type proportions between the two tumor stages was assessed using a t-test.
Fig. 5
Fig. 5
Characterization of epithelial cell subpopulations in the tumor microenvironment (TME) of LUSC. (a) UMAP plot demonstrating the identification of 6 distinct epithelial cell subpopulations through the application of the Leiden algorithm in this study. (b) Violin plots displaying the relative proportions of specific epithelial cell subpopulations in samples from different tumor stages. Statistical analysis using a t-test was conducted to evaluate the significance of differences in cell type proportions between the two tumor stages.
Fig. 6
Fig. 6
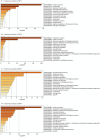
Gene function analysis of four robust MPs in LUSC. (a-d) Bar plots depicting the top 15 enriched Gene Ontology (GO) terms associated with the representative genes from MP1 (a), MP2 (b), MP3 (c), and MP4 (d) in LUSC.
Fig. 7
Fig. 7
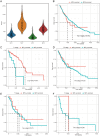
Clinical implications of MPs in LUSC patients from the TCGA cohort. (a) Violin plot displaying the distribution of enrichment scores for all TCGA samples across four MPs. (b-f) The survival curves illustrate the differences in survival between the MP2 and MP4 clusters across all tumors (b), as well as specifically for T1 tumors (c), T2 tumors (d), T3 tumors (e), and T4 tumors (f).

References

    1. Bray, F. et al. Global cancer statistics 2018: GLOBOCAN estimates of incidence and mortality worldwide for 36 cancers in 185 countries. CA Cancer J. Clin.68 (6), 394–424 (2018). - PubMed
    1. Herbst, R. S., Morgensztern, D. & Boshoff, C. The biology and management of non-small cell lung cancer. Nature553 (7689), 446–454 (2018). - PubMed
    1. Ohue, Y. & Nishikawa, H. Regulatory T (Treg) cells in cancer: can Treg cells be a new therapeutic target? Cancer Sci.110 (7), 2080–2089 (2019). - PMC - PubMed
    1. Chen, S. et al. Introduction of exogenous wild–type p53 mediates the regulation of oncoprotein 18/stathmin signaling via nuclear factor–κB in non–small cell lung cancer NCI–H1299 cells. Oncol. Rep.41 (3), 2051–2059 (2019). - PubMed
    1. Yang, M. et al. A multi-omics machine learning framework in predicting the survival of colorectal cancer patients. Comput. Biol. Med.146, 105516 (2022). - PubMed

MeSH terms

Substances