. 2025 Mar 26;15(1):10446.
doi: 10.1038/s41598-025-93629-7.

SAMHD1 dysfunction impairs DNA damage response and increases sensitivity to PARP inhibition in chronic lymphocytic leukemia

Affiliations

SAMHD1 dysfunction impairs DNA damage response and increases sensitivity to PARP inhibition in chronic lymphocytic leukemia

Alberto Rodríguez-Sánchez et al. Sci Rep. .

Abstract

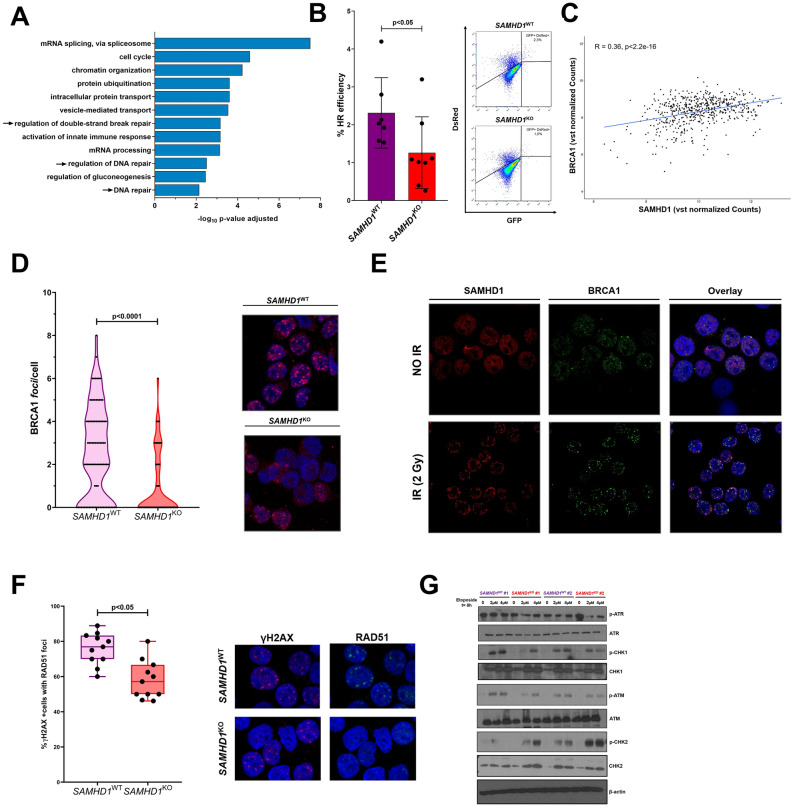
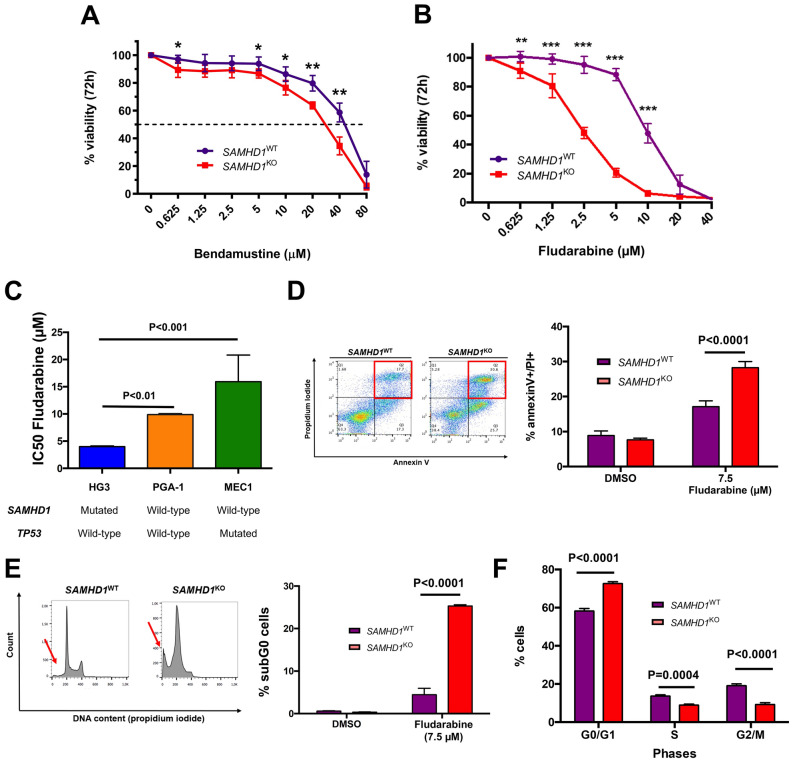
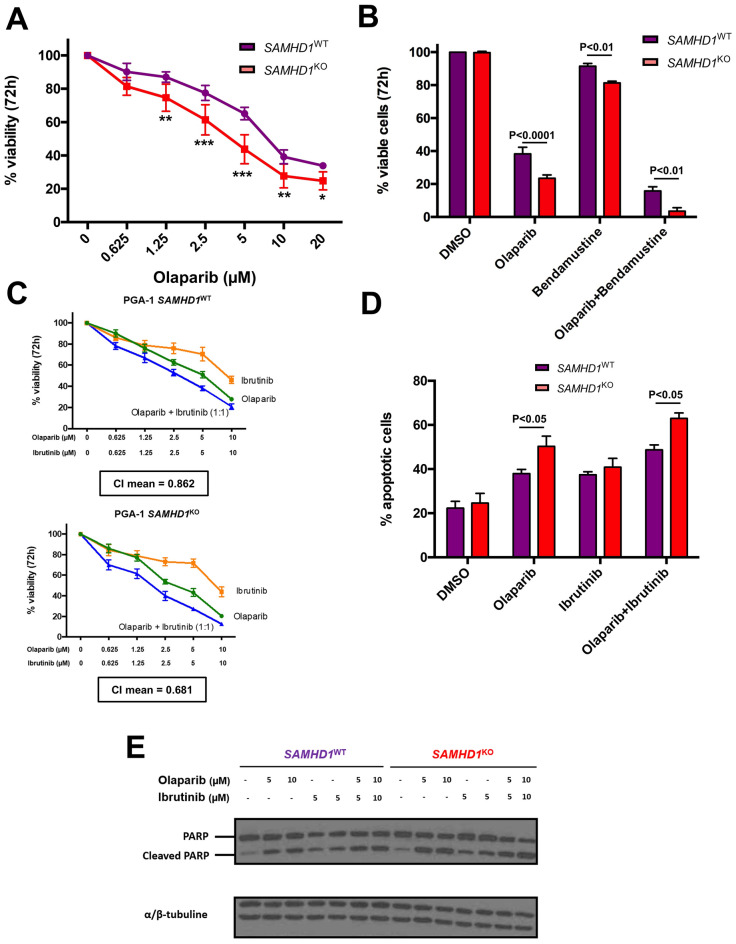
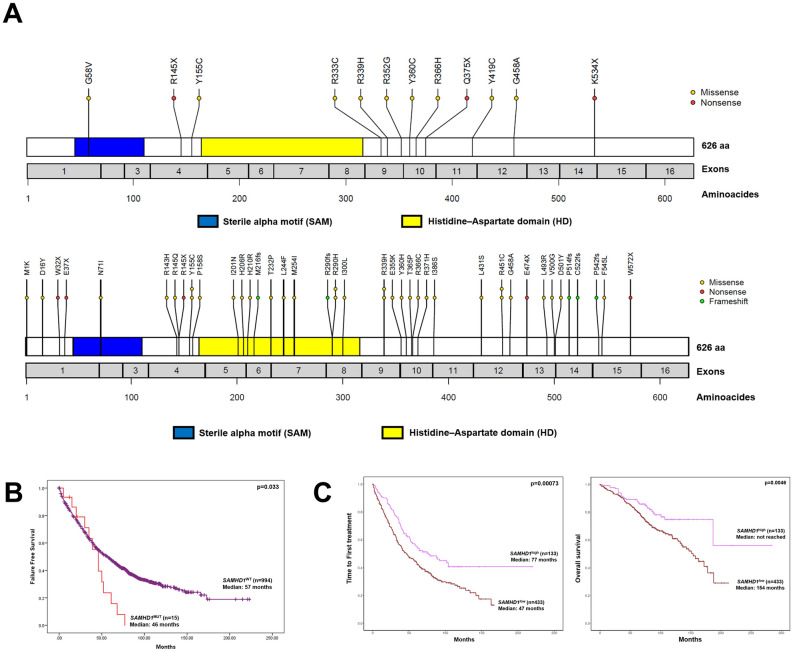
Chronic lymphocytic leukemia (CLL) is a clinically and genetically heterogenous disease. Recent next-generation sequencing (NGS) studies have uncovered numerous low-frequency mutated genes in CLL patients, with SAMHD1 emerging as a candidate driver gene. However, the biological and clinical implications of SAMHD1 mutations remain unclear. Using CRISPR/Cas9, we generated CLL models to investigate the impact of SAMHD1 deficiency on pathogenesis and explore therapeutic strategies. Moreover, we performed NGS in treatment-naïve CLL patients to characterize SAMHD1 mutations and employed RNA-sequencing to evaluate their clinical significance. Our study shows that SAMHD1 inactivation impairs the DNA damage response by reducing homologous recombination efficiency through BRCA1 and RAD51 dysregulation. Importantly, SAMHD1 colocalizes with BRCA1 at DNA damage sites in CLL cells. This research also identifies that SAMHD1-mutated cells are more sensitive to PARP inhibition. Clinically, SAMHD1 dysfunction negatively impacts clinical outcome of CLL cases: SAMHD1 mutations reduce failure-free survival (median 46 vs 57 months, p = 0.033), while low SAMHD1 expression associates with shorter time to first treatment (median 47 vs 77 months; p = 0.00073). Overall, this study elucidates that SAMHD1 dysfunction compromises DNA damage response mechanisms, potentially contributing to unfavorable clinical outcomes in CLL, and proposes PARP-inhibitors as a potential therapeutic approach for SAMHD1-mutated CLL cells.


Conflict of interest statement

Declarations. Competing interests: The authors declare no competing interests. Ethics declarations: This study was approved by the ethics committee of Hospital Universitario de Salamanca and written informed consent was obtained from all participants before they entered the study in accordance to the declaration of Helsinki.

Figures

Fig. 1
Fig. 1
Biological effects of SAMHD1 dysfunction in DNA damage response in CLL. (A) Plots depicting GO analysis results of the top significantly enriched pathways correlated with SAMHD1 expression in CLL patients. Arrows emphasize the biological processes related with DNA damage response. (B) Left panel: HR efficiency graph for DSB repair in PGA1 cell line using a HR reporter plasmid. HR repair efficiency was calculated as the ratio of GFP + cells to the total number of DsRed + (transfected) cells. Three clones per condition in 3 independent experiments were analyzed. Results are shown as mean ± SD. Right panel: Representative plots of HR repair in SAMHD1WT and SAMHD1KO cells. (C) Correlation analysis between BRCA1 and SAMHD1 mRNA expression normalized with the vst score in CLL patients from the CLL map project. (D) Left panel: Quantification of BRCA1 foci/cell in SAMHD1WT and SAMHD1KO cells 1-h post-IR. At least fifty cells were counted per experiment in two independent clones per condition. Right panel: Representative images of BRCA1-positive cells 1 h after irradiation (2 Gy). (E) Representative immunofluorescence images showing the colocalization of SAMHD1 with BRCA1 at DNA damage sites following 2 Gy irradiation. Images include untreated control (no irradiation) and irradiated (DNA-damage induced) conditions. (F) Left panel: Measurement of RAD51 foci/cell in γH2AX positive cells 6 h post-IR. Cells were considered as γH2AX + when 5 or more foci were formed. At least fifty cells were counted per experiment. Two independent experiments were performed in three biological replicates. Right panel: Representative images of γH2AX + cells and RAD51 localization. (G) Western blot analyses depicting the expression of the proteins implicated in DNA damage signaling ATM, ATR, CHK1 and CHK2; and their phosphorylated forms. Cells were not treated (0), or treated with 2 or 4 µM of etoposide for 8 h. Two single-cell clones were analyzed for each condition.
Fig. 2
Fig. 2
Impact of SAMHD1 disruption on response to DNA damage inducers. (A, B) Dose–response curves of bendamustine (A) and fludarabine (B) treatment in PGA1 cell line. Cells were treated with escalating doses of bendamustine (0.625–80 µM) or fludarabine (0.625–40 µM) for 72 h. Cell viability was assessed with MTT, and surviving fraction is expressed relative to DMSO control. Dashed line represents the reduction of IC50 value in SAMHD1KO cells. Data are represented as mean ± SD of three independent experiments. (C) IC50 value (µM) for fludarabine treatment in 3 CLL cell lines (HG3, PGA-1 and MEC1). Information of SAMHD1 and TP53 status were summarized below the graph. (D) Representative annexin V/PI dot-plots (left panel) to determine apoptotic (annexin V + /PI +) cells (right panel) after 7.5 µM fludarabine for 48 h. (E) PI staining for determination of subG0 population (left panel) for PGA1 cells, reflecting the increase of apoptotic SAMHD1KO cells after fludarabine treatment (right panel). (F) Cell cycle profile determined by PI staining after 48 h fludarabine treatment (7.5 µM) in PGA1 cell line. Data are represented as mean ± SD of three independent experiments.
Fig. 3
Fig. 3
Response of SAMHD1KO cells to olaparib in monotherapy and combined with bendamustine/ ibrutinib. (A) Cell viability studies by MTT assay in response to increasing doses of olaparib (0.625–20 µM) for 72 h. Percentage of live cells is expressed relative to DMSO control. Differences between PGA-1 SAMHD1WT and SAMHD1KO clones are summarized by asterisks. Data are summarized as the mean ± SD of three independent experiments. (B) Drug response to olaparib (20 µM), bendamustine (20 µM) and combination of both drugs (ratio 1:1) in PGA-1 SAMHD1WT and SAMHD1KO by measuring cell viability with MTT assay after 72 h Data are summarized as the mean ± SD of three independent experiments. (C) Dose–response curve of viable cells (%, relativized to untreated cells) after treatment with olaparib, ibrutinib and their combination at a 1:1 ratio. Data are presented as the mean ± SD of three independent experiments. Combination index (CI) was calculated using Calcusyn. (D) Determination of cytotoxicity after 48-h treatment with olaparib (7.5 µM), ibrutinib (7.5 µM) and the combination of these drugs (1:1) in PGA-1 cells by measuring the percentage of apoptotic cells (annexin V + / PI +) with annexin V/PI staining. Data are presented as the mean ± SD of three independent experiments. (E) Western blot analyses reflecting PARP cleavage as an apoptosis marker after treatment with olaparib, ibrutinib and their combination (ratio 1:1).
Fig. 4
Fig. 4
Clinical impact of SAMHD1 dysfunction in CLL patients. (A) Diagrammatic representation illustrating the distribution of SAMHD1 mutations identified in CLL patients from the local cohort (up) and those previously reported in three CLL cohorts (down),,. These variants are represented according to the amino acid change at the protein level (Transcript: ENST00000262878). Each circle represents a SAMHD1 mutation, and its color means the type of mutation (missense, nonsense or frameshift). (B) Kaplan–Meier curve of failure free survival analysis of SAMHD1 mutated (SAMHD1MUT, red line) vs SAMHD1 non-mutated (SAMHD1WT, purple line) CLL patients from the CLL-map portal. (C) Kaplan–Meier plots showing the association between SAMHD1 expression and the time to first treatment (left) and overall survival (right) in CLL from the CLL-map portal. CLL patient were grouped according to SAMHD1 expression levels: low (dark red line) and high (light purple line).

Similar articles

References

    1. Gaidano, G., Foà, R. & Dalla-Favera, R. Molecular pathogenesis of chronic lymphocytic leukemia. J. Clin. Investig.122(10), 3432–3438 (2012). - PMC - PubMed
    1. Zenz, T., Mertens, D., Küppers, R., Döhner, H. & Stilgenbauer, S. From pathogenesis to treatment of chronic lymphocytic leukaemia. Nat. Rev. Cancer10(1), 37–50 (2010). - PubMed
    1. Knisbacher, B. A. et al. Molecular map of chronic lymphocytic leukemia and its impact on outcome. Nat. Genet.54(11), 1664–1674 (2022). - PMC - PubMed
    1. Puente, X. S. et al. Non-coding recurrent mutations in chronic lymphocytic leukaemia. Nature526(7574), 519–524 (2015). - PubMed
    1. Landau, D. A. et al. Mutations driving CLL and their evolution in progression and relapse. Nature526(7574), 525–530 (2015). - PMC - PubMed

MeSH terms

Substances

LinkOut - more resources