. 2025 Mar 26;8(1):501.
doi: 10.1038/s42003-025-07933-z.

Multimodal SARS-CoV-2 interactome sketches the virus-host spatial organization

Affiliations

Multimodal SARS-CoV-2 interactome sketches the virus-host spatial organization

Guillaume Dugied et al. Commun Biol. .

Abstract

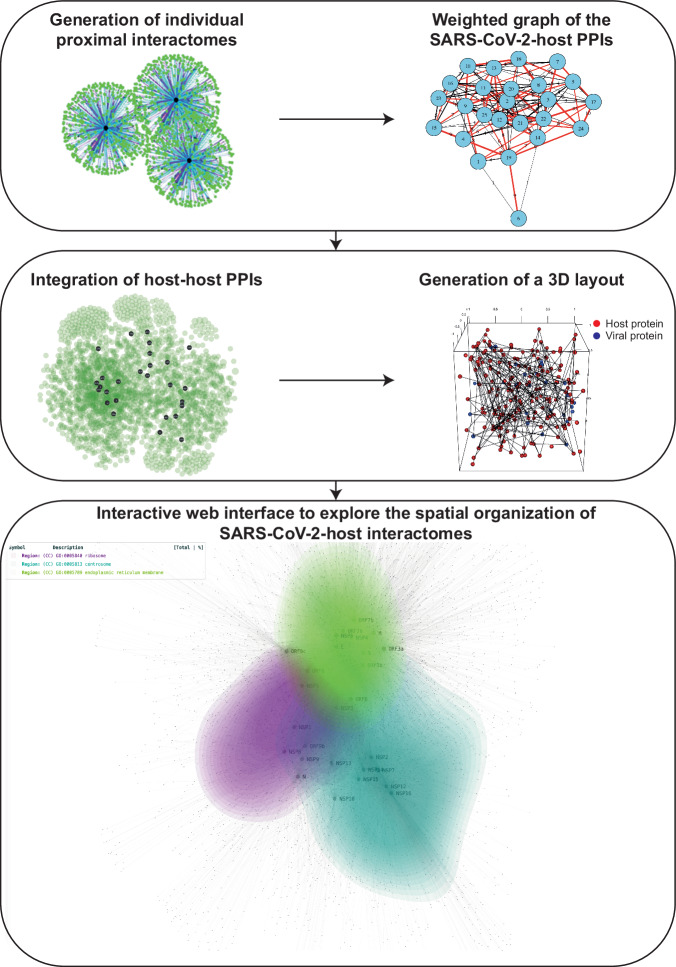
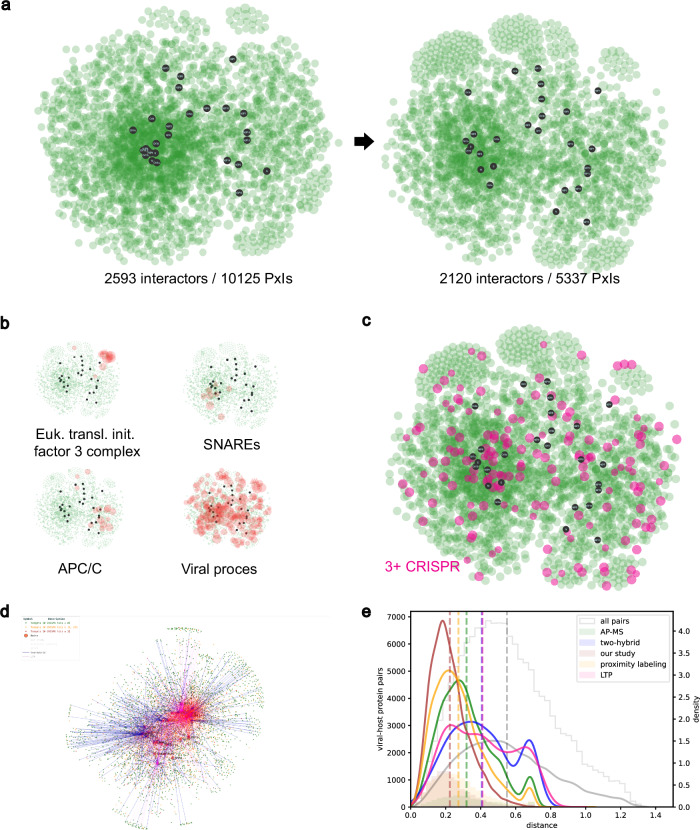
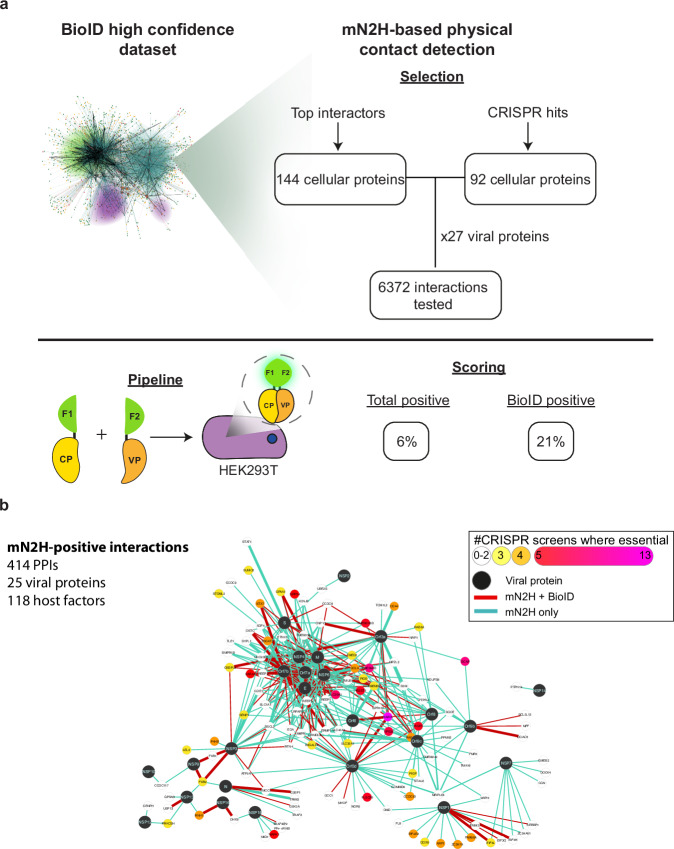
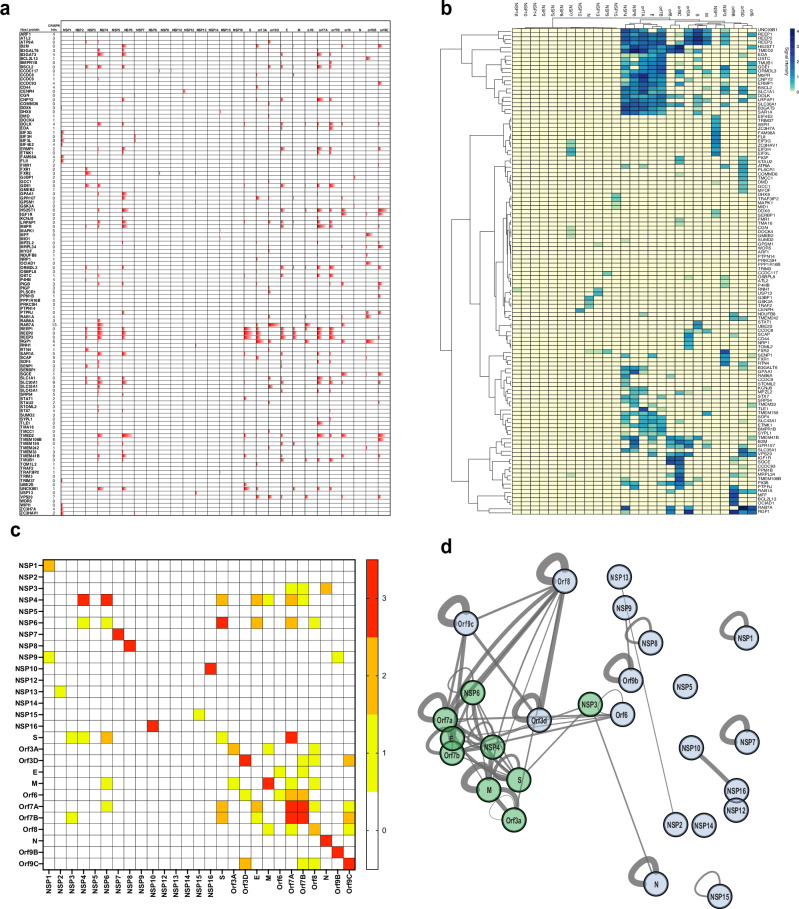
An accurate spatial representation of protein-protein interaction networks is needed to achieve a realistic and biologically relevant representation of interactomes. Here, we leveraged the spatial information included in Proximity-Dependent Biotin Identification (BioID) interactomes of SARS-CoV-2 proteins to calculate weighted distances and model the organization of the SARS-CoV-2-human interactome in three dimensions (3D) within a cell-like volume. Cell regions with viral occupancy were highlighted, along with the coordination of viral proteins exploiting the cellular machinery. Profiling physical intra-virus and virus-host contacts enabled us to demonstrate both the accuracy and the predictive value of our 3D map for direct interactions, meaning that proteins in closer proximity tend to interact physically. Several functionally important virus-host complexes were detected, and robust structural models were obtained, opening the way to structure-directed drug discovery screens. This PPI discovery pipeline approach brings us closer to a realistic spatial representation of interactomes, which, when applied to viruses or other pathogens, can provide significant information for infection. Thus, it represents a promising tool for coping with emerging infectious diseases.


Conflict of interest statement

Competing interests: The authors declare no competing interests.

Figures

Fig. 1
Fig. 1. Illustration of the computational pipeline.
The BioID virus-host proximal interactomics datasets are combined and encoded into a weighted graph data structure. This structure is augmented with previously reported host-host interactions, and a multi-stage and force-directed graph layout is used to generate 3D coordinates of all nodes. The modeled 3D map can be accessed in a web-based interactive display, with option for with filtering and customization features. Further integration with other available interactomes from a variety of study types resulting in a global comparative interactome view.
Fig. 2
Fig. 2. SARS-CoV-2-human proximal network representation.
a Global data-driven SARS-CoV-2-human proximal network projection on 2D and its relaxation upon removal of the host proteins targeted by eight or more viral baits. PxIs stands for proximal interactions. b Spatial localization of functional groups of proteins in the proximal network relative to the viral proteins (black nodes), as indicated. c Localization of human proteins essential for SARS-CoV-2 induced toxicity (3 + CRISPR hits) on the SARS-CoV-2-host 2D proximal interaction map. d Picture of the global comparative view of the SARS-CoV-2-host interactomes, highlighted in blue, red and pink are the SARS-CoV-2-host interactions identified in two-hybrid, low throughput study and our BioID study, respectively. e Histograms and densities of viral-host protein pair distances in the global 3D SARS-CoV-2-host proximal interaction map and breakdown by their origin study type.
Fig. 3
Fig. 3. mN2H orthogonal validation of a subset of high confidence interactors.
a Selection of the interactors and experimental pipeline for the mN2H validation. b Full SARS-CoV-2-human contactome network identified in this study by mN2H.
Fig. 4
Fig. 4. mN2H interaction profiling.
a The relative strength of PPIs, given by the distance of PPI to the positive threshold, is shown for host factors scoring positive with one or more viral factors. Their corresponding number of CRISPR hits is indicated (n = 4 biologically independent samples). b Hierarchical clustering of the SARS-CoV-2 proteins and human host proteins based on their mN2H interaction profiles. The heatmap represents relative PPI strength (distance to the threshold) (n = 6 biologically independent samples). c Heatmap of intraviral interactions tested in mN2H, interactions were tested in triplicate using three different complementary NanoLuc configurations. The color gives the number of N2H tagging configurations where interactions scored positive (n = 2 samples per configuration). d Network representation of intraviral interactions. The thickness of the lines represents the number of configurations (N1-N2, N1-C2, C1-C2) scoring positive in N2H. The viral proteins colored in green represent the proteins harboring a transmembrane domain, while the proteins colored gray represents the ones without a transmembrane domain.
Fig. 5
Fig. 5. Organization and validation of the BioID and mN2H networks.
a Snapshot of the 3D network depicting spatially resolved and colored regions enriched in a subset of GO categories. Merged data from the present study and the literature are graphically coded as described in the legend. b Violin plot of the viral-host distances in the 3D map according to the PPIs status, as described (Student’s t test; p-values as indicated in the figure). c Dependence of the probability of mN2H positive interactions on protein pair distance cutoff (conditioned on BioID detection status), depicted as absolute numbers and as fold change relative to total (max cutoff), for bins of approximately equal mN2H+ pair populations. d Dependence of BioID positive status precision and recall on protein pair distance cutoff for predicting mN2H positive status, for bins of approximately equal mN2H+ pair populations.
Fig. 6
Fig. 6. Structural modeling and validation of the NSP13-USP13 role in SARS-CoV-2 replication.
a Modeling of the USP13-NSP13 complex by Alphafold-Multimer and homology-based prediction (b). c Inhibition curve of SARS-CoV-2 infection in the presence of Spautin-1, using the nanoluciferase complementation assay. Briefly, a co-culture of Vero E6-NanoLg and Vero E6-NanoSm, plated at equal density the day before infection, was infected at a MOI of 0.01 with the Wuhan strain of SARS-CoV-2. Increasing concentrations of Spautin-1 (red) and GC376 (blue) were added at the time of infection. Luciferase was measured 24 h post-infection as a read-out of infection-induced syncytia formation (n = 4 biologically independent samples).

References

    1. Gonzalez, M. W. & Kann, M. G. Chapter 4: Protein interactions and disease. PLoS Comput. Biol.8, e1002819 (2012). - PMC - PubMed
    1. Jones, S. & Thornton, J.M. Principles of protein-protein interactions. Proc. Natl Acad. Sci. USA93, 13–20 (1996). - PMC - PubMed
    1. Sowmya, G., Breen, E. J. & Ranganathan, S. Linking structural features of protein complexes and biological function. Protein Sci.24, 1486–1494 (2015). - PMC - PubMed
    1. Drewes, G. & Bantscheff, M. Chemical Proteomics: Methods and Protocols (Humana Press, 2011).
    1. Link, A. J. et al. Targeted Identification of Protein Interactions in Eukaryotic mRNA Translation. Proteomics20, e1900177 (2020). - PubMed