

The impact of building uses on microplastic pollution and its implications for environmental education
- PMID: 40140557
- PMCID: PMC11947094
- DOI: 10.1038/s41598-025-94976-1
The impact of building uses on microplastic pollution and its implications for environmental education
Abstract
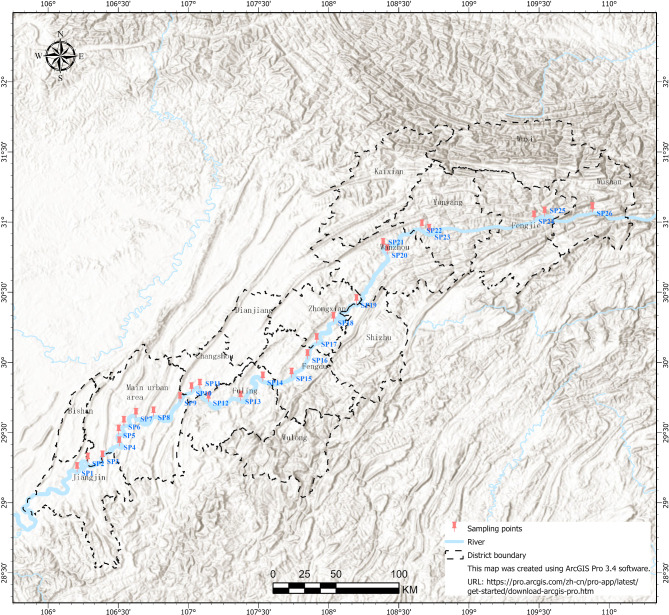
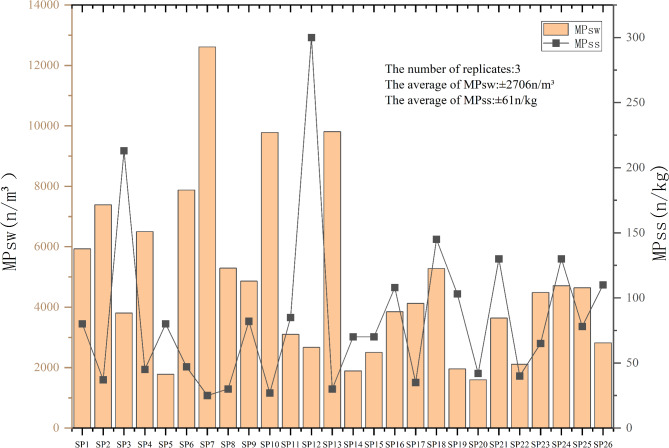
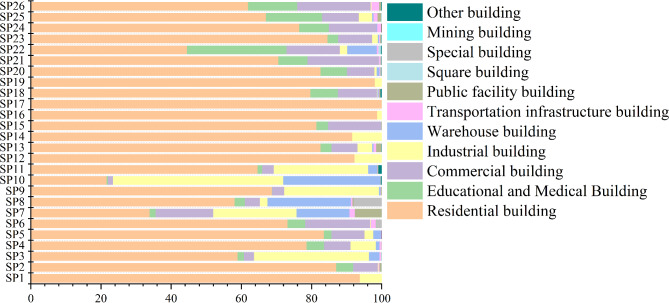
Rivers are major sources of marine microplastics. To investigate the influence of building use on river microplastic pollution, this study focused on the Chongqing section of the main stream of the Yangtze River. Surface water and sediment microplastic samples were collected and analyzed alongside building use data to explore the relationship between microplastic abundance and building use at different spatial scales. The results showed that: (1) The abundance of microplastics in surface water and sediment in the Chongqing section of the Yangtze River exhibited an inverse distribution pattern. In the upper reaches, the central urban area of Chongqing showed significantly higher microplastic levels in surface water (6,811 ± 3,101 n/m ³) compared to the lower reaches, confirming the direct input effect of high-intensity human activities. The accumulation of microplastics in sediment was greater in the northeastern section of Chongqing compared to the lower reaches (89.6 ± 69 vs. 45.4 ± 28 n/kg), indicating a hydrodynamic-driven sedimentation lag effect. (2) The influence of building use on microplastic abundance in surface water was significantly scale-dependent. Industrial buildings within a 2 km buffer zone explained up to 61.16% of the observed variance, suggesting cross-medium migration through atmospheric sedimentation and sewage pipe network. (3) Compared to land use types, building uses dominate the abundance distribution of microplastics in surface water at larger buffer radius (1-2 km), indicating that high-intensity human activities have a greater impact on spatial differentiation of microplastic pollution. It is recommended to implement hierarchical control measures along the Chongqing section of the Yangtze River. A 2-km ecological buffer zone is set up in industrial agglomeration areas to strictly supervise wastewater discharge from plastic products enterprises. Rainwater bioretention facilities are built within 1 km of densely populated areas to intercept microplastics from domestic sources, such as laundry fibers. This study explores the mechanism by which building use affects river microplastic pollution, providing valuable insights for microplastics control in large river basins worldwide.
Keywords: Building use; Education; Microplastics; Redundance analysis; Yangtze river.
© 2025. The Author(s).
Conflict of interest statement
Declarations. Competing interests: The authors declare no competing interests.
Figures


Similar articles
-
Microplastic pollution in the Yangtze River Basin: Heterogeneity of abundances and characteristics in different environments.Environ Pollut. 2021 Oct 15;287:117580. doi: 10.1016/j.envpol.2021.117580. Epub 2021 Jun 14. Environ Pollut. 2021. PMID: 34147783
-
Distribution of microplastics in surface water and sediments of Qin river in Beibu Gulf, China.Sci Total Environ. 2020 Mar 15;708:135176. doi: 10.1016/j.scitotenv.2019.135176. Epub 2019 Nov 20. Sci Total Environ. 2020. PMID: 31791789
-
Microplastics in inland freshwater environments with different regional functions: A case study on the Chengdu Plain.Sci Total Environ. 2021 Oct 1;789:147938. doi: 10.1016/j.scitotenv.2021.147938. Epub 2021 May 23. Sci Total Environ. 2021. PMID: 34058585
-
How microplastic loads relate to natural conditions and anthropogenic activities in the Yangtze river basin.Chemosphere. 2023 Nov;342:140146. doi: 10.1016/j.chemosphere.2023.140146. Epub 2023 Sep 11. Chemosphere. 2023. PMID: 37704083
-
Characteristics and source-pathway of microplastics in freshwater system of China: A review.Chemosphere. 2022 Jun;297:134192. doi: 10.1016/j.chemosphere.2022.134192. Epub 2022 Mar 4. Chemosphere. 2022. PMID: 35257703 Review.
References
-
- Agarwal, S. Biodegradable polymers: present opportunities and challenges in providing a Microplastic-Free environment. Macromol. Chem. Phys.22110.1002/macp.202000017 (2020).
-
- Jing Cui, H. T. et al. Impact of microplastic residues from polyurethane films on crop growth: unraveling insights through transcriptomics and metabolomics analysis. Ecotoxicol. Environ. Saf.283, 116826. 10.1016/j.ecoenv.2024.116826 (2024). - PubMed
-
- Hongyu Tian, Y. D. et al. Understanding visible light and microbe-driven degradation mechanisms of polyurethane plastics: pathways, property changes, and product analysis. Water Res.258, 121856. 10.1016/j.watres.2024.121856 (2024). - PubMed
Grants and funding
LinkOut - more resources
Full Text Sources
