. 2025 Jul;32(7):1259-1272.
doi: 10.1038/s41418-025-01479-7. Epub 2025 Mar 27.

The histone modifier KAT2A presents a selective target in a subset of well-differentiated microsatellite-stable colorectal cancers

Affiliations

The histone modifier KAT2A presents a selective target in a subset of well-differentiated microsatellite-stable colorectal cancers

Vida Kufrin et al. Cell Death Differ. 2025 Jul.

Abstract

Lysine acetyltransferase 2 A (KAT2A) plays a pivotal role in epigenetic gene regulation across various types of cancer. In colorectal cancer (CRC), increased KAT2A expression is associated with a more aggressive phenotype. Our study aims to elucidate the molecular underpinnings of KAT2A dependency in CRC and assess the consequences of KAT2A depletion. We conducted a comprehensive analysis by integrating CRISPR-Cas9 screening data with genomics, transcriptomics, and global acetylation patterns in CRC cell lines to pinpoint molecular markers indicative of KAT2A dependency. Additionally, we characterized the phenotypic effect of a CRISPR-interference-mediated KAT2A knockdown in CRC cell lines and patient-derived 3D spheroid cultures. Moreover, we assessed the effect of KAT2A depletion within a patient-derived xenograft mouse model in vivo. Our findings reveal that KAT2A dependency is closely associated with microsatellite stability, lower mutational burden, and increased molecular differentiation signatures in CRC, independent of the KAT2A expression levels. KAT2A-dependent CRC cells display higher gene expression levels and enriched H3K27ac marks at gene loci linked to enterocytic differentiation. Furthermore, loss of KAT2A leads to decreased cell growth and viability in vitro and in vivo, downregulation of proliferation- and stem cell-associated genes, and induction of differentiation markers. Altogether, our data show that a specific subset of CRCs with a more differentiated phenotype relies on KAT2A. For these CRC cases, KAT2A might represent a promising novel therapeutic target.


Conflict of interest statement

Competing interests: The authors declare no conflict of interest.

Figures
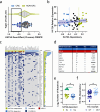
Fig. 1
Fig. 1. KAT2A dependency in CRC cell lines does not correlate with KAT2A expression but is linked to a lower mutational burden.
a Violin plot of KAT2A dependency scores from the DepMap data set. In blue are all colorectal cancer cell lines (n = 57). In green are all other included cancer cell lines (n = 1078). The dashed line indicates the median for each, and the quartiles are shown as dotted lines. The KAT2A dependent CRC lines are indicated in dark blue. b Correlation of KAT2A expression (y-axis) and KAT2A dependency scores (x-axis) in all CRC cell lines. They were stratified into KAT2A dependent (blue), intermediate (black), and KAT2A independent (green) cell lines. c Oncoplot illustrating mutational pattern of KAT2A independent (green, n = 18) and KAT2A dependent (blue, n = 12) CRC cell lines. Light blue indicates 1 mutation, dark blue >1 mutations per gene (d) Table overview of the distribution of most frequent gene mutations and microsatellite-instability (MSI) status between the two groups. e Total number of mutations between the two groups, and (f) KAT2A dependency between TTN-wild-type (WT, n = 33) and TTN-mutant (n = 24) CRCs. *p < 0.05 two-tailed Mann–Whitney U test.
Fig. 2
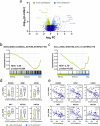
Fig. 2. KAT2A-dependent CRC cell lines express differentiation-associated genes.
a Volcano plot analysis of differentially expressed genes between KAT2A independent (green) and dependent (blue) CRC cell lines. Strongest hits are highlighted. b, c Gene set enrichment analysis (GSEA) indicating positive enrichment for gene signatures related to mature enterocytes in KAT2A-dependent CRC cell lines. d Differential expression of colon differentiation marker genes DDX60, EDN1, HPGD, IRF7, KRT23, and KRT20 between the KAT2A independent (green) and dependent (blue) groups. *p < 0.05; **p < 0.01, two-tailed Student’s t-test. e Correlation of relative gene expression of indicated differentiation markers (y-axis) and KAT2A dependency scores (x-axis) in all CRC cell lines. The Pearson correlation coefficients r and the p-values are shown.
Fig. 3
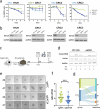
Fig. 3. CRISPRi-based knockdown of KAT2A reduces CRC tumor progression.
a Dependency on KAT2A was validated using a flow cytometry-based competition assay in the MSS CRC cell line HT29 and in three patient-derived 3D spheroid models (MSI-H CRC1 and MSS CRC2/CRC3) with two constitutive CRISPRi sgRNAs. A non-targeting control (NTC) sgRNA served as a negative control. BFP was used as a marker for sgRNA-expressing cells. *p < 0.05; **p < 0.01; ***p < 0.001, two-tailed Student’s t-test. b The efficacy of sgRNA-based knockdown was assessed by western blot. c Experimental workflow to study the effect of a dox-inducible knockdown of KAT2A in already-formed tumor spheroids. Singularized CRC3-dox-dCas9-KRAB cells were cultured in single wells of a 384-well plate until visible 3D structures formed. Subsequently, doxycycline was added to induce the knockdown of KAT2A. Spheroid size was assessed by microscopy at four (d4) and seven days (d7) post-doxycycline supplementation. d Efficacy of doxycycline-induced dCas9-KRAB induction and the associated reduction of KAT2A was assessed by western blot. e Representative images of d4 and d7 spheroids from the NTC-transduced CRC3 spheroids (top) and the KAT2A sgRNA-transduced CRC3 spheroids (bottom). Scale bar = 100 µm. f Summary of the calculated size ratios (d7/d4) in the NTC control and KAT2A knockdown from all included single spheroids. *** p < 0.001, two-tailed Mann–Whitney U test. g Sankey plot summarizes the response of each spheroid from the NTC and sgRNA KAT2A groups. Individual spheroids were categorized into four response groups: progressive disease (PD), if the size at day 7 (d7) was ≥1.5-fold larger compared to day 4 (d4); stable disease (SD), if d7 was between 1- and 1.5-fold larger compared to d4; partial remission (PR), if d7 was smaller than d4; and complete remission (CR), if the spheroid completely disappeared.
Fig. 4
Fig. 4. A CRISPRi-based knockdown of KAT2A reduces proliferation and stemness, and induces expression of differentiation markers.
a Quantitative transcriptomics by RNA sequencing are shown as volcano plot and highlight differentially expressed genes between KAT2A-knockdown (green) and NTC control (blue) in the MSI-H patient-derived CRC1 model. b GSEA results of most significantly upregulated or downregulated signatures in CRC1 cells after KAT2A knockdown. c Quantitative transcriptomics by RNA sequencing are shown as volcano plot and highlight differentially expressed genes between KAT2A-knockdown (green) and NTC control (blue) in the MSS patient-derived CRC2 model. d GSEA results of most significantly upregulated or downregulated signatures in CRC2 cells after KAT2A knockdown. e Quantitative transcriptomics by RNA sequencing are shown as volcano plot and highlight differentially expressed genes between KAT2A-knockdown (green) and NTC control (blue) in the MSS patient-derived CRC3 model. f GSEA results of most significantly upregulated or downregulated signatures in CRC3 cells after KAT2A knockdown. g Gene expression overview of differentiation markers KRT23, KRT20, DDX60, IRF7, VIL1 and CDX2 in all three models. Data were obtained from the RNA-sequencing approach. h Gene expression overview of stem cell markers LGR5, SOX2, EPHB2, CD166, and proliferation markers MKI67, E2F1 and MYBL2 in all three models. Data were obtained from the RNA-sequencing approach. *p < 0.05; **p < 0.01; ***p < 0.001, two-tailed Student’s t-test.
Fig. 5
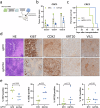
Fig. 5. Loss of KAT2A markedly decreases tumor formation in vivo.
a Schematic representation of in vivo validation of KAT2A functional role. CRC3-dCas9-KRAB and GFP expressing patient-derived spheroids, stably expressing either KAT2A-targeting or NTC sgRNA, were transplanted subcutaneously into immunodeficient NSG mice to generate xenografts (n = 5 per group). b Growth rate of tumors measured at defined time points. *p < 0.05; **p < 0.01, two-tailed Student’s t-test. c Kaplan–Meier survival analysis as mean of the time until the tumors reached the final defined tumor size. p-value was determined by Log-rank test. d Representative images of hematoxylin-eosin (HE) and immunohistochemistry (IHC) staining for proliferation marker KI67, and differentiation markers CDX2, KRT20, and VIL1 from the final tumors from the NTC and sgRNA-KAT2A group. Scale bar = 100 µm. e Summary of the calculated percentage of positive cells for each staining from all tumors. p-values were determined by two-tailed Mann–Whitney U test.
Fig. 6
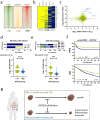
Fig. 6. Differentiation-associated genes serve as biomarkers for KAT2A dependency.
a Average line plot of mean H3K27ac read density close to transcriptional start sites (TSS) in KAT2A dependent HT29 and KAT2A independent COLO320 cells. Dark lines indicate stronger signals, and red plot represents the ratio merge between HT29 versus COLO320 cells. b Heatmap of overlapping hit genes with strong H3K27ac signals in KAT2A dependent HCT116 and HT29 cells versus KAT2A independent LOVO, COLO320, and HCT15 cells. c Scatter plot of differentially expressed genes between KAT2A dependent versus KAT2A independent CRC cell lines (y-axis) and the differentially acetylated gene loci at H3K27 in HT29 versus the KAT2A independent CRC cell lines LOVO, COLO320, and HCT15 (x-axis). KRT23, IFI27, KRT20, PI3, and POF1B are highlighted. d CRC patients from the Clinical Proteomic Tumor Analysis Consortium trial (CPTAC-2, Vasaikar et al.) were stratified according to their median KRT23 expression into two groups (low versus high, n = 53 per group). MSI-H is only present in the low-KRT23 expressing group, and this group associates with a significantly higher mutation count compared to the high-KRT23 group. ***p < 0.001, two-tailed Mann–Whitney U test. e CRC patients from the Sidra-LUMC AC-ICAM trial (Roelands et al.) were stratified into two groups based on median KRT23 expression (low versus high, n = 174 per group). KRT23-high CRC patients are predominantly classified within the CMS2 and CMS4 subtypes, with no representation in the CMS1 subtype. This classification is reflected in the mutational burden, which is significantly higher in the KRT23-low group. *** p < 0.001, two-tailed Mann–Whitney U test. f Non-CMS1 CRC patients from the Sidra-LUMC AC-ICAM trial were divided based on median KRT23 expression (low versus high, n = 153 per group). High KRT23 expression is associated with shorter progression-free survival (PFS; p = 0.01) and shorter overall survival (OS; p = 0.02). p-values were calculated using the log-rank test. g A schematic model illustrating the major findings of this study. We demonstrate that a subset of MSS, more-differentiated CRC subtypes, depends on KAT2A, whereas KAT2A is not essential in MSI-H CRCs.

References

    1. Sung H, Ferlay J, Siegel RL, Laversanne M, Soerjomataram I, Jemal A, et al. Global Cancer Statistics 2020: GLOBOCAN estimates of incidence and mortality worldwide for 36 cancers in 185 countries. CA Cancer J Clin. 2021;71:209–49. - PubMed
    1. Malone ER, Oliva M, Sabatini PJB, Stockley TL, Siu LL. Molecular profiling for precision cancer therapies. Genome Med. 2020;12:8. - PMC - PubMed
    1. Dieter SM, Siegl C, Codó PL, Huerta M, Ostermann-Parucha AL, Schulz E, et al. Degradation of CCNK/CDK12 is a druggable vulnerability of colorectal cancer. Cell Rep. 2021;36:109394. - PubMed
    1. Weichert W, Röske A, Gekeler V, Beckers T, Ebert MP, Pross M, et al. Association of patterns of class I histone deacetylase expression with patient prognosis in gastric cancer: a retrospective analysis. Lancet Oncol. 2008;9:139–48. - PubMed
    1. Xu Y, Liao W, Luo Q, Yang D, Pan M. Histone acetylation regulator-mediated acetylation patterns define tumor malignant pathways and tumor microenvironment in hepatocellular carcinoma. Front Immunol. 2022;13:761046. - PMC - PubMed

LinkOut - more resources