. 2025 Apr;640(8058):506-513.
doi: 10.1038/s41586-025-08651-6. Epub 2025 Mar 26.

A small-molecule SARS-CoV-2 inhibitor targeting the membrane protein

Affiliations

A small-molecule SARS-CoV-2 inhibitor targeting the membrane protein

Ellen Van Damme et al. Nature. 2025 Apr.

Abstract

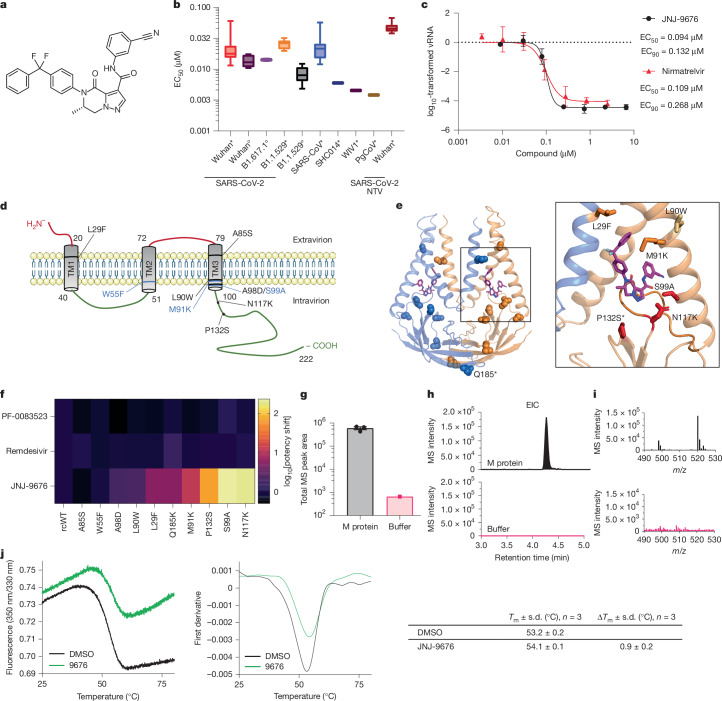
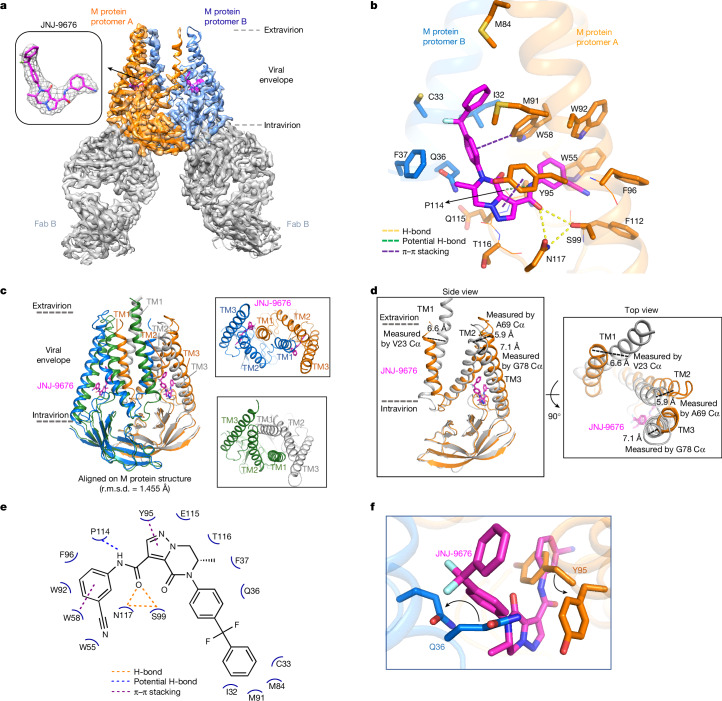
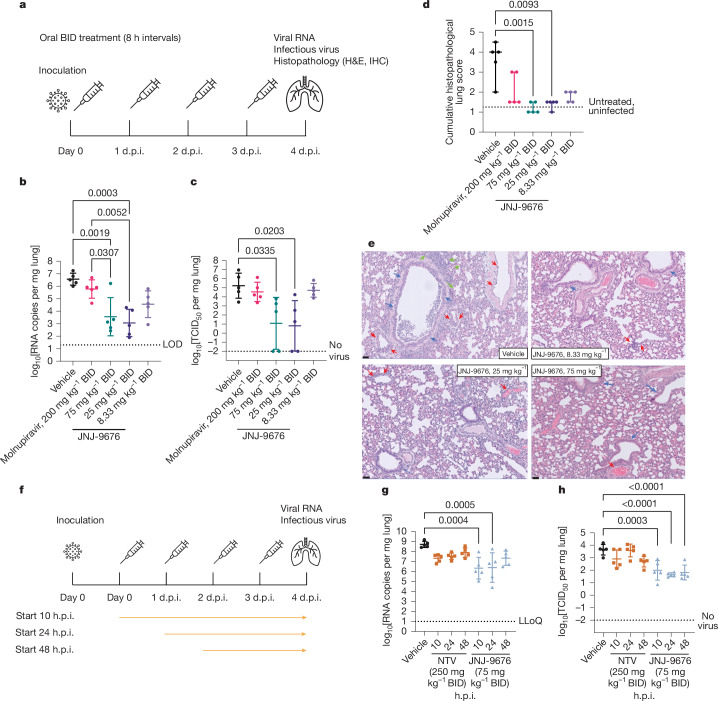
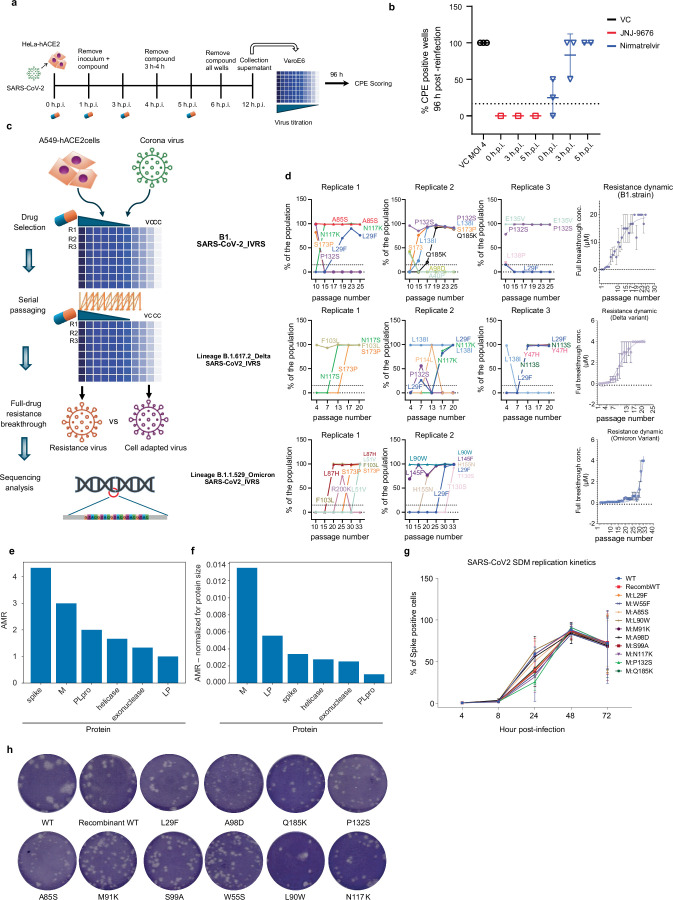
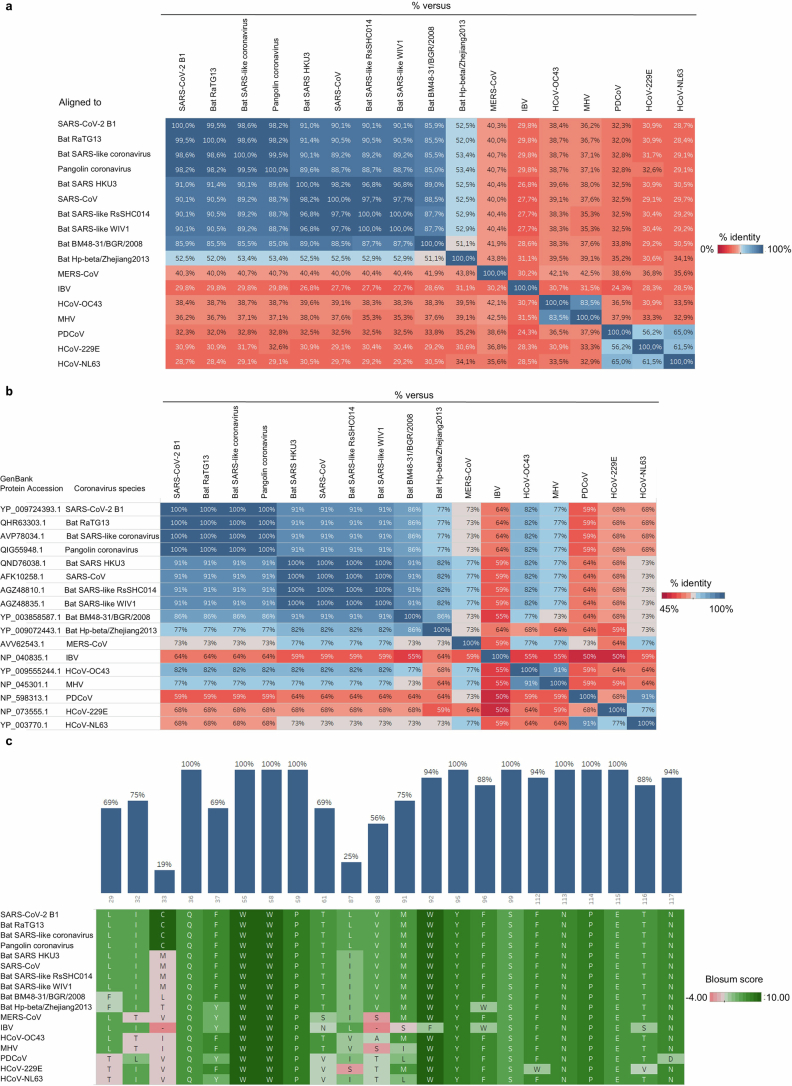
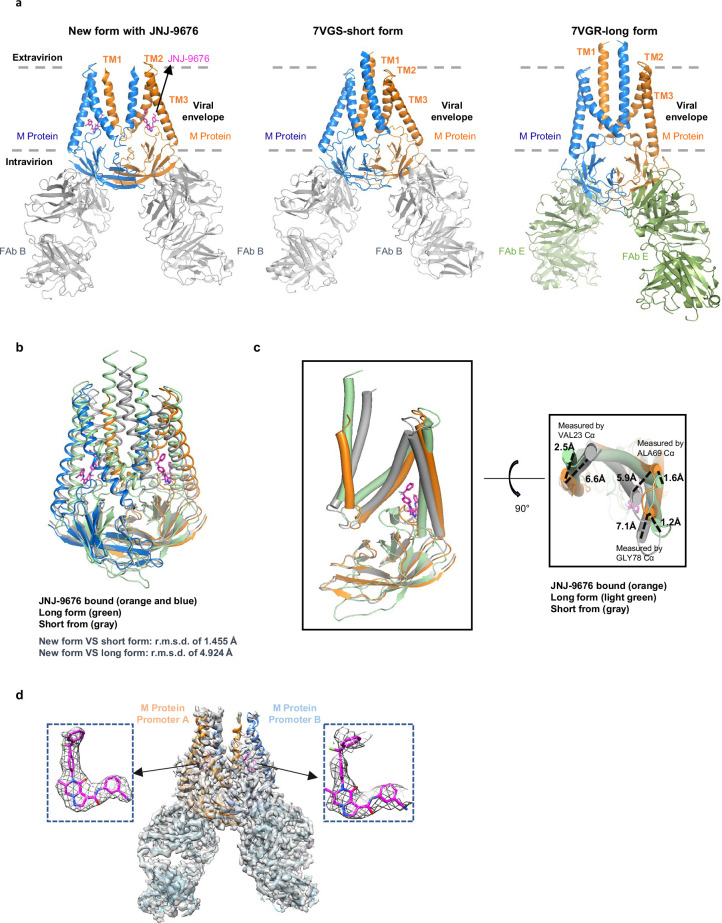
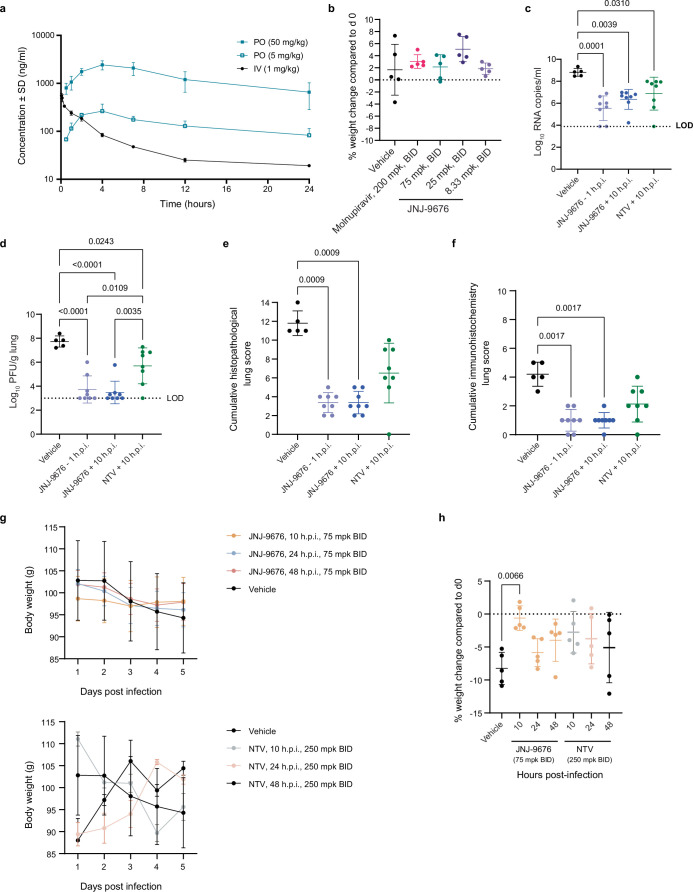
The membrane (M) protein of betacoronaviruses is well conserved and has a key role in viral assembly1,2. Here we describe the identification of JNJ-9676, a small-molecule inhibitor targeting the coronavirus M protein. JNJ-9676 demonstrates in vitro nanomolar antiviral activity against SARS-CoV-2, SARS-CoV and sarbecovirus strains from bat and pangolin zoonotic origin. Using cryogenic electron microscopy (cryo-EM), we determined a binding pocket of JNJ-9676 formed by the transmembrane domains of the M protein dimer. Compound binding stabilized the M protein dimer in an altered conformational state between its long and short forms, preventing the release of infectious virus. In a pre-exposure Syrian golden hamster model, JNJ-9676 (25 mg per kg twice per day) showed excellent efficacy, illustrated by a significant reduction in viral load and infectious virus in the lung by 3.5 and 4 log10-transformed RNA copies and 50% tissue culture infective dose (TCID50) per mg lung, respectively. Histopathology scores at this dose were reduced to the baseline. In a post-exposure hamster model, JNJ-9676 was efficacious at 75 mg per kg twice per day even when added at 48 h after infection, when peak viral loads were observed. The M protein is an attractive antiviral target to block coronavirus replication, and JNJ-9676 represents an interesting chemical series towards identifying clinical candidates addressing the current and future coronavirus pandemics.


Conflict of interest statement

Competing interests: M.V.L., E.V.D., M.V.G. and C.B. are named as inventors on a pending patent application claiming inhibitors of coronavirus (WO 2024/008909), which was filed by the Applicant Janssen Pharmaceutica. M.V.L., E.V.D., J.X., S.J., L.G., J.D., M.V.G., R.D.-A., A.D., S. Marsili, S. Miller, C.V.d.E., A.D.R., P.V., K.T., D.P. and C.B. were/are employees of Janssen Pharmaceutica and may possess stocks of Johnson & Johnson. S. Miller is an employee of Spark Therapeutics and may possess stocks of Roche. N.V.d.B., L.T., V.R. and I.D.P. are employees of Charles River Laboratories, a contract research organization and may possess stocks of Johnson & Johnson. M.S. is an employee of Gilead Sciences and may possess stocks of Gilead Sciences. A.A.L., H.L.M.d.G., E.J.S. and M.J.v.H. received funding from Janssen Pharmaceutica to perform contract research. M.D.T., M.Z. and F.J.M.v.K. received funding from Janssen Pharmaceutica to perform contract research. The other authors declare no competing interests.

Figures

Fig. 1
Fig. 1. JNJ-9676 targets the M protein.
a, The structure of JNJ-9676, (S)-N-(3-cyanophenyl)-5-(4-(difluoro(phenyl)methyl)phenyl)-6-methyl-4-oxo-4,5,6,7-tetrahydropyrazolo[1,5-a]pyrazine-3-carboxamide. b, The mean EC50 values of JNJ-9676 against sarbecoviruses (SARS-CoV-2 B1 strain, n = 21 (A549-hACE2 cells), n = 6 (VeroE6-eGFP cells); SARS-CoV-2 B1.617.1, n = 2 (VeroE6-eGFP cells); SARS-CoV-2 B1.1.529, n = 12 (A549-hACE2 cells), n = 11 (VeroE6-eGFP cells); SARS-CoV, n = 12 (A549-hACE2 cells); SHC014, n = 1 (A549-hACE2 cells); WIV1, n = 1 (A549-hACE2 cells); and Pg-CoV Guangdong, n = 1 (A549-hACE2 cells)) assessed in A549-hACE2 cells (asterisks) or VeroE6-eGFP cells (circles). The EC50 for nirmatrelvir in SARS-CoV-2-infected A549-hACE2 cells is also shown. The box plots show the 25th–75th percentile (box limits), median (centre line) and the whiskers show the spread between minimum and maximum values. All replicates listed are biological replicates. c, The effect of JNJ-9676 and nirmatrelvir on RNA copy numbers in nasal epithelial cultures infected with SARS-CoV-2 (48 h.p.i., apical). n = 3, biological replicates. Data are mean ± s.d. d, The transmembrane structure of the SARS-CoV-2 M protein. IVRS mutation residues (black), important residues in the cryo-EM structure (blue), the intravirion domain (green), the extravirion domain (red) and transmembrane domains (grey) are indicated. e, The M protein structure annotated with mutations identified in IVRS. Left, mutations identified in more than 2 IVRS samples. Right, mutations in the binding site. The asterisks indicate mutations potentially altering the equilibrium between the long and short forms of the dimer. f, The mean EC50 fold changes in drug resistance potency of site-directed mutants (SDMs). n = 3, biological replicates. g, ASMS evaluation of M protein with compound (black) and buffer control with breakthrough (pink). n = 3 technical replicates. Data are mean ± s.e.m. h, M-protein-enriched extracted ion chromatogram (EIC) with a 3 ppm mass error tolerance window and the corresponding MS spectrum at the M protein EIC peak apex (inset). i, Buffer control EIC with a 3 ppm mass error tolerance window with the corresponding MS spectrum at the M protein EIC peak apex (inset). j, NanoDSF melting profile with the fluorescence ratio (350 nm/320 nm) and the first derivative plotted against temperature; the table indicates technical replicates (n = 3).
Fig. 2
Fig. 2. Cryo-EM insights into the JNJ-9676-binding environment.
a, Cryo-EM map of the M protein dimer–FabB complex with JNJ-9676 composed of M protein protomers A (orange), B (blue) and FabB (grey) with JNJ-9676 (inset, magenta sticks) depicted as a density map (grey mesh). The faces of the viral envelope are indicated by dashed lines. b, The JNJ-9676-binding pocket on protomer A, with chains shown as a cartoon ribbon, and the interacting residues (within 4 Å), side chain and main chain shown as sticks and a line. Key interactions are indicated by dashed lines (hydrogen (H) bonding, yellow; π–π stacking, purple). c, Superimposed structural comparison of the M protein dimer in the absence (short-form, grey/green; PDB: 7VGS) and the presence of JNJ-9676 (orange/blue). Alignment achieved using the whole M protein dimer structure. d, Protomer A comparison: JNJ-9676-bound versus JNJ-9676-unbound M protein (short form). e, Two-dimensional (2D) interaction patterns of JNJ-9676 and M protein depicted by dashed lines. f, The ligand-binding pocket structural comparison using protomer A: JNJ-9676-bound versus JNJ-9676-unbound (apo) M protein (short form). Y95 and Q36 side chains both shift to accommodate JNJ-9676 for an induced fit. Residue shifts are indicated by curved arrows.
Fig. 3
Fig. 3. In vivo antiviral activity of JNJ-9676 against SARS-CoV-2.
a, Schematic of a pre-exposure Syrian golden hamster experiment (data are shown in be). b,c, Individual datapoints per treatment group. n = 5 animals per group. Data are mean ± s.d. The mean differences between groups are calculated using one-way analysis of variance with Šídák’s multiple-comparison correction. b, The viral load in the indicated lung. The dotted line represents the lower limit of detection (LOD). c, Infectious virus in the lung. The dotted line represents the lower limit of quantification (LLoQ). d, The cumulative histopathology score. n = 5 animals per group. Individual datapoints per treatment group represent the median with the 95% confidence intervals. The dotted line represents a median lung score of 1.25 in healthy, untreated, non-infected animals. The differences between groups were calculated using the nonparametric Kruskal–Wallis tests with Benjamini–Hochberg false-discovery-rate multiple-comparison correction. e, Haematoxylin and eosin (H&E) staining of left lung lobe. Top left, the focal area of bronchopneumonia (green arrows), perivascular (red arrows) and peribronchial inflammation (blue arrows). Bottom left, no bronchopneumonia. Limited perivascular (red arrows) inflammation is indicated. Top right, no bronchopneumonia. Limited but significant perivascular (red arrows) inflammation and normal bronchi (blue arrows) are indicated. Bottom right, no bronchopneumonia. Normal bronchial (blue arrows) and vascular (red arrows) structures are indicated. f, Schematic of a therapeutic Syrian golden hamster experiment. g,h, Individual data points per treatment group. n = 5 per group. Data are mean ± s.d. The mean differences between groups were calculated as in b and c. The viral load (g) and infectious virus (h) in the lung is shown. IHC, immunohistochemistry. The doses reflect the amount of compound given for each administration. Source Data
Extended Data Fig. 1
Extended Data Fig. 1. Time-of-addition (TOA) and in vitro resistance selection experiments with JNJ-9676.
a, Representation of ToA study with CPE scoring as a readout showing the presence of infectious progeny after compound treatment. b, ToA assay with 5 µM JNJ-9676 (n = 1) and nirmatrelvir (n = 2 for 5 h.p.i. and n = 3 for 0 and 3 h.p.i., error bars representing the standard deviation) reading out infectious virus. The dotted horizontal line represents the reinfection with supernatant directly collected after washing away the virus input at 1 h.p.i. (n = 3). c, Schematic representation of the IVRS procedure. d, Whole genome sequencing was utilized to investigate the emergence of mutations in various SARS-CoV-2 lineages/variants under selection of JNJ-9676 (n = 3 for B1 and B.1.617.2 lineages and n = 2 for the omicron lineage; error bars showing error of the mean). Each coloured line represents the appearance dynamics of a specific mutation during virus passaging in the presence of JNJ-9676, with the mutation colour-coded accordingly. Sequencing was conducted on SARS-CoV-2 variants collected at intervals of every 2nd to 6th passage and at the end of the experiment. The experiment involved two passages per week. The dotted line on the graph represents the 15% threshold for variant detection compared to the WT in the virus population. The resistance dynamics for each viral strain was plotted. e, The average number of IVRS mutations per replicate (AMR) was defined. Proteins with an AMR ≥ 1 were considered potential targets. f, AMR values normalized for protein size. g, Effect of resistance mutations on replication fitness (n = 3 with 8 technical replicates per experiment, error bars showing the standard deviation). h, Plaque assay showing representative images (n = 3, independent experiments) of plaque sizes from the site directed mutants in g. ToA, time-of-addition; CPE, cytopathic effect; h.p.i., hours post-infection; IVRS, in vitro resistance selection; WT, wild-type; AMR, average number of IVRS mutations per replicate.
Extended Data Fig. 2
Extended Data Fig. 2. Characterization of JNJ-9676 binding to the M protein.
a, Representative M protein-enriched extracted ion chromatogram (EIC) with 3 ppm mass error tolerance window. b, Corresponding MS spectrum at M protein EIC peak apex. c, Buffer control EIC with 3 ppm mass error tolerance window. d, Corresponding MS spectrum at M protein EIC peak apex. e, Compound QC LCMS EIC with 3 ppm mass error tolerance window. f, Corresponding MS spectrum at compound QC LCMS EIC peak apex. g, SDS-PAGE of purified proteins. h, Offline ASMS recovery of 5 µM JNJ-9676 with 5 µM M-protein only, Fab-E only, Fab-B only, and Fab-B/Fab-E/M protein complex alongside buffer control with negligible breakthrough (n = 4 technical replicates, error bars indicate standard error of the mean). i, Analytical size exclusion chromatography of SARS-CoV-2 M, Fab-B and SARS-CoV-2 M/Fab-B complex. EIC, extracted ion chromatogram; ppm, part per million; MS, mass spectrometry; QC, quality control; LCMS, liquid chromatography–mass spectrometry; MM, molecular weight marker (kDa).
Extended Data Fig. 3
Extended Data Fig. 3. Sequence conservation of the M protein and its binding pocket.
a, M protein sequence conservation across coronaviruses based on genomic sequence alignment. The B1 strain of SARS-CoV-2 genomic sequence of the M protein was aligned with corresponding sequences from viruses from the zoonotic reservoir from the sarbecovirus subfamily, Middle East respiratory syndrome virus (MERS-CoV), infectious bronchitis virus, HCoV-OC43, murine hepatitis virus, porcine epidemic diarrhoea virus, HCoV-229E, and HCoV-NL63. b, M protein sequence conservation of the binding pocket based on genomic sequence alignment. Sequence identity of the B1 strain of SARS-CoV-2 to sequences in the sarbecovirus family is > 90% for positions corresponding to the binding pocket of JNJ-9676. c, The M protein amino acid sequence in the binding pocket based on cryo-EM data was compared between the different viruses listed above based on the average Blosum score. To further assess the binding pocket conservation in sarbecoviruses, we downloaded the protein sequences classified into the sarbecovirus family (206 sequences, downloaded 25 June 2024) from the InterPro database. InterPro entry: IPR044361, M matrix/glycoprotein, SARS-CoV-like). Conservation analysis shows that 20 out of the 22 residues in the binding pocket of JNJ-9676 are completely conserved in proteins from the sarbecovirus family. The non-conserved positions correspond to SARS-CoV-2 residues C33 and I87.
Extended Data Fig. 4
Extended Data Fig. 4. Three M protein dimer conformations.
a, Cryo-EM ribbon models: JNJ-9676 bound (new conformation) and unbound M/Fab-B complexes (short-form, PDB access code 7VGS), M/Fab-E (long-form, PDB access code 7VGR). b, Structural comparison by superimposition of the short-form (grey), the JNJ-9676 bound form (orange and blue), and the long-form (light green). Alignments based on all Cα atoms in the full M dimer structure. c, Structural comparison of protomer A by superimposition of the JNJ-9676 bound M protein, the unbound M protein (short-form), and the unbound long-form indicated in orange, grey, and light green, respectively. d, Cryo-EM map and model of the M protein dimer/Fab-B complex with JNJ-9676, featuring insets that shows JNJ-9676 density in individual protomer A and protomer B. The density map in the inset is displayed at a 0.145 threshold. Protomer A is coloured orange, protomer B is coloured blue, and JNJ-9676 is coloured magenta.
Extended Data Fig. 5
Extended Data Fig. 5. JNJ-9676 and reference compounds as pre- or post-exposure treatment in Syrian golden hamsters infected with SARS-CoV-2 B1.
a, Single-dose pharmacokinetic profiles of JNJ-9676 in Syrian golden hamster. Mean ± standard deviations (n = 3 animals/group). b, Pre-exposure treatment with 8.33, 25 or 75 mpk JNJ-9676 or 200 mpk molnupiravir (n = 5 animals/group). Percentage bodyweight change on day 4. Individual data points (n = 5 animals/group) represent mean ± standard deviation. Mean differences between groups are calculated using one-way ANOVA with Šídák’s multiplicity correction. c-f, Post-exposure treatment with 75mpk JNJ-9676 or 250 mpk nirmatrelvir (treatment one hour before infection or 10 h after infection) (n = 5 animals in the vehicle group, n = 8 animals in other groups). c,d, Individual data points (n = 5 animals/group) represent mean ± standard deviation. Mean differences between groups are estimated as in b. c, Viral load in the lung. Values below the limit of detection (LOD) were imputed to 3.89 log10 copies/mL (LOD value). p = 0.0001 for JNJ-9676-1 h.p.i. versus vehicle, p = 0.0039 for JNJ-9676+10 h.p.i. versus vehicle, p = 0.0310 for NTV+10 h.p.i. versus vehicle. d, Infectious virus in the lung. Values below the LOD were imputed to 3 log10 plaque-forming units/g (LOD value). p < 0.0001 for JNJ-9676-1 h.p.i. versus vehicle, p < 0.0001 for JNJ-9676+10 h.p.i. versus vehicle, p = 0.0243 for NTV+10 h.p.i. versus vehicle, p = 0.0109 for JNJ-9676-1 h.p.i. versus NTV+10 h.p.i. and p = 0.0035 for JNJ-9676+10 h.p.i. versus NTV+10 h.p.i. e,f, Individual data points per group (median and 95% confidence intervals). Differences between groups are calculated using the non-parametric Kruskal-Wallis test with the original false discovery rate method of Benjamini and Hochberg multiplicity correction. e, Histopathology score in the lung. p = 0.0009 for JNJ-9676-1 h.p.i. versus vehicle, p = 0.0009 for JNJ-9676+10 h.p.i. versus vehicle. f, Immunohistology in the lung. p = 0.0017 for JNJ-9676-1 h.p.i. versus vehicle, p = 0.0017 for JNJ-9676+10 h.p.i. versus vehicle. g,h, Post-exposure treatment with 75 mpk JNJ-9676 or 250 mpk nirmatrelvir (treatment 10-, 24- or 48-hours post-infection)(n = 5 animals/group). Mean differences between groups are estimated as in b. g, Mean body weight ± standard deviation over time. h, Mean percentage bodyweight change ± standard deviation on day 4. Mean differences between groups are estimated as in b. p = 0.0066 for JNJ-9676+10 h.p.i. 75 mkp BID. h.p.i., hours post-infection; BID, twice daily; mpk, milligrams/kilogram bodyweight; LOD, limit of detection. The doses reflect the amount of compound given each administration. Source Data
Extended Data Fig. 6
Extended Data Fig. 6. Cryo-EM analysis of SARS-CoV-2_MProtein_FAb B_JNJ-9676.
a, Micrograph from SARS-CoV-2_MProtein_FAb B_JNJ-9676 data collection. b, Workflow: cryo-EM data analysis for SARS-CoV-2_MProtein_FAb B_JNJ-9676 map. CryoSPARC Live was used for real-time data processing. The non-uniform analysis yielded a 3.06-Å resolution 3D map. c, Representative 2D class averages of SARS-CoV-2_MProtein_FAb B_JNJ-9676. d, Local resolution coloured by ResMap estimation. e, Average resolutions estimated using 0.143 criterion of gold standard Fourier shell correlation (GSFSC). f, Anisotropy assessed by 3D-FSC server, showing complex sphericity of 0.969. g, Model validation through FSC curve comparisons: model versus half map 1 (work), model versus half map 2 (free), model versus full map in red, black, and green.

Similar articles

Cited by

References

    1. Siu, Y. L. et al. The M, E, and N structural proteins of the severe acute respiratory syndrome coronavirus are required for efficient assembly, trafficking, and release of virus-like particles. J. Virol.82, 11318–11330 (2008). - PMC - PubMed
    1. Zhang, Z. et al. Structure of SARS-CoV-2 membrane protein essential for virus assembly. Nat. Commun.13, 4399 (2022). - PMC - PubMed
    1. V’kovski, P., Kratzel, A., Steiner, S., Stalder, H. & Thiel, V. Coronavirus biology and replication: implications for SARS-CoV-2. Nat. Rev. Microbiol.19, 155–170 (2021). - PMC - PubMed
    1. Helmy, Y. A. et al. The COVID-19 pandemic: a comprehensive review of taxonomy, genetics, epidemiology, diagnosis, treatment, and control. J. Clin. Med.9, 1225 (2020). - PMC - PubMed
    1. Lim, Y. X., Ng, Y. L., Tam, J. P. & Liu, D. X. Human coronaviruses: a review of virus-host interactions. Diseases4, 26 (2016). - PMC - PubMed

MeSH terms

LinkOut - more resources