. 2025 Apr;640(8058):514-523.
doi: 10.1038/s41586-025-08773-x. Epub 2025 Mar 26.

A coronavirus assembly inhibitor that targets the viral membrane protein

Affiliations

A coronavirus assembly inhibitor that targets the viral membrane protein

Manon Laporte et al. Nature. 2025 Apr.

Abstract

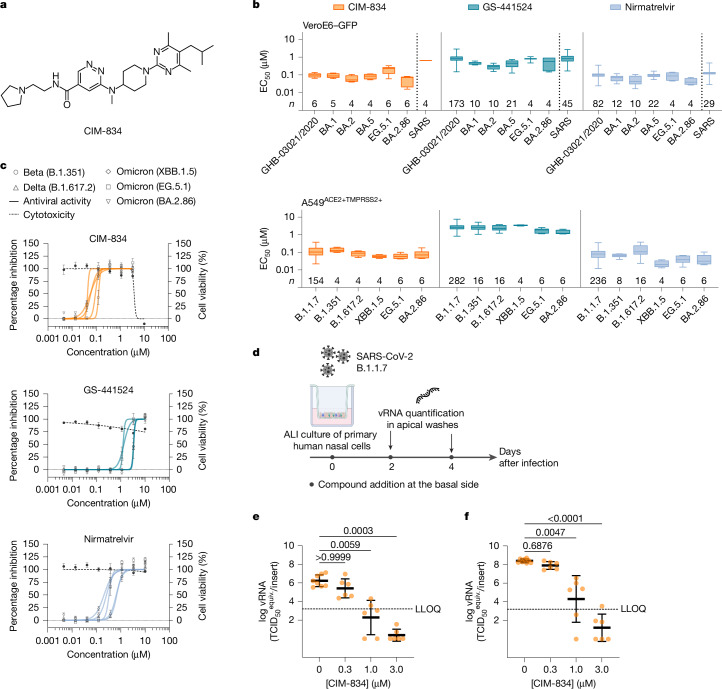
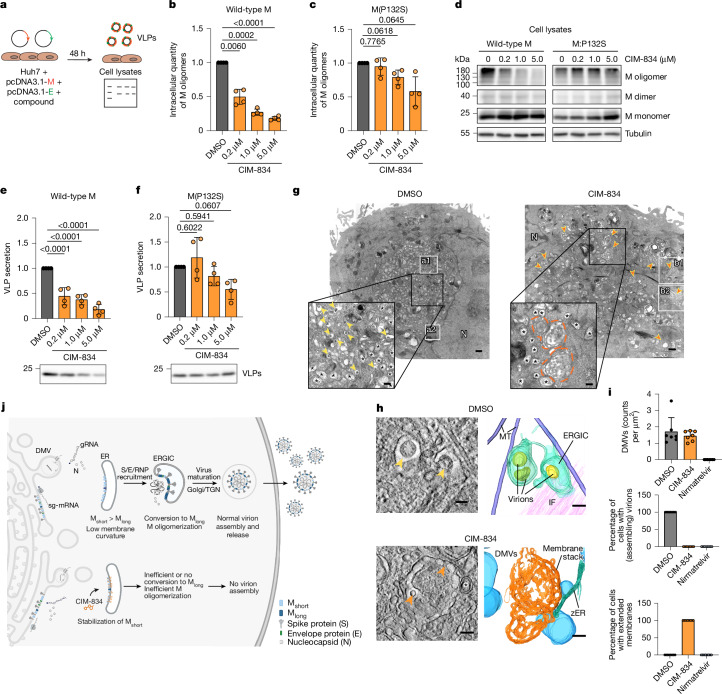
The coronavirus membrane protein (M) is the main organizer of coronavirus assembly1-3. Here, we report on an M-targeting molecule, CIM-834, that blocks the assembly of SARS-CoV-2. CIM-834 was obtained through high-throughput phenotypic antiviral screening followed by medicinal-chemistry efforts and target elucidation. CIM-834 inhibits the replication of SARS-CoV-2 (including a broad panel of variants) and SARS-CoV. In SCID mice and Syrian hamsters intranasally infected with SARS-CoV-2, oral treatment reduced lung viral titres to nearly undetectable levels, even (as shown in mice) when treatment was delayed until 24 h before the end point. Treatment of infected hamsters prevented transmission to untreated sentinels. Transmission electron microscopy studies show that virion assembly is completely absent in cells treated with CIM-834. Single-particle cryo-electron microscopy reveals that CIM-834 binds and stabilizes the M protein in its short form, thereby preventing the conformational switch to the long form, which is required for successful particle assembly. In conclusion, we have discovered a new druggable target in the replication cycle of coronaviruses and a small molecule that potently inhibits it.


Conflict of interest statement

Competing interests: KU Leuven has filed a patent application claiming the discovery of a class of antiviral molecules to which CIM-834 belongs as SARS-CoV-2 replication inhibitors. The authors declare no other competing interests.

Figures

Fig. 1
Fig. 1. CIM-834 inhibits SARS-CoV-2 and SARS-CoV replication.
a, The structural formula of CIM-834. b, CIM-834 inhibits the replication of different SARS-CoV-2 variants and SARS-CoV in two different cell lines. Nirmatrelvir and GS-441524 were included for comparison. Box plots show the median and the 25th and 75th percentiles, and the whiskers show the maximum and minimum. The number of biological independent experiments is indicated above the x axis c, Dose–response curves of the antiviral activity (coloured lines) and cytotoxicity (dashed lines) on A549ACE2+TMPRSS2 cells (mean ± s.e.m.; n = 4 biologically independent experiments). df, CIM-834 inhibits SARS-CoV-2 B.1.1.7 replication in primary human nasal cells grown at the air–liquid interface (d). The reduction in vRNA levels after treatment is shown at day 2 (e) and day 4 (f); P-values are shown; Kruskal–Wallis test and Dunn’s comparison, mean ± s.e.m.; n = 6 biologically independent experiments. LLOQ, lower limit of quantification. Credit: d, created in BioRender, M. Laporte (2025). https://BioRender.com/q39i535.
Fig. 2
Fig. 2. Efficacy of CIM-834 in SARS-CoV-2 infected SCID mice and hamsters.
a, SCID mice were intranasally infected with 105 times the tissue-culture infectious dose (TCID50) of SARS-CoV-2 B.1.351 and treated twice a day with CIM-834 or with nirmatrelvir. No ritonavir was used in either of the treated groups. Treatment was initiated just before infection (Day 0) or at the indicated times after infection. b,c, Lung infectious titres (b) and vRNA load (c) determined 3 days after infection. Individual data and median values are shown, along with P-values. d, Weight change for the different treatment groups at day 3 after infection as a percentage, normalized to the body weight at the time of infection (Kruskal–Wallis test and Dunn’s comparison, mean ± s.d.; n = 2 biologically independent experiments with 6 mice in each group per experiment). e, Syrian hamsters were intranasally infected with 104 times the TCID50 of SARS-CoV-2 USA-WA1/2020 treated for four consecutive days with vehicle, CIM-834/ritonavir (100 + 50 mg per kg, twice a day) or nirmatrelvir (300 mg per kg, twice a day). One day after infection, treated index hamsters were co-housed with untreated sentinel hamsters. f, Lung infectious titres, vRNA load and pathology scores of index hamsters at day 4 after infection. g, Lung infectious titres and vRNA load in untreated sentinel hamsters three days after the start of co-housing (Kruskal–Wallis test and Dunn’s comparison; n = 2 biologically independent experiments with, for each experiment, two hamsters for the mock-infected group, two hamsters in the group of sentinels co-housed with vehicle-treated hamsters and four hamsters in the other groups). h, Representative haematoxylin and eosin-stained images of hamster lungs at day 4 after infection (see supplementary Table 1 for all lung pathology scores). Blue and red arrows indicate inflamed bronchi and vascular regions, respectively; green arrows indicate limited bronchopneumonia (only observed in the vehicle group). Scale bars, 100 μm. Credit: a,e, created in BioRender, M. Laporte (2025). https://BioRender.com/q39i535. Source data
Fig. 3
Fig. 3. Amino acid substitution P132S in the M protein is selected by CIM-834 and is associated with antiviral resistance.
a, In vitro resistance selection was done by passaging SARS-CoV-2 B.1.1.7 in the presence of increasing concentrations of CIM-834 in A549ACE2+TMPRSS2 cells. b, The P132S substitution is located in the carboxy-terminal intravirion domain of the M protein. c, Introduction of M(P132S) in the background of SARS-CoV-2 (Wuhan and Omicron BF.7) through reverse genetics. d, Replication kinetics of rWuhan-WT and the M(P132S) mutant in human nasal epithelial airway cultures grown at the air–liquid interface. Infectious virus titres from apical washes collected at different time points were determined (mean ± s.e.m.; n = 6 biologically independent experiments). e, Susceptibility of rWuhan-WT and M(P132S) for CIM-834 and the reference inhibitors GS-441524 and nirmatrelvir, in A549ACE2+TMPRSS2 cells (individual and median values are shown; n = 6 biologically independent experiments). Two-way analysis of variance (ANOVA) with Sidak’s multiple comparisons test was used to compare EC50 values. f, Level of compound resistance associated with other M substitutions reported in ref. . Mutations were reverse-engineered in the omicron BF.7 background (individual and median values are shown; n = 3 or n = 4 (P132S) biologically independent experiments with two technical repeats). Two-way ANOVA with Dunnett’s multiple comparisons test was used to compare EC50 values. g, Fold changes in EC50 values of M mutants versus wild-type virus (same data as in f; individual and mean values are shown; n = 3 or n = 4 (P132S) biologically independent experiments). Credit: b,c, created in BioRender, M. Laporte (2025). https://BioRender.com/t04g029.
Fig. 4
Fig. 4. CIM-834 blocks SARS-CoV-2 assembly.
a, The set-up of the VLPs assay. b,c, Western blots were quantified and Moligomers/Mtotal was calculated for wild-type M (b) and M(P132S) (c) relative to the DMSO control (mean ± s.d.; n = 4 biologically independent experiments; ordinary one-way ANOVA and Dunnett’s test). d, Representative western blot (with tubulin as a loading control). e,f, VLP secretion quantified by extracellular M monomer detection by western blot, and calculation of Mmedium/Mlysate + medium relative to the DMSO control, for wild-type M (e) and M(P132S) (f) (mean ± s.d.; n = 4 biologically independent experiments; ordinary one-way ANOVA and Dunnett’s test). A representative western blot with extracellular M levels is shown below each graph. g, Overview of the perinuclear region in DMSO- or CIM-834 (1 µM)-treated cells 10 h after infection with SARS-CoV-2. Yellow arrowheads indicate virions and virion-assembly sites; orange arrowheads and dotted circles indicate extended membrane compartments. White boxes are magnified in Extended Data Fig. 2h. Asterisks indicate DMVs. N, nucleus. Section thickness, 70 nm. Scale bars: 500 nm in the main images, 200 nm in the zoomed images. h, Tomographic reconstructions. Yellow arrowheads indicate mature and assembling virions (top left); orange arrowheads indicate regions of high membrane curvature and invaginations in the DMV proximal membrane accumulations (bottom left). MT, microtubules; IF, intermediate filaments; zER, zippered ER. The tomographic volume of the DMSO- and CIM-834-treated samples is displayed in Supplementary Videos 1 and 2, respectively. Section thickness is an average of 5 tomographic slices of 0.78 nm each. Scale bars: for DMSO, both 50 nm; for CIM-834, left is 100 nm, right is 50 nm. i, Top, quantification of the number of DMVs per 1 µm2 of cytoplasmic area. Middle, percentage of cells showing (assembling) virions. Bottom, percentage of cells with DMV-proximal membrane stacks. Mean ± s.d. of n = 2 independent experiments with 8 infected cells per condition analysed. j, Proposed antiviral mechanism of CIM-834. Top, the viral M protein drives SARS-CoV-2 assembly; the vRNP associates with E, S and Mshort at the ERGIC membrane, which induces a conformation switch to Mlong, resulting in membrane curvature and subsequent virion assembly and release. Bottom, inhibition of coronavirus assembly by CIM-834; binding of CIM-834 to Mshort (see Fig. 5) prevents the conformational switch and, as a result, prevents virion assembly. TGN, trans-Golgi network. Credit: j, created in BioRender, M. Laporte (2025). https://BioRender.com/g67z787.
Fig. 5
Fig. 5. The structural basis for the antiviral activity of CIM-834.
a,b, Cryo-EM map (a) and atomic model (b) of SARS-CoV-2 M protein in complex with Fab-B and CIM-834, showing M protein protomers (blue and purple), Fab-B (pink) and bound inhibitor (yellow). c, Two orthogonal views of the sharpened cryo-EM map for CIM-834 shown at a sigma level of 4.6. d, Cartoon representation of a single M protomer. The bound CIM-834, situated between transmembrane helices 2 and 3 and the hinge region, is shown as a surface representation. e, Atomic model of the M dimer in complex with CIM-834 showing the positions of the resistance mutations M91, S99, N117 and P132 (orange). f,g, Zoomed-in view of the CIM-834 binding site, with residues within 5 Å of the compound shown as sticks. Putative hydrogen bonds are shown as dashed lines. h, Atomic model of the CIM-834 binding site, showing residues within 5 Å of CIM-834 as pale transparent shapes. i, The equivalent view to h showing a short-form M dimer (PDB: 8CTK) in the absence of the inhibitor. j, Superposition of the M-CIM-834 complex (this study) with previously determined short-form structures (PDB: 8CTK (ref. ) and 7VGS (ref. ).
Extended Data Fig. 1
Extended Data Fig. 1. Microsomal stability, mouse and hamster PK parameters, CYP inhibition and in vivo efficacy of CIM-834.
a, Liver microsomal stability was determined as described in the materials and methods. For PK studies, CIM-834 was formulated as a solution in propylene glycol/Tween80/pH 5 citrate buffer (14/1/85) and administered to male CD-1 mice at 10 or 100 mg/kg, or administered to female hamsters at 100 mg/kg after a pre-treatment of ritonavir as a solution formulated in EtOH/propylene glycol/water (43/27/30) at 50 mg/kg. RoA: route of administration. CL, clearance; Vss, steady-state volume of distribution; Cmax, maximum concentration; AUClast, area under the curve up to the last measurable concentration. F was calculated based on AUClast iv and po and corrected for dose. ND: not determined. b, IC50 of CIM-834 on different CYP enzymes. c, SCID mice were intranasally infected with 105 TCID50 SARS-CoV-2 B.1.351 and treated orally once (QD) or twice (BID) daily with CIM-834 or nirmatrelvir. No ritonavir was used in either of the treated groups. Treatment was initiated just before infection. Lung infectious titres, vRNA and body weight change were determined 3 days post-infection (Kruskal-Wallis test and Dunn’s comparison, median values (infectious virus and vRNA) or mean ± s.d, (weight change), n = 2 biologically independent experiments with 6 mice in each group/experiment). Source data
Extended Data Fig. 2
Extended Data Fig. 2. CIM-834 blocks coronavirus particle formation.
a, Setup of the time-of-drug-addition assay (TOA). b,c, Ten hr p.i. intracellular vRNA b, and infectious viral particles c, were quantified (mean ± s.d., n = 3 biologically independent experiments, one-way ANOVA followed by Dunnett’s multiple comparisons with the DMSO control). d, TOA assay using VeroE6-H2B-mCherry cells and rSARS-CoV-2-mNeonGreen. e, Quantification of %infected cells (mNeonGreen+ and mCherry+ VeroE6 cells) relative to the DMSO control (mean ± s.d., n = 6 biologically independent experiments). f, Virus kinetics experiment with the same setup (compounds added at 0 h p.i.) and quantification of infected cells at different time points. In a-f, hydroxychloroquine was tested at 10 µM, CIM-834 and nirmatrelvir at 1 µM. g, CIM-834 does not influence the co-localization of M and TGN46, a marker for the trans-Golgi network. Data (mean ± s.d.) from two independent experiments. h, TEM (top) and tomographic reconstruction (bottom) of cytoplasmic regions of DMSO- or CIM-834(1 µM)-treated SARS-CoV-2 infected cells (10 h p.i.). a1, a2, Details of boxed regions highlighted in Fig. 4g, showing additional examples of assembly sites located both at the center of the DMV cluster and at its periphery, in proximity of the terminal region of Golgi cisternae (G). m, mitochondrion. b1, b2: Magnified regions from Fig. 4g, showing concentric stacks of membranes (orange dashed lines) detected in CIM-834 treated cells and their proximity to DMVs (*). c1,c2: Slices from tomographic acquisition of DMSO (c1) and CIM-834-treated cells (c2), highlighting the regions magnified respectively below (d, f) or in Fig. 4h (c, e). Section thickness: 70 nm (a1,a2,b1,b2). Tomographic section thickness: 0.78 nm (c1,c2). i, Inhibition of the activities of purified, recombinant enzymes assayed in vitro in the presence of CIM-834 and appropriate reference compounds.
Extended Data Fig. 3
Extended Data Fig. 3. Tomographic analysis of SARS-CoV-2 infected A549ACE2+TMPRSS2 cells (10 h p.i.).
a, Example electron micrograph of a high-pressure frozen and freeze substituted DMSO-treated infected cell. Yellow arrowheads indicate assembling virions and black stars (*) indicate DMVs. b,c, Detail of the regions boxed in panel a, showing a strong contrast of the assembling viral ribonucleoprotein at progressive stages of assembly. The tomographic slice in panel b corresponds to a diagonally resliced tomographic volume capturing a view of three adjacent assembly sites. Three-dimensional segmentations of the progressively assembling virions are shown on the right of the tomographic sections. Light blue volumes represent DMVs, light green the ERGIC/Golgi membranes containing the virions. The virions’ color coding indicates stages of budding: early (yellow), intermediate (orange) and complete (red). Viral RNPs are represented in purple. d,e, Further examples of virions in very early and late stages, respectively taken from the tomographic volume in a at a z height not visible in the overview. f, Tomographic slice through an infected and CIM-834 (1 µM)-treated cell showing complete absence of virions and assembly events, despite a high abundance of DMVs of similar size and distribution as observed in DMSO-treated cells. Darkened, elongated mitochondria (m) are present in the area surrounding the DMVs. g, Segmentation of the volume displayed in f, showing the spatial relationship of DMVs (light blue) and mitochondria (pink), confirming the absence of assembly sites throughout the volume. h, i Magnified tomographic sections of the boxed regions in panel f. Tomographic section thickness: 0.78 nm (a,f), average of 5 × 0.78 nm thick slices (b,c,h,i).
Extended Data Fig. 4
Extended Data Fig. 4. CIM-834 binds directly to SARS-CoV-2 M protein.
a, Offline affinity selection mass spectrometry (AS-MS) of 5 µM M protein with 5 µM CIM-834 (blue) or buffer control (purple), (mean ± s.d., n = 3 independent experiments). b, Example of extracted ion chromatogram (EIC) for CIM-834 with 10 ppm mass tolerance with M protein (blue) and buffer control (purple). c, MS spectrum corresponding to the EIC peak for CIM-834 with M protein (blue).
Extended Data Fig. 5
Extended Data Fig. 5. Single-particle cryo-EM data processing pipeline for the FabE complex.
Schematic representation of the single-particle cryo-EM data processing pipeline for the FabE complex. Major steps include particle picking, 2D classification, initial model generation, 3D classification, refinement, and map sharpening. The final reconstruction yielded a 3.3 Å resolution map. Additional details are described in the single-particle image processing section of the materials and methods. CTF: contrast transfer function.
Extended Data Fig. 6
Extended Data Fig. 6. Single-particle cryo-EM data processing pipeline for the FabB complex.
Schematic representation of the single-particle cryo-EM data processing pipeline for the FabE complex. Major steps include particle picking, 2D classification, initial model generation, 3D classification, refinement, and map sharpening. The final reconstruction yielded a 3.2 Å resolution map. Additional details are described in the single-particle image processing section of the materials and methods. CTF: contrast transfer function.
Extended Data Fig. 7
Extended Data Fig. 7. Single-particle cryo-EM data processing for FabE and FabB complexes.
a, Representative motion-corrected electron micrograph of FabE complex embedded in vitreous ice. Scale bar = 20 nm. b, Representative reference-free 2D class averages. c, Gold-standard Fourier shell correlation (FSC) curve generated from the independent half maps contributing to the 3.3 Å global resolution density map of the FabE complex. d, Local resolution filtered EM density map for the refined FabE complex (left), and central-slice of the complex (right), coloured according to local resolution which was calculated in CryoSPARC. e, Representative motion-corrected electron micrograph of FabB complex embedded in vitreous ice. Scale bar = 20 nm. f, Representative reference-free 2D class averages. g, Gold-standard Fourier shell correlation (FSC) curve generated from the independent half maps contributing to the 3.2 Å global resolution density map of the FabB complex. h, Local resolution filtered EM density map for the refined FabB complex (left), and central-slice of the complex (right), coloured according to local resolution which was calculated in CryoSPARC. Location of the CIM-834 binding pocket is circled.
Extended Data Fig. 8
Extended Data Fig. 8. Atomic model of SARS-CoV-2 M in complex with Fab-B and CIM-834.
a, Atomic model of the dimeric complex with residues coloured according to calculated B-factor. b, Zoomed-in view of the inhibitor binding site with the C1 symmetry (left) or C2 symmetry (right)-imposed EM density shown as a blue mesh. c, Map versus model FSC curves for the final refined model, generated in Phenix. d, Two orthogonal views of the sharpened EM density for CIM-834 shown at a sigma level of 4.8 and 6.5. e, Two orthogonal views of the unsharpened EM density for CIM-834 shown at a sigma level of 4.6 and 5.8.
Extended Data Fig. 9
Extended Data Fig. 9. Amino acids in proximity of the CIM-834 binding pocket and their conservation in the M protein sequence of different human coronaviruses.
a-b, M protein chains in grey (dark grey = chain A, light grey= chain B). Bound compound displayed as surface. Green residues are within 5 Å of the bound compound. Blue residues are 5-10 Å from bound compound. c, Amino acid alignment of the M proteins of the seven human coronaviruses. Identical residues are shown as dots. Same colour coding as in a,b. d, Comparison of the overall conservation of the M protein sequence among different human coronaviruses versus conservation of the amino acids in the CIM-834 binding pocket (residues 10 Å and 5 Å from the bound compound). Conservation of the complete sequence of the main protease and its active site is provided for comparison. e, Mapping of the conservation rate (identity) of M residues on cryo-EM model (colour scale: red ≤20%, yellow 50%, grey ≥ 70%), based on an alignment of 100 coronaviral sequences. Sequences used for mapping were retrieved from a BLAST search against the M protein sequence, in the UniProtKB (www.uniprot.org).
Extended Data Fig. 10
Extended Data Fig. 10. Combinations of CIM-834 with GS-441524 or nirmatrelvir results in additive antiviral activity in vitro.
An antiviral assay was performed by infecting A549ACE2+TMPRSS2-mCherry with a SARS-CoV-2-mNeonGreen reporter virus as described previously. Left, dose-response matrix for a, CIM-834 and GS-441524 or b, CIM-834 and nirmatrelvir representing average %inhibition of virus replication. Right, heat map of the delta scores (%) for the same combinations and ZIP analysis where δ = 0, δ > 0, and δ < 0 correspond to zero interaction, synergy, and antagonism, respectively. The overall zero interaction potency (ZIP) score represents the response beyond expectation (in %). In the range −10 < ZIP < 10, the compounds are likely to act in an additive manner, Score ≥10 indicate synergism. The results shown represent the means of two independent experiments for each combination. Data were then analysed with the SynergyFinder webtool based on zero interaction potency (ZIP) model.

References

    1. Zhang, Z. et al. Structure of SARS-CoV-2 membrane protein essential for virus assembly. Nat. Commun.13, 4399 (2022). - PMC - PubMed
    1. Neuman, B. W. et al. A structural analysis of M protein in coronavirus assembly and morphology. J. Struct. Biol.174, 11–22 (2011). - PMC - PubMed
    1. Bracquemond, D. & Muriaux, D. Betacoronavirus assembly: clues and perspectives for elucidating SARS-CoV-2 particle formation and egress. mBio12, e0237121 (2021). - PMC - PubMed
    1. de Wit, E., van Doremalen, N., Falzarano, D. & Munster, V. J. SARS and MERS: recent insights into emerging coronaviruses. Nat. Rev. Microbiol.14, 523–534 (2016). - PMC - PubMed
    1. Our World in Data. Estimated cumulative excess deaths per 100,000 people during COVID-19, Jun17, 2024. https://ourworldindata.org/explorers/coronavirus-data-explorer.

MeSH terms