. 2025 May;641(8065):1238-1247.
doi: 10.1038/s41586-025-08748-y. Epub 2025 Mar 26.

Changes in neurotensin signalling drive hedonic devaluation in obesity

Affiliations

Changes in neurotensin signalling drive hedonic devaluation in obesity

Neta Gazit Shimoni et al. Nature. 2025 May.

Abstract

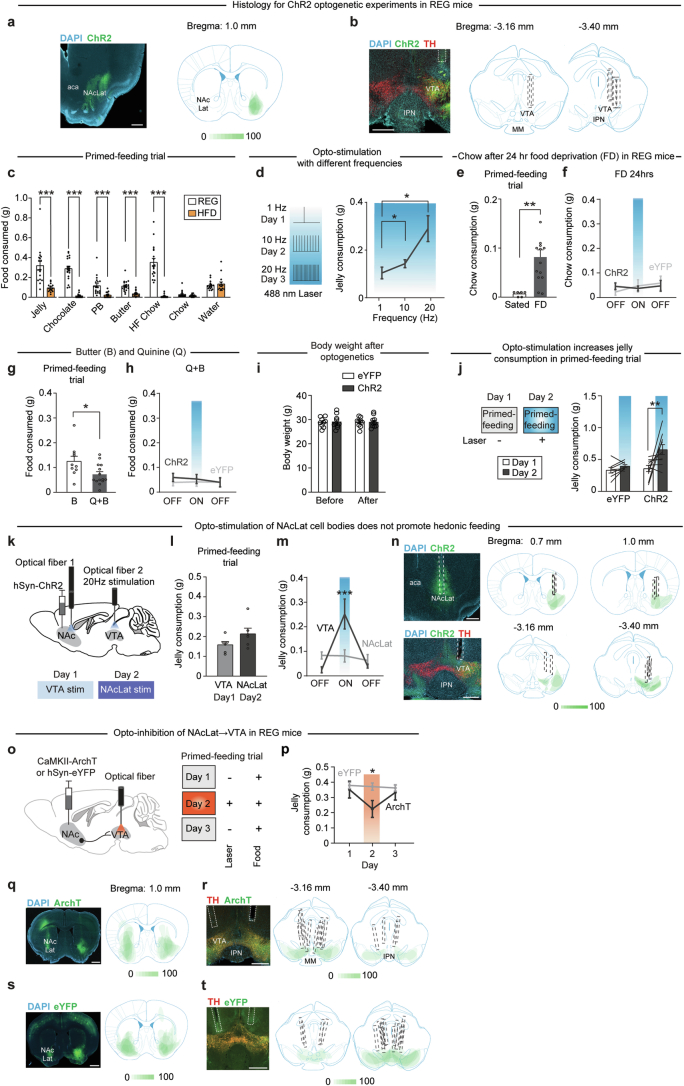
Calorie-rich foods, particularly those that are high in fat and sugar, evoke pleasure in both humans and animals1. However, prolonged consumption of such foods may reduce their hedonic value, potentially contributing to obesity2-4. Here we investigated this phenomenon in mice on a chronic high-fat diet (HFD). Although these mice preferred high-fat food over regular chow in their home cages, they showed reduced interest in calorie-rich foods in a no-effort setting. This paradoxical decrease in hedonic feeding has been reported previously3-7, but its neurobiological basis remains unclear. We found that in mice on regular diet, neurons in the lateral nucleus accumbens (NAcLat) projecting to the ventral tegmental area (VTA) encoded hedonic feeding behaviours. In HFD mice, this behaviour was reduced and uncoupled from neural activity. Optogenetic stimulation of the NAcLat→VTA pathway increased hedonic feeding in mice on regular diet but not in HFD mice, though this behaviour was restored when HFD mice returned to a regular diet. HFD mice exhibited reduced neurotensin expression and release in the NAcLat→VTA pathway. Furthermore, neurotensin knockout in the NAcLat and neurotensin receptor blockade in the VTA each abolished optogenetically induced hedonic feeding behaviour. Enhancing neurotensin signalling via overexpression normalized aspects of diet-induced obesity, including weight gain and hedonic feeding. Together, our findings identify a neural circuit mechanism that links the devaluation of hedonic foods with obesity.


Conflict of interest statement

Competing interests: The authors declare no competing interests.

Figures

Fig. 1
Fig. 1. Chronic HFD promotes uncoupling of NAcLat→VTA activity during hedonic feeding.
a, Body weight of REG mice that are switched to HFD and then returned to REG. Arrows indicate timing of acute feeding assays on REG (green) and HFD (red) (***P < 0.001, 1-way repeated measures ANOVA with Holm–Šídák multiple comparisons test; n = 12 mice). b,c, Mean weekly consumption of regular chow and high-fat (HF) chow (**P = 0.0022) (b) and caloric intake (**P = 0.0036) (c) in home cages while on REG or HFD (n = 3 cages; normalized as grams per mouse per week; 2-sided paired Student’s t-test). d, Mean jelly consumption during acute feeding assays for REG mice and after 4 weeks of HFD (***P < 0.001, 2-sided paired Student’s t-test; n = 12 mice). e, Experimental design. f, Acute feeding assay. g, Timeline: trial 1 (habituation, no food); trials 2 and 3 (food presentation, chow or jelly, counterbalanced); trial 4 (NAcLat→VTA opto-tagging). h, Food consumption for REG and HFD mice (***P < 0.001, 2-way repeated measures ANOVA with Holm–Šídák test; REG: n = 8 mice, HFD: n = 7 mice). i,j, DLC behavioural motifs for REG (i) and HFD (j) mice, with example unit firing rates and piezo activity. k, Top, z-scored average of all recorded action potentials across trials relative to events. Total unit events analysed for each motif to determine whether the unit shows significantly increased response (IR) or decreased response (DR) relative to baseline (average unit waveform in inset). Bottom, sample action potentials during feeding or walking (arrows show event onsets; *P = 0.024, ***P = 0.0002; 2-sided Wilcoxon signed-rank test). l,m, Relative z-score average of individual NAcLat→VTA units for REG (l) and HFD (m) mice during different behavioural motifs. Bar graphs show percentage of IR, DR and non-responsive units in each behavioural motif (***P = 0.0002, 2-sided Chi-squared test for proportions with Bonferroni correction for multiple comparisons; REG: n = 21 units from n = 8 mice, HFD: n = 20 units from n = 7 mice). Data are mean ± s.e.m. (error bars or shading). Source Data
Fig. 2
Fig. 2. Opto-stimulation of NAcLat→VTA promotes hedonic feeding in REG mice but not in HFD mice.
a, Experimental design. b, Acute feeding assay: mice were placed in an open-field chamber containing two cups (one with food and one empty). c, Timeline: mice were tested in 5× 15-min trials. Food was presented during trials 2 to 5, with laser stimulation (473 nm, 20 Hz, 5 ms) during trial 4. After each trial, the food cup was replaced with a new cup of the same food type, and consumption was analysed. d, Consumption during the acute feeding assay for ChR2 and eYFP mice on a REG diet (jelly (ChR2: n = 10 mice, eYFP: n = 8 mice; ***P = 0.0001), chocolate (ChR2: n = 10 mice, eYFP: n = 9 mice; ***P = 0.0003), peanut butter (ChR2: n = 10 mice, eYFP: n = 9 mice; *P = 0.0112), butter (ChR2: n = 10 mice, eYFP: n = 9 mice; *P = 0.0201), high-fat chow (ChR2: n = 9 mice, eYFP: n = 9 mice; **P = 0.0032), chow (ChR2: n = 10 mice, eYFP: n = 9 mice; P > 0.05) or water (ChR2: n = 7 mice, eYFP: n = 9 mice; P > 0.05)). Blue indicates laser stimulation of the NAcLat→VTA pathway (2-way repeated measures ANOVA with Holm–Šídák test). e, Food consumption during the acute feeding assay for HFD mice (P > 0.05; ChR2: n = 10 mice, eYFP: n = 5 mice, 2-way repeated measures ANOVA with Holm–Šídák test). f, Real-time place preference: HFD mice received NAcLat→VTA stimulation (473 nm, 20 Hz, 5 ms pulses) upon entry into one compartment of a 3-chamber apparatus. The paired side was switched after 10 min. Sample trajectories show movement during each phase. HFD mice spent significantly more time in the light-paired compartment (stim) compared to the unpaired compartment (non-stim) (***P < 0.001, 2-sided paired Student’s t-test; n = 18 mice). g, Food consumption during the acute feeding assay for mice removed from HFD and returned to a regular diet, tested at different time points (2 weeks off HFD: **P = 0.0075, 3 weeks off HFD: **P = 0.0041, 2-way repeated measures ANOVA with Holm–Šídák test; ChR2: n = 8 mice, eYFP: n = 7 mice). Data are mean ± s.e.m. Source Data
Fig. 3
Fig. 3. Reduced NAcLat → VTA NTS expression and release in HFD mice.
a, Patch-seq experimental design. b, Example current injection (150 pA) in bead-labelled NAcLat→VTA cells from REG (top) and HFD (bottom) mice. cf, Electrophysiological properties of NAcLat→VTA cells from REG and HFD mice. c, Firing frequency (P > 0.05, 2-way repeated measures ANOVA; REG: n = 23 cells, n = 10 mice; HFD: n = 19 cells, n = 11 mice). d, Membrane capacitance (P > 0.05, unpaired Student’s t-test; REG: n = 21 cells, n = 10 mice; HFD: n = 20 cells, n = 11 mice). e, Membrane resistance (P > 0.05, unpaired Student’s t-test; REG: n = 21 cells, n = 10 mice; HFD: n = 20 cells, n = 11 mice). f, Resting membrane potential (P > 0.05, 2-sided unpaired Student’s t-test; REG: n = 23 cells, n = 10 mice; HFD: n = 20 cells, n = 11 mice). g, Volcano plot of differential gene expression in NAcLat→VTA cells between REG and HFD mice. Red data points indicate significantly different genes (absolute value of log2FC > 1 and P < 0.05). Statistical significance was determined using a two-sided hypothesis. Values were not corrected for multiple comparisons. h,i, Heat maps showing relative expression of synaptic and feeding-related genes in individual NAcLat→VTA cells from REG (h) and HFD (i) mice. TPM, transcripts per million. j, Violin plot of Nts gene expression in NAcLat→VTA cells from REG and HFD mice (REG: n = 23 cells, n = 10 mice; HFD: n = 20 cells, n = 11 mice). km, ntsLight1.1 experiment: AAV-hSyn-Chrimson-tdTomato and AAV9-hSyn-ntsLight1.1 were injected into the NAcLat and VTA, respectively. Optogenetic stimulation in acute brain slices revealed reduced ntsLight1.1 fluorescence in HFD compared with REG mice (**P = 0.0059, 2-sided unpaired Student’s t-test; REG: n = 14 slices, n = 5 mice; HFD: n = 17 slices, n = 4 mice). n, In vivo opto-photometry experiment using ntsLight2.0. FIP, fibre photometry. o, ntsLight2.0 recorded in VTA 5 s before and 20 s after 3-s opto-stimulation of NAcLat cells from the same mice on REG or HFD (n = 5 mice, z-score average for n = 30 trials). p, Area under the curve (AUC) during the 3–5 s interval for mice on REG or HFD (*P = 0.0125, 2-sided paired Student’s t-test; n = 5 mice). Data are mean ± s.e.m. (error bars or shading). Source Data
Fig. 4
Fig. 4. NAcLat→VTA NTS is necessary for hedonic feeding and dopamine cell excitation.
a, AAV-hSyn-ChR2 was injected alone (Nts-ctrl) or with AAV-hSyn-Cre (Nts-KO) into NAcLat of Ntsflox mice, with an optical fibre above VTA in REG mice. b, Fluorescent in situ hybridization images in NAcLat of Nts-ctrl and Nts-KO mice. Outlined regions are magnified on the left. aca, anterior commissure. Scale bars: 200 µm (5×), 50 µm (20×). c, Nts expression is significantly reduced in Nts-KO mice compared with Nts-ctrl mice (*P = 0.0159, 2-sided Mann–Whitney test; Nts-ctrl: n = 4 mice, Nts-KO: n = 5 mice). d, Timeline of acute feeding assay. e, NAcLat→VTA opto-stimulation significantly increases jelly consumption in Nts-ctrl mice compared with Nts-KO mice (**P = 0.0041, 2-way repeated measures ANOVA with Holm–Šídák test; Nts-ctrl: n = 10 mice, Nts-KO: n = 8 mice). f, Opto-pharmacology experiment in REG mice. g, Fluorescence images showing ChR2 or eYFP expression in the NAcLat (top) and VTA (bottom). Scale bars, 500 µm. h, On day 1, jelly was presented over 4 trials, with saline infused into VTA before the first OFF trial. On day 2, SR142948A (6 mM, 500 nl) was infused instead. Laser stimulation (20 Hz, 5 ms) during ON trial. i, Jelly consumption by ChR2 and eYFP mice following saline (left) or SR142948A (right) infusion (***P < 0.001, 2-way repeated measures ANOVA with Holm–Šídák multiple comparisons test; ChR2: n = 11 mice, eYFP: n = 15 mice). j, Whole-cell patch-clamp recordings of NAcLat-projecting VTA dopamine neurons (DA) during stimulation of NAcLat terminals in VTA. k, Fluorescent retrobeads and ChR2 expression in NAcLat. Scale bar, 500 µm. l, Firing in dopamine neurons from a REG mouse recorded in artificial cerebrospinal fluid (ACSF; top) or ACSF containing SR142948A (1 µM, middle) or from a HFD mouse recorded in ACSF (bottom). Blue shaded area indicates light stimulation (1 s, 20 Hz 5 ms pulses). m, Firing rates of dopamine neurons under conditions in l (**P = 0.002, 2-way repeated measures ANOVA with Holm–Šídák test; REG: n = 26 cells, n = 12 mice; REG + SR142948A: n = 12 cells, n = 3 mice; HFD: n = 21 cells, n = 5 mice). Data are mean ± s.e.m. Source Data
Fig. 5
Fig. 5. NTS overexpression in NAcLat→VTA mitigates HFD-induced behavioural adaptations.
a, A retrograde virus (RG-EIAV-Cre) was injected into the VTA, and either Cre-dependent AAV for NTS overexpression (NTS-OE) or mCherry (ctrl) was injected into the NAcLat of HFD mice. AAV-hSyn-Chrimson-tdTomato and AAV9-hSyn-ntsLight1.1 were also injected, and acute VTA slices were prepared six weeks later to record ntsLight1.1. b, ntsLight1.1 activity during opto-stimulation of NAcLat inputs in NTS-OE and mCherry mice on HFD. c, AUC of ntsLight1.1 activity shows significantly higher NTS release in NTS-OE mice (*P = 0.0397, 2-sided unpaired Student’s t-test; REG: n = 10 slices from n = 2 mice; HFD: n = 9 slices from n = 2 mice). d, Experimental design and timeline. e, Jelly consumption for NTS-OE and mCherry HFD mice with opto-stimulation of NAcLat→VTA (*P = 0.0309, 2-way repeated measures ANOVA with Holm–Šídák multiple comparisons test; NTS-OE: n = 6 mice, nCherry: n = 8 mice). f, Experimental design. g, Body weight in NTS-OE and mCherry mice on REG, HFD, and when returned to REG. Arrows indicate time points of the assays in hl: REG (R), 1 week on HFD (H1), 4 weeks on HFD (H4), 1 week off HFD (O1) and 3 weeks off HFD (O3) (day 56: **P = 0.0079, day 63: *P = 0.0164, day 70: *P = 0.0256, 2-way repeated measures ANOVA with Holm–Šídák multiple comparisons test; NTS-OE: n = 14 mice, mCherry: n = 10 mice). h, Mean jelly consumption during acute feeding assays at different time points shown in g (H1: **P = 0.0049, H4: **P = 0.0084, O1: **P = 0.0037, 2-sided unpaired Student’s t-test at each timepoint; mCherry: n = 10 mice, NTS-OE: n = 14 mice). i, Weekly home cage consumption of chow and high-fat chow during REG, 4 weeks of HFD and when returned to REG for 3 weeks (OFF) (*P = 0.0397, 2-sided unpaired Student’s t-test at each timepoint; NTS-OE: n = 3 cages, mCherry: n = 2 cages, consumption was normalized to a single mouse). jl, Open-field behaviour in HFD NTS-OE and mCherry mice. Behaviour was assessed at timepoint H4. j, Velocity (top) and individual motifs as indicated by colour code (bottom) and percentage of time spent in each motif (right). k, Time spent in motifs (***P < 0.001, 2-way repeated measures ANOVA with Holm–Šídák multiple comparisons test; mCherry: n = 11 mice, NTS-OE: n = 9 mice). l, Velocity (***P < 0.001, 2-sided unpaired Student’s t-test). Data are mean ± s.e.m. (error bars or shading). Source Data
Extended Data Fig. 1
Extended Data Fig. 1. In vivo electrophysiological recordings of NAcLat → VTA neurons in REG and HFD mice.
(a) Left: sample fluorescent image showing recording location in the NAcLat for mice subjected to a regular diet (REG) (green: ChR2, blue: DAPI; aca: anterior commissure; scale bar 500 µm). Right: schematic overviews showing recording locations of all animals. Green indicates ChR2 expression. Refers to animals shown in Fig. 1. (b) Left: Sample fluorescent image showing ChR2-expressing (green) NAcLat terminals in the VTA of REG mice (red: tyrosine hydroxylase (TH); scale bar 500 µm). Right: schematic overviews showing ChR2 expression in NAcLat terminals (green) for all recorded animals (MM: medial mammillary nuclei, IPN: interpeduncular nucleus). Refers to animals shown in Fig. 1. (c, d) Same as in (a, b) but for mice subjected to a high-fat diet (HFD). Refers to animals shown in Fig. 1. (e) Mice with ad libitum access to high fat chow (HFD, orange) gained significantly more weight than mice who received a regular diet (REG, grey). Arrow indicates timepoint when electrophysiological recordings started (***p = 0.0009, nREG = 8 mice, nHFD = 7 mice, 2-way RM ANOVA with Holm-Šídák’s test). (f) Overview of data analysis pipeline for analysing opto-tagged and non-tagged single unit activity across behavioural motifs in freely behaving mice. (g, h) Sample frames from different behavioural motifs obtained from REG (g) and HFD (h) mice when they were presented with either jelly or chow. (i) Left: mean response latency to light stimulation for all recorded units in mice subjected to a regular diet (REG). Right: all opto-tagged units showed high correlation between evoked and spontaneous action potential waveforms (nREG = 21 units from n = 8 mice). (j) Top: spontaneous (black) and evoked (blue) averaged action potential waveforms for a sample NAcLat→VTA unit. Bottom: sample recording of an isolated unit with light-evoked and spontaneous spikes. (k) Sample plot showing spike sorting. A three-dimensional plot of simultaneously recorded units sorted according to action potential height detected at each recording electrode. Colours indicate action potentials that belong to separate sample units “Yellow”, “Red”, and “Blue”. (l) Sample units during opto-tagging trials based on plot shown in panel (k). Top: raster plots show example unit action potentials detected during each light delivery trial at time = 0 ms (blue line indicates delivery of 473 nm laser light;5 ms pulse; 2 Hz). Bottom: corresponding histograms show sum of all recorded action potentials across light delivery trials relative to onset of blue light stimulation (5 ms light delivered at time = 0 ms). “Red” unit is light responsive, “Blue” and “Yellow” units are not light responsive (FR: firing rate). (m) Corresponding histograms of 2 ms bins (grey) showing the max extracted spike count from shuffled unit spike data collected during opto-tagging trials. The 99.9th percentile from the shuffled data distribution (orange) is indicated by a blue vertical line. The observed max extracted spike count from any 2 ms bin spikes is indicated by a vertical red line. If the observed max extracted spike count (red line) was greater than the max extracted spike count from the shuffled data (blue line), then the recorded unit was classified as light responsive (i.e., opto-tagged). “Red” unit is light responsive, “Blue” and “Yellow” units are not light responsive. (n-r) Same as in (i-m) but for mice subjected to a high-fat diet (nHFD = 20 units from n = 7 mice). All data represented as mean ± SEM. All statistical significance was determined using a two-sided hypothesis. Source Data
Extended Data Fig. 2
Extended Data Fig. 2. Piezo- and DLC-based analyses of opto-tagged and non-tagged units.
(a, b) Heatmaps showing the relative Z-score average of individual NAcLat→VTA (opto-tagged) neurons (columns) during piezo sensor activation for jelly and chow feeding (rows) for REG (a) and HFD (b) mice. The bar graphs show the percentage of increased response type (IR, red), decreased response type (DR, blue) and non-responsive (white) opto-tagged units (**p = 0.009 for relative proportions of IR responses in REG versus HFD mice, nREG = 21 units from n = 8 mice; nHFD = 20 units from n = 7 mice; two-sided Chi-square test for proportions with Bonferroni correction for multiple comparisons). (c, d) Diagrams showing a significant correlation between feeding events detected across all conditions with DLC analysis and piezo sensor for time spent feeding (c) (**p = 0.0044, n = 30 XY pairs from nREG = 8 mice; nHFD = 7 mice; r Spearman: 0.5, linear regression) and for opto-tagged unit firing rate (d) (***p < 0.001, n = 55 XY pairs from nREG = 8 mice; nHFD = 7 mice; r Spearman: 0.7, linear regression). (e) DLC-based analysis of average time spent in each motif for REG (grey) and HFD (orange) mice. There was no significant difference in the time REG and HFD mice spent in either motif (p > 0.05, nREG = 8 mice, nHFD = 7 mice, 2-way RM ANOVA). Data represented as mean ± SEM. (f) Diagram showing an inverse correlation between time spent and Z-scored firing rate across all behavioral motifs (***p < 0.001, nREG = 8 mice; nHFD = 7 mice, r Spearman: −0.5, linear regression). (g, h) Heatmap showing the relative Z-score average of individual NAcLat (non-tagged) neurons (columns) during different behavioral motifs (rows) for REG (g) and HFD (h) mice. The bar graph shows the percentage of IR (red), DR (blue) response types and non-responsive (white) non-tagged units in each behavioural motif (nREG = 70 units from n = 8 mice; nHFD = 41 units from n = 7 mice; Chi-square test for proportions with Bonferroni correction for multiple comparisons). (i, j) As in (a, b) but for non-tagged units (*p = 0.0312 for relative proportions of IR responses in REG versus HFD mice, nREG = 70 units from n = 8 mice; nHFD = 41 units from n = 7 mice; two-sided Chi-square test for proportions with Bonferroni correction for multiple comparisons). Source Data
Extended Data Fig. 3
Extended Data Fig. 3. Optogenetic manipulations of NAcLat → VTA pathway during feeding behaviors in REG mice.
(a) Left: sample fluorescent image showing ChR2 expression (green) in the NAcLat (DAPI: blue; aca: anterior commissure; scale bar 500 µm). Right: schematic overview showing ChR2 expression in NAcLat for all REG mice. (b) Left: sample fluorescent image showing optical fibre location and ChR2 expression (green) in NAcLat terminals in the VTA (TH: tyrosine hydroxylase (red), IPN: interpeduncular nucleus; scale bar 500 µm). Middle and right: schematic overviews showing locations of optical fibers for all REG mice (MM: medial mammillary nuclei). (c) Food consumption during the 15 min primed-feeding trial in REG and HFD mice. During the primed-feeding trial, a specific food type (jelly, chocolate, peanut butter (PB), butter, high-fat (HF) chow, chow) or water was placed in one of the cups and mice were allowed ad libitum access for 15 min. REG mice consumed greater amounts of hedonic foods than HFD mice. (***p < 0.001, jelly: nREG = 18 mice, nHFD = 15 mice; chocolate: nREG = 19 mice, nHFD = 15 mice; peanut butter: nREG = 19 mice, nHFD = 15 mice; butter: nREG = 19 mice, nHFD = 15 mice; HF chow nREG = 18 mice, nHFD = 14 mice; chow: nREG = 19 mice, nHFD = 15 mice; water: nREG = 16 mice, nHFD = 15 mice; two-sided unpaired Student’s t-test for each food type). (d) Optogenetic stimulation of NAcLat→VTA promotes hedonic feeding behaviour in a frequency-dependent manner. Jelly consumption was measured on 3 different days in response to light stimulation of NAcLat terminals in the VTA. Same assay as in Fig. 2, except that, on each day, a different light stimulation frequency was used (1 Hz, 10 Hz, or 20 Hz). High frequency (10 Hz and 20 Hz) but not low frequency (1 Hz) light stimulation increased jelly consumption in REG mice (*p < 0.05, n = 10 mice, 1-way RM ANOVA with Holm-Šídák’s multiple comparisons test). (e) 24-hour food deprivation (FD) in REG mice significantly increases chow consumption in the primed-feeding trial when compared to sated mice (**p = 0.0041, nsated = 6 mice, nFD = 14 mice, two-sided unpaired Student’s t-test). (f) Optogenetic stimulation of NAcLat→VTA does not increase consumption of standard chow in food-deprived mice that are subjected to a regular diet (nChR2 = 7 mice, neYFP = 8 mice, 2-way RM ANOVA). (g) Mice consumed significantly less butter (B) adulterated with quinine (Q) during the primed-feeding trial when compared to regular butter consumption (*p = 0.017, nbutter = 10 mice, nbutter+quinine = 14 mice, two-sided unpaired Student’s t-test). (h) Optogenetic stimulation of NAcLat→VTA does not affect consumption of butter adulterated with quinine (p > 0.05, nChR2 = 7, neYFP = 7 mice, 2-way RM ANOVA). (i) Body weight of mice expressing ChR2 or eYFP in the NAcLat→VTA pathway was similar before and after the series of optogenetic stimulation experiments shown in Fig. 2 (p > 0.05, neYFP = 9 mice, nChR2 = 10 mice, 2-way RM ANOVA). (j) Left: on day 1, jelly consumption was measured for 15 min during the primed-feeding trial. 24 h later (day 2), the primed-feeding trial was repeated, but this time, mice received optogenetic stimulation of the NAcLat→VTA pathway. Right: jelly consumption was higher with optogenetic stimulation of the NAcLat→VTA pathway (on day 2) relative to baseline levels of jelly consumption measured on day 1 (**p = 0.008, nChR2 = 10 mice, neYFP = 8 mice, 2-way RM ANOVA with Holm-Šídák’s multiple comparisons test). (k) Experimental design for optogenetic stimulation of NAcLat cell bodies and NAcLat terminals in VTA. AAV-hSyn-ChR2 was injected into the NAcLat, and optical fibers were implanted above the NAcLat (i.e., NAcLat fibre) and above the VTA (i.e., VTA fibre). Mice were subjected to the same behavioural paradigm as shown in Fig. 2, except that on Day 1 NAcLat terminals in the VTA were stimulated and, on Day 2, NAcLat cell bodies were stimulated. (l) Jelly consumption during the primed-feeding trial did not differ between Days 1 and 2 (n = 6 mice, two-sided paired Student’s t-test). (m) Optogenetic stimulation (20 Hz, 5 ms pulses) of NAcLat terminals in the VTA, but not NAcLat cell bodies, increased jelly consumption (**p = 0.001, n = 6 mice, 2-way RM ANOVA with Holm-Šídák’s multiple comparisons test). (n) Left: Fluorescent images showing location of optical fibre in NAcLat (top, ChR2: green, DAPI: blue; scale bar 500 µm) and VTA (bottom, TH: red; scale bar 500 µm) (aca: anterior commissure, IPN: interpeduncular nucleus). Middle and right: schematic overview showing locations of optical fibres in NAcLat (top) and VTA (bottom) for all mice. Green indicates ChR2 expression. (o) Left: experimental design for optogenetic inhibition of NAcLat→VTA in REG mice. AAV-CaMKII-ArchT or AAV-hSyn-eYFP was injected into the NAcLat, and two optical fibers were implanted above the VTA. Right: experimental timeline: Mice were subjected for 3 consecutive days to the primed-feeding trial, but constant laser light was only delivered on day 2. (p) Jelly consumption in mice expressing ArchT or eYFP, with (day 2) and without (day 1 and day 3) constant laser light (nArchT = 7 mice, neYFP = 8 mice, *p = 0.032, 2-way RM ANOVA). (q, s) Left: sample fluorescent image showing ArchT (q) or eYFP (s) expression (green) in the NAcLat (DAPI: blue, scale bars 1 mm). Right: schematic overviews showing ArchT (q) ot eYFP (s) expression (green) for all mice. (r, t) Left: sample fluorescent image showing optical fibre location and ArchT (r) or eYFP (t) expression (green) in NAcLat terminals in the VTA (TH: tyrosine hydroxylase (red), IPN: interpeduncular nucleus; scale bars 500 µm). Middle and right: schematic overviews showing locations of optical fibres and ArchT (r) or eYFP (t) expression (green) for all mice (MM: medial mammillary nuclei). All data represented as mean ± SEM. Source Data
Extended Data Fig. 4
Extended Data Fig. 4. Optogenetic stimulation of NAcLat → VTA does not promote hedonic feeding behavior in HFD mice.
(a) Left: sample fluorescent image showing ChR2 expression (green) in the NAcLat (DAPI: blue; aca: anterior commissure; scale bar 500 µm). Right: schematic overview showing ChR2 expression (green) in NAcLat for all HFD mice. (b) Left: sample fluorescent image showing optical fibre location and ChR2 expression (green) in NAcLat terminals in the VTA (TH: tyrosine hydroxylase (red), IPN: interpeduncular nucleus; scale bar 500 µm). Middle and right: schematic overviews showing locations of optical fibres for all HFD mice (MM: medial mammillary nuclei). (c) 24-hour food deprivation (FD) in HFD mice significantly increases jelly consumption in the primed-feeding trial when compared to sated HFD mice (***p < 0.001, nsated = 15 mice, nFD = 12 mice, two-sided unpaired Student’s t-test). (d) Optogenetic stimulation of NAcLat→VTA does not increase consumption of jelly in food deprived HFD mice (nHFD-ChR2 = 6 mice, nHFD-eYFP = 6 mice, 2-way RM ANOVA). (e) Body weight measured at different time points when ChR2 or eYFP mice were subjected to HFD and then returned to REG (1-way RM ANOVA, nChR2 = 8 mice, neYFP = 7 mice). Blue arrows indicate time points when optogenetic experiments shown in Fig. 2g were performed. (f) Consumption of jelly during the primed-feeding trial in mice expressing ChR2 (black) or eYFP (grey) when mice were removed from HFD and returned to REG; tested at different time points over 3 weeks (***p = 0.0005, nChR2 = 8 mice, neYFP = 7 mice, 2-way RM ANOVA with Holm-Šídák’s multiple comparisons test; refers to Fig. 2g). All data represented as mean ± SEM, except panel (c), which is presented as median, 25th percentile and 75th percentile. Source Data
Extended Data Fig. 5
Extended Data Fig. 5. Gene expression analysis in NAcLat → VTA cells from REG and HFD mice.
(a) Volcano plot displaying differential gene expression in NAcLat→VTA cells between REG and HFD mice. Light blue data points indicate genes that are significantly differentially expressed in cells from REG versus HFD mice (i.e., absolute value of Log2 (fold change) > 1 and p < 0.05). The 10 genes with the highest expression differences are highlighted. (b) Each column displays the relative expression of GABAergic (Gad1, Gad2, VGAT) and glutamatergic (Vglut1, Vglut2) cell markers as well as dopamine receptors (Drd1, Drd2) for individual NAcLat→VTA cells (rows) from REG (left) and HFD (right) mice. Statistical significance was determined using a two-sided hypothesis. Values were not corrected for multiple comparisons. (c) Violin plots show expression of individual genes: Gad1 (left), Gad2 (middle), Drd1 (right) (REG: n = 23 cells from n = 10 mice, HFD: n = 20 cells from n = 11 mice). (d) Volcano plots showing differential gene expression between NAcLat→VTA cells from REG and HFD mice (REG: n = 23 cells from n = 10 mice, HFD: n = 20 cells from n = 11 mice). Points plotted indicate genes that are (red) or are not (gray) significantly differentially expressed between REG and HFD cells. Individual plots show subsets of genes related to feeding (top left), synaptic transmission (top middle), ion channels (top right), endoplasmic reticulum (ER) (bottom left), vesicle fusion (middle right), transcription factors (bottom right). Genes marked in red are significantly differentially regulated by the criteria: absolute value of log2 (fold change) > 1 and p < 0.05. Statistical significance was determined using a two-sided hypothesis. Values were not corrected for multiple comparisons. (e) Violin plots showing expression of selected genes expressed in NAcLat→VTA cells that significantly differ between REG and HFD mice. Top: Npas4, PDE3b, Vti1a, ACHE; bottom: Syt12, Syn3, Pdk2, doc2b (REG: n = 23 cells from n = 10 mice, HFD: n = 20 cells from n = 11 mice). (f) Each row displays the relative expression of genes for individual NAcLat→VTA cells from REG (top) and HFD (bottom) mice. Each column displays a single gene that is related to synaptic signalling and feeding (587 genes are sorted according to median value; NTS gene is in the 98 percentiles, highlighted by vertical line) (REG: n = 23 cells from n = 10 mice, HFD: n = 20 cells from n = 11 mice). (g) Schematic showing retrograde tracing of VTA-projecting NAcLat neurons in NTS-Cre mice crossed to an Ai14 (tDTomato) reporter mouse line. Cholera toxin subunit B (CTB, 300 nl) was injected into the VTA. CTB and tdTomato (i.e., NTS, red) labeling was analysed in the NAcLat using a confocal microscope. Inset: fluorescent image showing injection-site of CTB (green) in the VTA (DAPI: blue; IPN: interpeduncular nucleus; scale bar 1 µm). (h) High magnification confocal images showing DAPI (blue), NTS (red), and CTB (green) labelling in the NAcLat. White arrows indicate example NAcLat cells that express tdTomato (i.e., NTS-expressing) and are labelled with CTB (i.e., projecting to VTA); scale bar 50 µm. Inset: ~76% of NAcLat→VTA cells express NTS (yellow, 469/618 cells, n = 3 mice). (i) Schematic showing injection of red fluorescent retrobeads into the VTA in different cohorts of mice that had been on a regular diet (REG) or 4 weeks of high-fat diet (HFD) or have been switched from 4 weeks of HFD back to a regular diet for 3 weeks (OFF). Ten days later, brains were extracted, and NTS mRNA expression was assessed in retro-beads labelled NAcLat cells using in situ hybridization (ISH). (j) Confocal images showing DAPI (blue), NTS (green) and retrobead (red) labeling in the NAcLat for REG, HFD, OFF mice. White boxes indicate areas of magnification (scale bars 50 µM in lower magnification (left) and 10 µm in higher magnification (right) images). (k) Body weight of mice on regular diet (REG), 4 weeks on high-fat diet (HFD), or 4 weeks on HFD and then returned to regular diet for 3 weeks (OFF) (n = 4 mice in each group, ***p < 0.001; 1-way ANOVA with Holm-Šídák’s multiple comparisons test). (l) Mean NTS pixel intensity in retrobead-positive NAcLat cells for REG, HFD, and OFF mice (REG: n = 148 cells from n = 4 mice, HFD: n = 76 cells from n = 4 mice, OFF: n = 123 cells from n = 4 mice, ***p < 0.001, Kruskal-Wallis test with Dunn’s multiple comparisons test). (m) Averaged mean pixel intensity for NTS for each mouse from different diet groups (n = 4 mice in each group, *p = 0.018, Kruskal-Wallis test with Dunn’s multiple comparisons test). All data represented as mean ± SEM. Source Data
Extended Data Fig. 6
Extended Data Fig. 6. In vitro and ex vivo recordings of NTS release using ntsLight1.1.
(a) Left: ntsLight1.1 expression in hippocampal primary cultured neurons; scale bar 50 µm. Middle: ntsLight1.1 fluorescence increased in a NTS concentration dependent manner (pink). The dose-response sensitivity of ntsLight1.1 fluorescence was reduced in the presence of NTS receptor antagonist (green, 100 nM SR142948A). Right: ntsLight1.1 increased fluorescence in response to NTS but with low response to Dynorphin, GABA, Neuromedin N, and other neuropeptides/transmitters. (NTS: Neurotensin n = 8, OXT: Oxytocin, n = 4; SST: Somatostatin, n = 4; NPY: Neuropeptide Y, n = 4; CCK: Cholecystokinin, n = 4; DYN: Dynorphin, n = 4; 5HT: Serotonin (5-hydroxytryptamine), n = 4; ACh: Acetylcholine, DA: Dopamine, n = 4; NMU-25: Neuromedin U-25, n = 3; GABA: Gamma-aminobutyric acid) n = 3 (***p < 0.001; 1-way RM ANOVA with Holm-Šídák’s multiple comparisons test). (b) Left: experimental design for ex vivo imaging of NTS release using ntsLight1.1. AAV-hSyn-ChrimsonR-tdTomato was injected into the NAcLat and ntsLight1.1 was injected into the VTA of REG mice. Six weeks later, acute VTA slices were prepared for fluorescent imaging using an epifluorescence macroscope. Right: light stimulation and imaging protocol. (c) Left: sample microscopy image of Chrimson (red) injection site in NAcLat from a REG mouse (DAPI: blue; aca: anterior commissure; scale bar 500 µm). Right: schematic showing Chrimson expression in NAcLat across all REG mice. (d) Left: sample microscope image showing ntsLight1.1 recordings in REG mice highlighting the region of interest (ROI) in the lateral VTA (scale bar 200 µm). Middle: example ntsLight1.1 fluorescence extracted from the lateral VTA of REG mice injected with Chrimson in the NAcLat and ntsLight1.1 in the VTA (middle-left) or for REG mice injected with only ntsLight1.1 in the VTA (middle-right). Right: only mice expressing both Chrimson in the NAcLat and ntsLight1.1 in the VTA show increased fluorescence during red light stimulation (*p = 0.035, Chrimson and ntsLight1.1: n = 13 slices from n = 5 mice; ntsLight1.1 only: n = 3 slices from n = 1 mouse; two-sided unpaired Student’s t-test). (e) Left: mean ntsLight1.1 response to 1 s of 20 Hz red light stimulation with varying pulse durations. ntsLight1.1 fluorescence reaches apparent max fluorescence at ≥ 10 ms pulse duration. Right: ntsLight1.1 fluorescence corresponds with max activation of Chrimson rather than max amount of light delivered to VTA (**p = 0.0012, effect of pulse duration on ntsLight1.1 AUC, n = 3 slices from n = 1 mouse, 2-way RM ANOVA). (f) Recordings from a single VTA ROI expressing ntsLight1.1. 20 Hz continuous blue (473 nm) light alone, which only excites ntsLight1.1 (left), and 1 s of 20 Hz red (685 nm) light alone, which only activates Chrimson (middle), and did not increase ntsLight1.1 fluorescence. Only the combination of blue and red light increased ntsLight1.1 fluorescence (right). (g) Left: sample image from ntsLight1.1 imaging experiment showing ROI in lateral VTA for measuring ntsLight1.1 fluorescence in a HFD mouse (scale bar 200 µm). Right: graph showing that red light stimulation of NAcLat terminals in VTA increased ntsLight1.1 fluorescence in the lateral VTA of HFD mice. (h) Left: Sample microscopy image of Chrimson (red) injection site in NAcLat from a HFD mouse (DAPI: blue; aca: anterior commissure; scale bar 500 µm). Right: schematic showing Chrimson expression in NAcLat across all HFD mice. All data represented as mean ± SEM. Source Data
Extended Data Fig. 7
Extended Data Fig. 7. In vitro and in vivo recordings of NTS release using ntsLight2.0.
(a) Left: a simulated structure of ntsLight2.0. Right: schematic showing ntslight2.0 activation in that NTS binding induces a conformational change in the sensor that increases fluorescence. (b) Excitation and emission spectrum of ntsLight2.0 with (green) or without (black) NTS. (c) ntsLight2.0 fluorescence increased in a NTS concentration dependent manner (pink). The dose-response sensitivity of ntsLight2.0 fluorescence was reduced proportionally to the concentration of the added NTS receptor antagonist (green, 100 nM (squares) and 1 nM (triangles) SR142948A). (d) Experimental design for ntsLight2.0 validation using in vivo fibre photometry (FIP). Top: sensor only: ntslight2.0 was injected into the VTA. Bottom: Chrimson only: AAV-hSyn-ChrimsonR-tdTomato was injected into the NAcLat). Not shown: sensor + Chrimson: AAV-hSyn-ChrimsonR-tdTomato was injected into the NAcLat and ntslight2.0 was injected into the VTA. Optical fibres were implanted above the NAcLat and above the VTA in all experimental conditions. Six weeks later, NTS release was recorded in the VTA using fibre photometry during optogenetic simulation of the NAcLat in head-fixed mice. (e) ntsLight2.0 transients recorded in the VTA 5 s before and 20 s after 3-second opto-stimulation of the NAcLat in mice for 3 different experimental conditions: sensor only (red, n = 4 mice), Chrimson only (blue, n = 5 mice), and sensor + Chrimson (grey, n = 5 mice). Data are Z-scored, averaged across 30 trials, t = 0 s indicates stimulation onset. (f-h) AUCs for sensor only (red), Chrimson only (blue), and both sensor and Chrimson (gray) groups when analysing the time period before stimulation onset (f) (−3 to −1 s), during laser stimulation (g) (0 to 2 s) and after stimulation (h) (3 to 5 s). Mice expressing both sensor and Chrimson showed a significant increase in the Z-scored average of ntsLight2.0 fluorescence in the 3 to 5 s interval (***p < 0.0009, nsensor = 4 mice, nChrimson = 5 mice, nsensor+Chrimson = 5 mice, one-way ANOVA). (i) ntslight2.0 transients during optogenetic stimulation of NAcLat with different durations (red: 1 s, black: 3 s, blue: 5 s stimulation duration). Experiments were performed in mice expressing both sensor and Chrimson (n = 5 mice). The graph displays Z-scored averages from n = 30 trials. (j-l) AUCs for 1 s (red), 3 s (grey) and 5 s (blue) stimulation duration analysed before stimulation onset (j) (−3 to −1 s), during laser stimulation (k) (0 to 2 s), and after stimulation (l) (3 to 5 s). 3 s light stimulation produced the largest increase in ntsLight2.0 transients in the 3 to 5 s interval (*p1–3 = 0.03, *p3–5 = 0.034, n = 5 mice, one-way ANOVA). (m) ntsLight2.0 transients during optogenetic stimulation of NAcLat with different stimulation intensities (red: 0.5 mW, blue: 5 mW, black: 10 mW). Experiments were performed in mice expressing both sensor and Chrimson (n = 5 mice). The graph displays Z-scored averages from n = 30 trials. (n-p) AUCs for 0.5 mW (red), 5 mW (blue), and 10 mW (grey) stimulation intensities analyzed before stimulation onset (n) (−3 to −1 s), during laser stimulation (o) (0 to 2 s) and after stimulation (p) (3 to 5 s, p). 10 mW stimulation produced the largest ntsLight2.0 transients in the 3–5 s interval (**p = 0.009, n = 5 mice, one-way ANOVA). (q) Mice received either DMSO or NTS R1 antagonist SR48692 injections (IP, 5 mg/kg) 10 min prior to FIP recordings. Experiments were performed in sensor + Chrimson mice (n = 5 mice) with n = 30 trials of NAcLat Chrimson stimulation (3 s, 10 mW, 20 Hz) while recording ntsLight2.0 transients in the VTA. (r) ntsLight2.0 transients recorded in the VTA 5 s before and 20 s after 3 s optogenetic stimulation of NAcLat in DMSO (back) and SR48692 (blue) injected animals. The graph displays Z-scored averages from n = 30 trials. Experiments were performed in mice expressing both sensor and Chrimson (n = 5 mice). (s-u) AUCs before (s) (−3 to −1 s), during (t) (0 to 2 s), and after (u) (3 to 5 s) NAcLat stimulation in mice injected with DMSO (gray) or SR48692 (blue). In SR48692 injected animals, ntsLight2.0 transients were significantly decreased in the 3 to 5 s interval compared to DMSO injected mice (*p = 0.0358, n = 5 mice, two-sided paired Student’s t-test). (v) Experimental design. Baseline ntsLight2.0 signal was recorded for 20 min. Subsequently, mice were injected with either saline (day 1, IP) or an NTS R1 agonist (PD149163, 0.3 mg/kg IP, on day 2) and ntslight2.0 transients were recorded for an additional 50 min. (w) ntslight2.0 transients (averaged Z-scores) in response to saline (black) and PD149163 (red) injections. Experiments were performed in mice expressing both sensor and Chrimson (n = 5 mice). (x) AUCs before (−500 to 0 s, gray) and after (1500 to 2000 s, red) injection of saline or PD149163. PD149163, but not saline, significantly increased ntsLight2.0 transients in the VTA (*p = 0.017, n = 5 mice, 2-way RM ANOVA with Šídák’s multiple comparisons test). (y) Body weight of mice on REG and 4 weeks of HFD mice for experiment shown in Fig. 3n–p, ***p = 0.0001, n = 5 mice, two-sided paired Student’s t-test). (z) Individual ntsLight2.0 traces during optogenetic stimulation of NAcLat in REG (left, black) and HFD (right, orange) mice (refers to Fig. 3o; n = 5 mice). (aa) Left: sample fluorescent image of Chrimson (red) injection site in NAcLat and optical fibre location (DAPI: blue; aca: anterior commissure; scale bar 500 µm). Right: schematic showing Chrimson expression (red) in NAcLat and optical fibre locations across all mice. (ab) Left: Sample fluorescent image showing optical fibre location and ntsLight2.0 expression (green) in the VTA (IPN: interpeduncular nucleus; scale bar 500 µm). Right: schematic overviews showing locations of optical fibres and Chrimson expression in NAcLat terminals (green) in the VTA across all mice. All data represented as mean ± SEM (error bars or shading). Source Data
Extended Data Fig. 8
Extended Data Fig. 8. NTS release in the NAcLat → VTA pathway promotes hedonic feeding behavior.
(a) Top: experimental design showing AAV-DIO-ChR2 (ChR2) or AAV-DIO-eYFP (eYFP) injections into the NAcLat and implantation of an optical fiber above the VTA in NTS-CRE mice. Bottom: experimental timeline of acute feeding assay (same as in Fig. 2). (b) Optogenetic stimulation (20 Hz, 5 ms pulses) of NAcLat terminals in the VTA increased jelly consumption in NTS-Cre mice expressing ChR2 but not eYFP (***p = 0.0009, nChR2 = 6 mice, neYFP = 4 mice, 2-way RM ANOVA with Holm-Šídák’s multiple comparisons test). (c) NTS-Cre mice expressing ChR2 and eYFP consumed similar amounts of jelly during the primed-feeding trial (p > 0.05, nChR2 = 6 mice, neYFP = 4 mice, two-sided unpaired Student’s t-test). (d) No significant change in mean velocity of mice in the open-field test during stimulation of NAcLat inputs for both NTS-Cre mice expressing ChR2 or eYFP (p > 0.05, nChR2 = 6 mice, neYFP = 4 mice, 2-way RM ANOVA). (e-f) Histology for optogenetic stimulation in NTS-Cre mice. Left: sample fluorescent images showing ChR2 (e) or eYFP (f) expression (green) in the NAcLat and the corresponding schematics for ChR2 or eYFP expression analyses across all animals. Right: sample fluorescent images showing optical fibre locations and ChR2-expressing NAcLat terminals (green) in the VTA and the corresponding schematics across all mice (scale bars 500 µm, DAPI: blue, TH: red, aca: anterior commissure). (g) NTS-FLOX mice expressing Cre and ChR2 (NTSKO) or ChR2 (NTSCTRL) in the NAcLat consumed similar amounts of jelly during the primed-feeding trial (p > 0.05, nNTS-KO = 8 mice, nNTS-CTRL = 10 mice, two-sided unpaired Student’s t-test). (h) Jelly consumption during the primed-feeding trial for mice in the opto-pharmacology experiment. There was no significant difference in jelly consumption between ChR2 and eYFP mice infused with either saline or SR142948A (p > 0.05, nChR2 = 11 mice, neYFP = 15 mice, 2-way RM ANOVA). (i, j) Histology for opto-pharmacology experiment. Left: sample fluorescent images showing ChR2 (i) or eYFP (j) expression (green) in the NAcLat and the corresponding schematics across all mice. Right: sample fluorescent images showing cannula implant locations and ChR2 (i) or eYFP (j) expressing NAcLat terminals in the VTA and the corresponding schematics across all mice (scale bars 500 µm, DAPI: blue, TH: red; MM: medial mammillary nuclei, IPN: interpeduncular nucleus, aca: anterior commissure). All data represented as mean ± SEM. Source Data
Extended Data Fig. 9
Extended Data Fig. 9. HFD does not induce changes in NTS function in VTA dopamine and GABAergic cells.
(a) Top: schematic of experimental design. Red fluorescent retrobeads were injected into the NAcLat. One week later, retrobeads-labelled VTA cells were recorded in acute brain slices using perforated-patch. Bottom: injection-site of beads (red) in NAcLat (DAPI: turquoise; scale bar 500 µm). (b) Sample recordings from a retrobead-labelled VTA dopamine (DA) cell from REG (left) and HFD (right) mice in ACSF (black) and during bath application of neurotensin (NTS, 1 µM, turquoise). (c) Firing rate of NAcLat-projecting VTA DA neurons before (ACSF, black) and during NTS (turquoise) application for REG and HFD mice (***p = 0.001 effect of NTS, no effect for diet type, nREG = 11 cells from n = 5 mice, nHFD = 8 cells from n = 6 mice, 2-way RM ANOVA with Holm-Šídák’s multiple comparisons test). (d) Top: schematic showing that perforated patch recordings were performed from tdTomato-expressing cells in the VTA of GAD2-Cre mice crossed to an Ai14 reporter mouse line. Bottom: sample fluorescent image showing tdTomato expression (i.e., GAD2-expressing cells, red) in the VTA (DAPI: blue, TH: green; scale bar 500 µm, IPN: interpeduncular nucleus). (e) Sample perforated patch recording from a VTA GABA cell before (ACSF) and after bath application of neurotensin (1 µM NTS, turquoise). (f) Application of 1 µM NTS did not significantly change the firing rate of VTA GABA cells when compared to baseline (p = 0.4191, n = 9 cells from n = 5 mice, two-sided paired Student’s t-test). (g) Experimental design to analyse TH and NtsR1 mRNA expression in VTA cells from REG and HFD mice. (h) Sample microscopy image of fluorescent in situ hybridization showing DAPI (blue), NtsR1 (neurotensin receptor 1, red), and TH (tyrosine hydroxylase, green) in the VTA. Scale bar: 20 µm. (i) Fraction of VTA TH-positive cells that co-localize with NtsR1 for REG and HFD mice (p = 0.62, nREG = 42 slices from n = 9 mice, nHFD = 41 slices from n = 11 mice, two-sided unpaired Student’s t-test). (j) Schematic of experimental design showing that red fluorescent retrobeads were injected into the NAcLat and patch clamp recordings were performed from beads-containing VTA dopamine (DA) cells in mice subjected to a regular (REG) or high-fat diet (HFD). (k) No significant difference in the membrane capacitance of beads-labelled VTA DA cells between REG and HFD mice (p = 0.99, REG: n = 23 cells from n = 5 mice, HFD: n = 25 cells from n = 3 mice, two-sided unpaired Student’s t-test). (l) No significant difference in the membrane resistance of beads-labelled VTA DA between REG and HFD mice (p = 0.27, REG: n = 23 cells from n = 5 mice, HFD: n = 25 cells from n = 3 mice, two-sided unpaired Student’s t-test). (m) No significant difference in the resting membrane potential of beads-labeled VTA DA cells between REG and HFD mice (p = 0.23, REG: n = 23 cells from n = 5 mice, HFD: n = 25 cells from n = 3 mice, two-sided unpaired Student’s t-test). (n) Whole cell, current clamp recordings of beads-labeled VTA DA neurons from REG (left) and HFD (right) mice. Note, slow regular discharge and sag components induced by injections of hyperpolarizing currents of increasing amplitudes (steps of −25 pA). (o) No significant difference in the sag amplitudes, a measure for the hyperpolarization-activated current (Ih), recorded in beads-labeled VTA DA neurons from REG and HFD mice, analysed at −150 pA (p = 0.125, REG: n = 15 cells from n = 6 mice, HFD: n = 13 cells from n = 4 mice, two-sided unpaired Student’s t-test). (p) Whole cell, current clamp responses to 2-sec ramps of depolarizing currents ( + 150 pA) of beads-labelled VTA DA neurons from REG (left) and HFD (right) mice. (q) No significant difference in the number of spikes evoked by injecting depolarizing current ramps in beads-labelled VTA DA neurons between REG and HFD mice (p = 0.77, REG: n = 11 cells from n = 5 mice, HFD: n = 10 cells from n = 3 mice, 2-way RM ANOVA). All data represented as mean ± SEM. Source Data
Extended Data Fig. 10
Extended Data Fig. 10. NTS overexpression in HFD mice.
(a) Schematic of experimental design to selectively overexpress NTS in NAcLat→VTA neurons. A retrograde virus (RG-EIAV-Cre) was injected into the VTA and either Cre-dependent NTS overexpression virus (AAV-DIO-NTS-OE; see methods for detailed virus description) or Cre-dependent fluorescent reporter (AAV-DIO-mCherry) was injected into the NAcLat. Mice were subjected to HFD, and 4 weeks later, NTS expression was analysed in NAcLat→VTA neurons using RNAscope. (b) Sample images of fluorescent in situ hybridization in the NAcLat of NTS-OE and mCherry control HFD mice (DAPI: grey, NTS: green; aca: anterior commissure; scale bars 200 µm (5x), 50 µm (20x)). (c) Significantly increased expression of NTS in the NAcLat of HFD mice injected with NTS-OE virus when compared to mice injected with a mCherry control vector (***p < 0.001, nmCherry = 14 slices from n = 7 mice, nNTS-OE = 8 slices from n = 4 mice, two-sided unpaired Student’s t-test). (d) Top: schematic of experimental design showing that a retrograde virus (RG-EIAV-Cre) was injected into the VTA, and either AAV-DIO-NTS-OE or AAV-DIO-mCherry was injected into the NAcLat. 4 weeks later, these mice were injected with AAV-hSyn-Chrimson into the NAcLat and AAV9-hSyn-ntsLight1.1 into the VTA. Mice were then subjected to HFD, and 4 weeks later, ntsLight1.1 was measured in acute VTA slices. Right: sample ntsLight1.1 fluorescent traces in response to Chrimson stimulation (685 nm) extracted from the lateral VTA in slices from HFD mice expressing mCherry (top) or NTS-OE (bottom) in the NAcLat→VTA pathway (nmCherry = 10 slices from n = 2 mice; nNTS-OE = 9 slices from n = 2 mice; refers to Fig. 5a–c). (e) Left: schematic showing experimental design to optogenetically stimulate the NAcLat→VTA pathway in HFD mice that overexpress NTS in the NAcLat→VTA pathway. Mice were injected with RG-EIAV-Cre into the VTA and either AAV-DIO-NTS-OE or AAV-DIO-mCherry into the NAcLat. 4 weeks later, these mice were injected with AAV-hSyn-ChR2 into the NAcLat and an optical fibre was implanted above the VTA. Mice were then subjected to HFD and optogenetic experiments were performed 4 weeks later. Right: bar graph showing increased jelly consumption during primed-feeding trial in HFD mice that overexpress NTS in the NAcLat→VTA pathway when compared to mCherry control mice (*p = 0.017, nNTS-OE = 6 mice, nmCherry = 8 mice, two-sided unpaired Student’s t-test; refers to data shown in Fig. 5d, e). (f) Analysis of the effects of varying experimental conditions (i.e., baseline body weight (BW) of mice, housing scheme, and virus expression time) on BW in two additional cohorts of NTS-OE and control mice. Left (cohort 1): mice expressing mCherry or NTS-OE in the NAcLat→VTA pathway were maintained for 10 weeks on a regular diet before switching to HFD (mean BW at beginning of experiment: mCherry: 29.82 ± 0.37 g, n = 4 mice; NTS-OE: 28.2 ± 1.48 g, n = 5 mice, injected at age of 10 weeks). Right (cohort 2): mice injected with different viruses are mixed within the same home cages (mean BW at beginning of experiment: mCherry: 23.3 ± 1.22 g, n = 9 mice; NTS-OE: 23.4 ± 0.97 g, n = 10 mice, injected at age of 6 weeks). Despite varying experimental conditions across the two cohorts, NTS-OE mice on HFD consistently gained significantly less weight compared to mCherry control mice when switching from regular to high-fat diet (*p = 0.0117, **p = 0.0023, ***p < 0.0003, 2-way RM ANOVA with Holm-Šídák’s multiple comparisons test). (g) Left: schematic of experimental design showing that a retrograde virus (RG-EIAV-Cre) was injected into the VTA and either AAV-DIO-NTS-OE or AAV-DIO-mCherry was injected into NAcLat. Mice were subjected to HFD and 4 weeks later the body temperature was measured. Right: bar graph showing no significant difference between the body temperatures of NTS-OE and mCherry mice (p = 0.61, nmCherry = 9 mice, nNTS-OE = 14 mice, two-sided unpaired Student’s t-test; same mice as shown in Fig. 5f). (h) Sample behavioural motifs obtained using DeepLabCut from HFD mice that are freely behaving in an open-field chamber. These mice either express mCherry (top) or overexpress NTS (bottom) in the NAcLat→VTA pathway (refers to Fig. 5j–l). (i) Representative trajectories of mice expressing NTS-OE (top) and mCherry (bottom) in NAcLat→VTA in an open-field chamber for 10 min. (j) Bar graph showing distance travelled for NTS-OE (grey) and mCherry control (blue) groups during open-field exploration (p < 0.001, nmCherry = 11 mice, nNTS-OE = 9 mice, two-sided unpaired Student’s t-test). (k) Bar graph showing percentage of time mice spent in the centre of the open-field chamber for NTS-OE (grey) and mCherry control (blue) groups (*p = 0.018, nmCherry = 11 mice, nNTS-OE = 9 mice, two-sided unpaired Student’s t-test). All data represented as mean ± SEM. Source Data

Similar articles

Cited by

References

    1. Lowe, M. R. & Butryn, M. L. Hedonic hunger: a new dimension of appetite? Physiol. Behav.91, 432–439 (2007). - PubMed
    1. Davis, J. F. et al. Exposure to elevated levels of dietary fat attenuates psychostimulant reward and mesolimbic dopamine turnover in the rat. Behav. Neurosci.122, 1257 (2008). - PMC - PubMed
    1. Arcego, D. M. et al. Chronic high-fat diet affects food-motivated behavior and hedonic systems in the nucleus accumbens of male rats. Appetite153, 104739 (2020). - PubMed
    1. de Wouters d’Oplinter, A. et al. Gut microbes participate in food preference alterations during obesity. Gut Microbes13, 1959242 (2021). - PMC - PubMed
    1. Reichelt, A. C., Morris, M. J. & Westbrook, R. Cafeteria diet impairs expression of sensory-specific satiety and stimulus-outcome learning. Front. Psychol.5, 852 (2014). - PMC - PubMed

MeSH terms

LinkOut - more resources