. 2025 May;641(8065):1319-1328.
doi: 10.1038/s41586-025-08794-6. Epub 2025 Mar 26.

Plasticity of the mammalian integrated stress response

Affiliations

Plasticity of the mammalian integrated stress response

Chien-Wen Chen et al. Nature. 2025 May.

Abstract

An increased level of phosphorylation of eukaryotic translation initiation factor 2 subunit-α (eIF2α, encoded by EIF2S1; eIF2α-p) coupled with decreased guanine nucleotide exchange activity of eIF2B is a hallmark of the 'canonical' integrated stress response (c-ISR)1. It is unclear whether impaired eIF2B activity in human diseases including leukodystrophies2, which occurs in the absence of eIF2α-p induction, is synonymous with the c-ISR. Here we describe a mechanism triggered by decreased eIF2B activity, distinct from the c-ISR, which we term the split ISR (s-ISR). The s-ISR is characterized by translational and transcriptional programs that are different from those observed in the c-ISR. Opposite to the c-ISR, the s-ISR requires eIF4E-dependent translation of the upstream open reading frame 1 and subsequent stabilization of ATF4 mRNA. This is followed by altered expression of a subset of metabolic genes (for example, PCK2), resulting in metabolic rewiring required to maintain cellular bioenergetics when eIF2B activity is attenuated. Overall, these data demonstrate a plasticity of the mammalian ISR, whereby the loss of eIF2B activity in the absence of eIF2α-p induction activates the eIF4E-ATF4-PCK2 axis to maintain energy homeostasis.


Conflict of interest statement

Competing interests: E.J. is an employee of and holds equity in Moderna Inc. All other authors declare no competing interests.

Figures
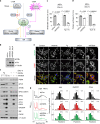
Fig. 1
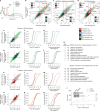
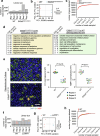
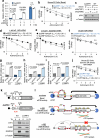
Fig. 1. Decreased eIF2B activity induces s-ISR.
a, The prevailing view is that ISR induction downstream of the eIF2α kinases represents a linear response comprising increased eIF2α-p and subsequent decrease in eIF2B activity (c-ISR, orange). It is not clear whether decreased eIF2B activity without an increase in eIF2α-p such as in leukodystrophies (s-ISR, pink) induces comparable ISR to the eIF2α-p induction (orange). b,f, Western blot analysis of the denoted proteins, in MEFs treated with the indicated shRNAs for specified times or Tg (400 nM). In f, Tg (0 h) refers to control MEFs, not treated with control shRNAs. Representative images (n = 3 independent experiments) are shown. c,d, eIF2B GEF activity (c) and protein synthesis measured by [35S]methionine and cysteine incorporation (d) in MEFs expressing control shRNA or Eif2b5 shRNA, or treated with Tg (400 nM, 1 h), as indicated. Statistical significance was determined by two-tailed Student’s t-test. Data are presented as mean ± s.e.m. (n = 3 independent experiments). e, Fluorescence micrographs of MEFs treated with a vehicle (control), sodium arsenite (1 mM, 1 h) or Tg (400 nM, 1 h) or expressing control or Eif2b5 shRNAs (day 4), and stained with the indicated antibodies. Scale bar, 20 μm for all images. Representative images are shown (n = 3 independent experiments). g, Left, polysome profile tracings obtained by monitoring absorbance (254 nm) across 10–50% sucrose gradients. Right, distribution of the indicated mRNAs on polysomes isolated from MEFs expressing control, Eif2b5 or Eif2b5 + Eif4e shRNAs, as indicated. Representative data (n = 3 independent experiments) are shown. Source Data
Fig. 2
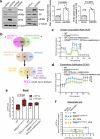
Fig. 2. s-ISR is positively regulated by eIF4E.
a, Absorbance profiles (254 nm) of 10–50% sucrose gradients from indicated cell lines. bd, Scatter plots comparing fold change (FC) in total and polysome-associated mRNA quantified using RNA sequencing in shEif2b5 versus shCon (b), shEif2b5 + shEif4e versus shEif2b5 (c) and Tg 16 h versus control (d) MEFs. Differentially regulated genes are colour-coded (legend under d). All genes are shown in Supplementary Table 1. ep, Comparisons of how genes controlled at the level of mRNA abundance (ej) or translation (kp) are regulated in shEif2b5 versus shCon (eg,km) and shEif2b5 + shEif4e versus shEif2b5 (hj,np) MEFs. For each gene set and comparison, a scatter plot (e,h,k,n) and empirical cumulative distribution plots for log2[FC] in total (f,i,l,o) and polysome-associated (g,j,m,p) mRNA are shown. Gene sets are colour-coded as indicated in d, and background (non-affected) genes are shown in grey. Shifts in the distribution of fold changes for gene sets relative to the background were assessed for total (f,i,l,o) and polysome-associated (g,j,m,p) mRNA using the Mann–Whitney U-test and indicated P < 0.01 for all comparisons. q, Gene Ontology (GO) enrichment analysis for regulated genes (through mRNA abundance or translation) from b. The number of genes (No.) identified in selected GO pathways is indicated, and all GO pathways are shown in Supplementary Table 2. r, Proliferation of MEFs expressing the indicated shRNAs was determined by counting live cells (trypan blue exclusion). P value was determined by the two-tailed Student’s t-test. Data are presented as mean ± s.e.m. Inset shows representative western blot analysis of levels of the indicated proteins. (n = 3 independent experiments). Source Data
Fig. 3
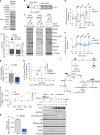
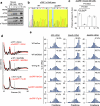
Fig. 3. VWM-associated EIF2B5 mutation induces s-ISR.
a, Diagram of Eif2b5 exon 4. Eif2b5R191H/R191H mutation is indicated. b, Protein synthesis was monitored by [35S] methionine and cysteine labelling in WT and Eif2b5R191H/R191H mouse ES cells. P values, two-tailed Student’s t-test (n = 5 independent experiments, mean ± s.e.m.). c,e, Western blot of the indicated proteins from WT and Eif2b5R191H/R191H mouse ES cells and MEFs treated with a vehicle or Tg (400 nM) for the specified durations (n = 3 independent experiments) (c), and quantification (e). PCK2 levels were normalized to α-tubulin and quantified. P values, two-tailed Student’s t-test. Data are presented as mean ± s.e.m. (n = 3 independent experiments). d, DESeq2 analysis comparing WT and Eif2b5R191H/R191H mouse ES cell mRNA levels quantified by RNA sequencing. An ATF4-regulated gene signature is shown in red. Green arrows indicate selected differentially expressed genes (all regulated genes are shown in Supplementary Table 1). f, Schematic of [13C]glucose tracing in the CAC (black-filled circles indicate [13C]-labelled carbons) showing that serine m + 2 can be produced via oxaloacetate (OAA) m + 2, and serine m + 3 can be produced from 3-phosphoglycerate (3PG) m + 3. g, Steady-state levels of indicated metabolites in Eif2b5R191H/R191H cells compared to WT (n = 3 independent experiments). Data depict fold change of Eif2b5R191H/R191H versus WT. h, Fractional enrichment of serine m + 2 and serine m + 3 in WT mouse ES cells or Eif2b5R191H/R191H mouse ES cells treated with CPA (200 μM, 16 h) or after 48-h washout. P values, two-tailed Student’s t-test. Data are presented as mean ± s.e.m. (n = 6 independent experiments). DMSO, dimethylsulfoxide. i,j, Schematic of CPA treatment and washout (i), and quantification (j). Fold change of bioenergetic capacity of WT and Eif2b5R191H/R191H cells with or without exposure to CPA (200 μM) for 16 h, followed by 48 h washout. P values, two-tailed Student’s t-test. Data are presented as mean ± s.e.m. (n = 4 independent experiments). k, Venn diagrams of comparisons of regulated genes under indicated experimental conditions and published datasets. A total of 26 identified genes are involved in amino acid metabolism (KEGG (Kyoto Encyclopedia of Genes and Genomes) analysis). Source Data
Fig. 4
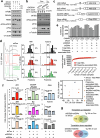
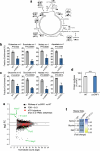
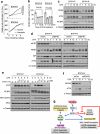
Fig. 4. Atf4 uORF1 is required for s-ISR.
a,l, Representative western blot of the indicated proteins in mouse ES cells expressing control (shCon), eIF2Bε or eIF2Bε + eIF4E shRNAs (a) or in MEFs treated with glucose (0–25 mM, 16 h) (l). LiCl (10 mM) or Torin 1 (250 nM) was used for the specified final hours of the 16 h treatment with glucose-free medium (l) (n = 3 independent experiments). b, Schematic of the Atf4 uORF1 start codon mutation in mouse ES cells. c, Representative western blot of the indicated proteins in WT or ΔuORF1 mouse ES cells treated with vehicle or Tg (400 nM) for the specified times (left and middle) or expressing control or Eif2b5 shRNAs (right). (n = 3 independent experiments). d,e, OCR (d) and ECAR (e) of WT and ΔuORF1 mouse ES cells. Oligomycin (Oligo), FCCP, rotenone (Rot) and antimycin A (AA), and monensin (Mon) were injected as indicated. P values, two-tailed Student’s t-test. Data are presented as mean ± s.e.m. (n = 5 independent experiments). f,g, Quantification of ATP production from oxidative phosphorylation (J ATP ox) or glycolysis (J ATP glyc) (f) and fold change in bioenergetic capacity (g) in WT versus ΔuORF1 mouse ES cells. P values, two-tailed Student’s t-test. Data are presented as mean ± s.e.m. (n = 5 independent experiments). h, J ATP glyc and J ATP ox values in WT and ΔuORF1 mouse ES cells for basal (square), FCCP (triangle) or monensin (circle) conditions. Maximum theoretical boundaries for J ATP ox (horizontal line) and J ATP glyc (vertical line) are indicated. P values, two-tailed Student’s t-test. Data represent mean ± s.e.m. (n = 5 independent experiments). i, Schematic of [13C]glutamine tracing in the CAC. PEP m + 3 and asparagine m + 4 are labelled by carbons derived from [13C]glutamine. CS, citrate synthase. j,k, Fractional enrichment (j) and relative ion abundance (k) of PEP m + 3 in ΔuORF1 cells versus WT. P values, two-tailed Student’s t-test. Data represent mean ± s.e.m. (n = 3 independent experiments). Source Data
Extended Data Fig. 1
Extended Data Fig. 1. Decreased eIF2B activity in the absence of stress-induced eIF2α-p reprograms the transcriptome in an eIF4E-dependent manner.
(a,b) Western blot analysis of the indicated proteins in cell extracts isolated from MEFs expressing control or Eif2b5 shRNAs (a,b); or active GADD34 (ΔNT, N-terminus truncated protein) or inactive GADD34 (ΔCT, C-terminus truncated protein) (b) and treated with Tg (400 nM) or Sodium Arsenite (1 mM) for specified times (a). Representative blots are shown (n=3 independent experiments). (c) Diagrams of 5′ UTR uORFs of mouse Atf4, Atf5, Gadd34 and Chop mRNAs. The stop codon of uORF1 in the Gadd34 5′ UTR overlaps with the initiation codon of uORF2 by one nucleotide. (d) Polysome profile tracings obtained by monitoring absorbance (254 nm) across the 10–50% sucrose gradients (left) in indicated cells. Distribution of Atf5 and Tuba1a mRNAs on polyribosomes (right) isolated from MEFs expressing control, Eif2b5, or Eif2b5 + Eif4e shRNAs, as indicated. Representative experiment is shown (n = 3 independent experiments). (e) (Top) A bar plot shows an overall number of reads that are assigned to genes after all pre-processing steps and summarization with htseq-count for each sample. (Middle) the number of detected genes from total RNA sequencing libraries (red) and polysome-associated RNA sequencing libraries (brown) across sampled sequencing depths. (Bottom) projection of samples in principal components 1 and 2, with samples shaped according to library type (circle: polysome-associated RNA; triangle: total RNA) and colored according to condition (control samples are grey, shEif2b5+shEif4e ivory and shEif2b5 orange). (f) RT-qPCR analysis of total RNA isolated from MEFs expressing shRNAs for Eif2b5, Eif2b5 + Eif4e or Control (shCon). RT-qPCR data for the indicated genes (Supplementary Table 1) were normalized to the values of the Gapdh mRNA. Statistical significance was determined using the two-tailed Student’s t-test. Data are presented as mean ± SEM (n = 3 independent experiments). (g) Venn diagrams showing overlapping genes between indicated experimental conditions. Data set of Tg 16 h versus Con in MEFs were obtained from raw data analysis of a previous publication. The experimental conditions and the number of genes in each experimental condition along with the mode of regulation are shown. Source Data
Extended Data Fig. 2
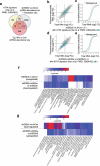
Extended Data Fig. 2. Co-depletion of eIF4E reverses expression of genes affected by eIF2Bε depletion that are enriched in overlapping biological processes.
(a) Venn diagrams show the number of overlapping genes from the indicated experimental conditions,. (b-e) Scatterplots of fold changes quantified by RNA sequencing data from total and polysome-associated RNA in MEFs expressing shEif2b5 versus shCon (b) and shEif2b5+shEif4e versus shEif2b5 (d). Cumulative distributions for log2 fold changes (log2FC) in mRNA abundance (c, e) of background (grey) and selected Atf4 gene signature (blue). Statistical analysis comparing Atf4 gene signature to background using Mann-Whitney U-test indicated p<0.001 for both comparisons (c, e). ATF4-regulated genes are indicated in blue, (f) Heatmaps comparing the 20 most significant biological processes (gene ontology) enriched among genes upregulated upon eIF2Bε depletion versus those downregulated upon eIF2Bε and eIF4E co-depletion (g) Heatmaps comparing the 20 most significant biological processes (gene ontology) enriched among genes downregulated upon eIF2Bε depletion versus those upregulated upon eIF2Bε and eIF4E co-depletion. A full list of genes can be found in Supplementary Table 3.
Extended Data Fig. 3
Extended Data Fig. 3. Quality control of RNA sequencing data in mouse ES Cells from ΔuORF1 and Eif2b5R191H/R191H cells. Deficiency in oligodendrocyte differentiation in Eif2b5R132H/R132H OPCs.
(a, f) Bar plots showing the total number of reads that are assigned to genes after all pre-processing steps and summarization with htseq-count for each sample in Eif2b5R191H/R191H mouse ES Cells (a) and in ΔuORF1 mouse ES Cells (f). (b, g) Projection of samples in principal components 1 and 2, with samples shaped according to replicate and colored according to condition [control samples in red and Eif2b5R191H/R191H (b) and ΔuORF1(g) in blue]. (c, h) Number of detected genes from total RNA sequencing libraries across sampled sequencing depths in mouse ES Cells from Eif2b5R191H/R191H cells (c), and ΔuORF1 mouse ES Cells (h) colored in brown and controls colored in red. (d) GO enrichment analysis of upregulated (yellow) or downregulated (green) cohorts of genes in Eif2b5R191H/R191H versus WT mouse ES Cells RNA sequencing data shown in Fig. 3d. Number of genes identified in selected GO individual pathways are shown and all GO pathways are shown in Supplementary Table 4. FDR, False Discovery Rate. (e) (Left) iPSCs-derived OPCs from WT or Eif2b5R132H/R132H mice were differentiated for 72 h with thyroid hormone (T3) and stained for the intermediate oligodendrocyte marker protein O1 and late/mature oligodendrocyte marker protein, myelin basic protein (MBP). (Right) Quantification demonstrates dramatically lower mature oligodendrocytes in Eif2b5R132H/R132H cells. Data is presented as the mean +/− standard deviation. Outliers were statistically identified and removed using ROUT test with Q = 1%, and p-values were calculated using a Welch’s unpaired, two tailed t-test. (n = 3 independent experiments, ≥16 wells). Both outlier tests and p-value calculation were performed in GraphPad Prism v10.4.1. Source Data
Extended Data Fig. 4
Extended Data Fig. 4. Bioenergetic characterization of the mouse ES Cells harboring VWMD-associated eIF2Bε mutation (Eif2b5R191H/R191H).
(a) Western blot analysis of the indicated proteins in MEFs expressing control, Eif2b5, Eif4e or Eif2b5 + Eif4e shRNAs. Representative experiments (n = 3 independent experiments) are shown (Left two panels). Quantification of PCK2 protein levels [over α-tubulin or mitochondrial protein citrate synthase (CS)] in shRNA-treated MEFs (right two panels) (n = 4 independent experiments). p-values, two-tailed Student’s t-test. Error bars represent S.E.M values (Right panels). (b) Venn diagrams showing numbers of overlapping genes between the indicated experimental conditions. “Split-ISR eIF4E-dependent”: genes whose mRNA abundance or translation mode is increased by sheIF2Bε depletion and reversed by eIF4E co-depletion. “NE-mitos”: nuclear-encoded mitochondrial genes. “NE-mitos split-ISR”: genes that overlap between the “Split-ISR eIF4E-dependent” and the “NE-mitos” categories. “ATF4 target genes” ATF4 regulated genes. PCK2 is a nuclear encoded mitochondrial protein. (c, d) Oxygen consumption rate (OCR, c) and extracellular acidification rate (ECAR, d) in WT and Eif2b5R191H/R191H cells treated with CPA (200 μM) or a vehicle for 16 h, followed by 48 h washing-out of CPA (n = 4 independent experiments). (e) Quantitation of ATP production rate from OXPHOS (J ATP ox) or glycolysis (J ATP glyc) in WT and Eif2b5R191H/R191H cells treated with a vehicle or CPA (200 μM) for 16 h, followed by 48 h washing-out of CPA (n = 4 independent experiments). Data are presented as mean ± SEM (c-e). (f) Bioenergetic plot of WT and Eif2b5R191H/R191H cells treated as described in panels c-e. Data points represent J ATP values (J ATP glyc on the x-axis and J ATP ox on the y-axis) measured under basal conditions (square), and following injections of FCCP (triangle), and Monensin (circle). p-values, two-tailed Student’s t-test. Data are presented as mean ± SEM (n = 4 independent experiments). Source Data
Extended Data Fig. 5
Extended Data Fig. 5. uORF1 translation is required for ATF4 induction in s-ISR but is largely dispensable for c-ISR.
(a) Western blot analysis of the indicated proteins in cell extracts isolated from mouse ES Cells or from MEFs, treated with Tg (400 nM) for specified durations. Representative blots are shown (n = 3 independent experiments). (b) Sanger sequencing traces of genomic DNAs from WT and ΔuORF1 mouse ES Cells. Only the uORF1 region is shown. (c) Protein synthesis (incorporation of [35S]-cysteine and methionine into proteins) in ΔuORF1 mouse ES Cells treated with Tg (400 nM) for the indicated times. p-values, two-tailed Student’s t-test. Data are presented as mean ± SEM (n = 5 independent experiments). (d) Polysome profile tracings obtained by monitoring absorbance (254 nm) across the 10-50% sucrose gradients from WT or ΔuORF1 mouse ES Cells expressing control (top panel) or eIF2Bε shRNA (middle panel), or treated with Tg (400 nM, 9 h) (bottom panel). Representative experiments are shown (n = 3 independent experiments). (e) Distribution of indicated mRNAs across polysome fractions (from d) isolated from WT or ΔuORF1 mouse ES Cells expressing control or Eif2b5 shRNAs, or treated with Tg (400 nM, 9 h) was determined by RT-qPCR. Representative experiments are shown (n = 3 independent experiments). Source Data
Extended Data Fig. 6
Extended Data Fig. 6. Loss of basal ATF4 levels in ΔuORF1 mouse ES Cells impairs cellular bioenergetics.
(a) Schematic of [3-13C]-pyruvate tracing in the citric acid cycle. Black-filled circles indicated [13C]-labelled carbons. Citrate m+1, Glutamine m+1, Succinate m+1, Malate m+1, and Aspartate m+1 refer to isotopomers of metabolites after incorporation of one [13C]-labelled carbon following one turn of the citric acid cycle. Citrate m+2, Glutamine m+2, Succinate m+2, Malate m+2, and Aspartate m+2, refer to isotopomers of metabolites after incorporation of two [13C]-labelled carbons after two turns of the citric acid cycle. (b, c) Fractional enrichment of the indicated metabolites (m+1, b and m+2, c) in WT and ΔuORF1 mouse ES Cells. p-values, two-tailed Student’s t-test. Data are presented as mean ± SEM (n = 4 independent experiments). (d) Protein synthesis rates in WT and ΔuORF1 mouse ES Cells were measured using the incorporation of [35S]-cysteine and methionine. No statistical significance (n.s.) according to the two-tailed Student’s t-test (n = 3 independent experiments). (e) Differential expression analysis (DESeq2) of comparing mRNA expression quantified by RNA sequencing in WT versus ΔuORF1 mouse ES Cells. Genes belonging to the ATF4-regulated signature are shown in red. Selected differentially expressed genes are indicated in green. All regulated genes can be found in Supplementary Table 1. (f) Steady state levels of metabolites (serine, glycine, PEP) in ΔuORF1 mouse ES Cells compared to WT (n = 3 independent experiments). Data depicts fold change of ΔuORF1 mouse ES Cells relative to WT. Source Data
Extended Data Fig. 7
Extended Data Fig. 7. uORF1 protects Atf4 mRNA from degradation by nonsense-mediated decay, while uORF2 regulates ATF4 protein synthesis in c-ISR.
(a) RT-qPCR analysis of Atf4 mRNA levels in WT or ΔuORF1 mouse ES Cells expressing control or Eif2b5 shRNAs and treated with vehicle or Tg (400 nM) for specified times. Data were normalized to Gapdh mRNA values. p-values were determined using two-tailed Student’s t-test. Data are presented as mean ± SEM (n = 3 independent experiments). (b, d-f, j) Parental WT or ΔuORF1 mouse ES Cells (b), or WT or ΔuORF1 mouse ES Cells expressing control or UPF1 shRNAs (d-f), or WT or ΔuORF1 mouse ES Cells treated with Tg (400 nM, 9 h) (j) were exposed to actinomycin D (10 μg/ml) for the indicated durations, to determine the half-life (t1/2) of the denoted mRNAs. mRNA levels were quantified by RT-qPCR analysis. Values were normalized to Gapdh mRNA and expressed as percentages of the levels before the addition of actinomycin D. t1/2 of mRNAs was calculated using exponential decay function. P-values; n.s., not significant evaluated by the two-tailed Student’s t-test (n = 3 independent experiments). (c,k) Western blot analysis of the indicated proteins in cell extracts isolated from WT or ΔuORF1 mouse ES Cells expressing control or Upf1 shRNAs (c) or WT and ΔuORF2 NIH3T3 cells treated with Tg (400 nM, 9 h) (k). Representative blots are shown (n = 3 independent experiments). The cartoon in (k) indicates CRSPR-Cas9 mutation in the Atf4 gene introduced in the initiation codon of uORF2. (g-i) RT-qPCR analysis of the indicated mRNAs in mouse ES Cells expressing control (shCon) or Upf1 (shUpf1) shRNAs. P-values, two-tailed Student’s t-test. Data are presented as mean ± SEM (n = 3 independent experiments). (l) Model for regulation of Atf4 mRNA translation and mRNA decay of the Atf4 mRNA via the functions of uORF1: (i) In the absence of stress, eIF4E-mediated translation of uORF1 in part inhibits translation of uORF2 and stabilizes Atf4 mRNA. (ii) When eIF2B activity is decreased in the absence of stress, translation of the Atf4 main ORF increases. Decreased uORF2 translation initiation and translation of the main Atf4 ORF, protects the Atf4 mRNA from NMD. (iii) Under chronic ER stress, Atf4 main ORF translation is independent of eIF4E and dependent on eIF3d. The ribosomes (40S in red and 60S in yellow) are shown translating the mRNA as an 80S or as recycling/scanning units. The engagement of NMD via the translation of uORF2 is depicted as the mechanism of regulation of Atf4 mRNA abundance (indicated by the black lines). The degradation symbol has been sized as per the expected outcome of Atf4 mRNA decay under each condition. Source Data
Extended Data Fig. 8
Extended Data Fig. 8. Distinct mechanisms of regulation of c-ISR and s-ISR in response to inhibitors of eIF4E or CK2 activity.
(a) Representative western blot analysis of the indicated proteins in ΔuORF1 and WT mouse ES Cells treated with the inhibitor of PP1 phosphatase (containing GADD34 as a subunit), Salubrinal (15 μM, 5 h; (n = 3 independent experiments). (b,f) Western blot analysis of the indicated proteins in MEFs expressing Con (shCon) or Eif2s2 (shEif2s2) shRNAs and treated with Tg (400 nM) (b) or Torin1 (250 nM) (f) for the specified times. Representative blots are shown (n = 3 independent experiments). (c-d) Representative western blot analyses of the indicated proteins in MEFs treated with Tg (400 nM) for the specified durations, or MEFs expressing the indicated shRNAs, without (c) or with Tg-treatment (d) (n = 3 independent experiments). Tg-treated MEFs in (c) were used as a positive control for induction of the c-ISR. (e) Representative western blot analysis of the indicated proteins in MEFs expressing control (shCon) or Eif2b5 shRNA (shEif2b5) and treated with (Tg-400 nM) or Torin1 (250 nM) of the specified durations (n = 3 independent experiments). (g-h) Western blot analysis for the indicated proteins in MEFs expressing control (shCon) or Eif2b5 shRNA (shEif2b5) and treated with 4EGI-1 (200 μM) (g) Tg (400 nM) or SGC-CK2-1 (5 μM) (h) for the specified times. Representative western blots are shown (n = 2 independent experiments). Lower eIF2α-p levels are consistent with GADD34 induction (h, 4th lane). (i) Representative western blot analyses of the indicated proteins in MEFs treated with glucose (0 or 2.5 mM, 16 h). LiCl (10 or 25 mM) or Torin1 (250 nM) were used for the specified final hours of the 16 h treatment with medium containing 2.5 mM glucose (n = 3 independent experiments).
Extended Data Fig. 9
Extended Data Fig. 9. S-ISR is induced in Herceptin-resistant but not Herceptin-sensitive human breast cancer cells in response to ER stress. Schematic of the model contrasting s-ISR versus c-ISR.
(a) Relative proliferation rates (estimated by CellTiter-Glo) of Herceptin-sensitive parental (BT474-P, upper) and Herceptin-resistant (BT474-R, lower) human breast cancer cells, treated with Herceptin (20 μg/ml) for the indicated times (n = 3 independent experiments). (b) eIF2B GEF activity was measured in BT474-P and BT474-R cells treated with CPA (100 μM) for the specified durations. Statistical significance in (a,b) was determined by the two-tailed Student’s t-test. n.s., not significant evaluated by the two-tailed Student’s t-test (n = 3 independent experiments). Data are presented as mean ± SEM (n = 3 independent experiments). (c-f) Western blot analysis of the denoted proteins in BT474-P and BT474-R cells treated with CPA (100 μM) and/or control (shCon), EIF4E (shEIF4E) or DDX3X (shDDX3X) shRNAs as indicated. Torin1 was added for the last hour of treatment with CPA for the indicated concentrations and durations (e). Representative western blots are shown (n = 3 independent experiments). (g) Schematics contrasting “split” (s-) and “canonical” (c-) ISR. (Left) S-ISR: Decreased eIF2B activity in the absence of stress-induced eIF2α-p. S-ISR translational reprogramming comprises only a subset of the c-ISR targets including ATF4, but not GADD34. The mechanism of ATF4 mRNA translational control is highly dependent on uORF1 but eIF2α-p independent (purple). (Right) ER stress induces PERK-mediated eIF2α-p which decreases eIF2B activity and strongly suppresses global protein synthesis. This is followed by induction of the ATF4-GADD34 axis, which dephosphorylates eIF2α-p and establishes the chronic c-ISR program. The levels of eIF2α-p control the amplitude of adaptive mRNA translation via mechanisms that include translation of uORF-containing mRNAs (e.g., ATF4 and GADD34-orange). In contrast to s-ISR, the c-ISR is less dependent on the function of eIF4E. Source Data
Extended Data Fig. 10
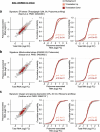
Extended Data Fig. 10. S-ISR gene expression alterations are distinct from those observed during other stress conditions.
(a-c) (Left), Scatter plots from anota2seq analysis of shEif2b5 versus control cells (left panels) wherein genes whose expression was identified as induced (orange) or suppressed (red) following (a) ER stress (polysome-profiling), (b) mitochondrial stress (proteomics) or (c) oxygen and glucose deprivation (ribosome profiling) are indicated together with genes showing unaltered expression (background in grey). (Middle and Right) empirical cumulative distribution function (ECDF) plots of log2fold-changes (log2FC) from the sheIF2Bε versus control comparison for polysome-associated mRNA (middle panels) and total RNA (right panels) for stress-sensitive gene sets and background genes (grey). Significant shifts in the distribution of gene sets relative to the background were assessed using a two sided Wilcoxon rank-sum test and p-values are indicated.

References

    1. Costa-Mattioli, M. & Walter, P. The integrated stress response: from mechanism to disease. Science368, eaat5314 (2020). - PMC - PubMed
    1. Abbink, T. E. M. et al. Vanishing white matter: deregulated integrated stress response as therapy target. Ann. Clin. Transl. Neurol.6, 1407–1422 (2019). - PMC - PubMed
    1. Advani, V. M. & Ivanov, P. Translational control under stress: reshaping the translatome. Bioessays41, e1900009 (2019). - PMC - PubMed
    1. Wang, X. & Proud, C. G. The role of eIF2 phosphorylation in cell and organismal physiology: new roles for well-known actors. Biochem. J.479, 1059–1082 (2022). - PubMed
    1. Dever, T. E., Ivanov, I. P. & Hinnebusch, A. G. Translational regulation by uORFs and start codon selection stringency. Genes Dev.37, 474–489 (2023). - PMC - PubMed

MeSH terms

Substances

LinkOut - more resources