. 2025 May;641(8065):1225-1237.
doi: 10.1038/s41586-025-08746-0. Epub 2025 Mar 26.

Connectome-driven neural inventory of a complete visual system

Aljoscha Nern  1 Frank Loesche #  1 Shin-Ya Takemura #  1 Laura E Burnett #  1 Marisa Dreher #  1 Eyal Gruntman #  2 Judith Hoeller #  1 Gary B Huang #  1 Michał Januszewski #  3 Nathan C Klapoetke #  1 Sanna Koskela #  1 Kit D Longden #  1 Zhiyuan Lu #  1 Stephan Preibisch #  1 Wei Qiu #  1 Edward M Rogers #  1 Pavithraa Seenivasan #  1 Arthur Zhao #  1 John Bogovic  1 Brandon S Canino  1 Jody Clements  1 Michael Cook  1 Samantha Finley-May  1 Miriam A Flynn  1 Imran Hameed  1 Alexandra M C Fragniere  4   5 Kenneth J Hayworth  1 Gary Patrick Hopkins  1 Philip M Hubbard  1 William T Katz  1 Julie Kovalyak  1 Shirley A Lauchie  1 Meghan Leonard  1 Alanna Lohff  1 Charli A Maldonado  1 Caroline Mooney  1 Nneoma Okeoma  1 Donald J Olbris  1 Christopher Ordish  1 Tyler Paterson  1 Emily M Phillips  1 Tobias Pietzsch  1 Jennifer Rivas Salinas  1 Patricia K Rivlin  1 Philipp Schlegel  4   5 Ashley L Scott  1 Louis A Scuderi  1 Satoko Takemura  1 Iris Talebi  1 Alexander Thomson  1 Eric T Trautman  1 Lowell Umayam  1 Claire Walsh  1 John J Walsh  1 C Shan Xu  1 Emily A Yakal  1 Tansy Yang  1 Ting Zhao  1 Jan Funke  1 Reed George  1 Harald F Hess  1 Gregory S X E Jefferis  4   5 Christopher Knecht  1 Wyatt Korff  1 Stephen M Plaza  1 Sandro Romani  1 Stephan Saalfeld  1 Louis K Scheffer  1 Stuart Berg  6 Gerald M Rubin  7 Michael B Reiser  8
Affiliations

Connectome-driven neural inventory of a complete visual system

Aljoscha Nern et al. Nature. 2025 May.

Abstract

Vision provides animals with detailed information about their surroundings and conveys diverse features such as colour, form and movement across the visual scene. Computing these parallel spatial features requires a large and diverse network of neurons. Consequently, from flies to humans, visual regions in the brain constitute half its volume. These visual regions often have marked structure-function relationships, with neurons organized along spatial maps and with shapes that directly relate to their roles in visual processing. More than a century of anatomical studies have catalogued in detail cell types in fly visual systems1-3, and parallel behavioural and physiological experiments have examined the visual capabilities of flies. To unravel the diversity of a complex visual system, careful mapping of the neural architecture matched to tools for targeted exploration of this circuitry is essential. Here we present a connectome of the right optic lobe from a male Drosophila melanogaster acquired using focused ion beam milling and scanning electron microscopy. We established a comprehensive inventory of the visual neurons and developed a computational framework to quantify their anatomy. Together, these data establish a basis for interpreting how the shapes of visual neurons relate to spatial vision. By integrating this analysis with connectivity information, neurotransmitter identity and expert curation, we classified the approximately 53,000 neurons into 732 types. These types are systematically described and about half are newly named. Finally, we share an extensive collection of split-GAL4 lines matched to our neuron-type catalogue. Overall, this comprehensive set of tools and data unlocks new possibilities for systematic investigations of vision in Drosophila and provides a foundation for a deeper understanding of sensory processing.


Conflict of interest statement

Competing interests: The authors declare no competing interests.

Figures

Fig. 1
Fig. 1. The neurons of a male Drosophila visual system.
a, Overview of the male Drosophila CNS volume dataset, with the ventral nerve cord (VNC) attached. Scale bar, 200 µm. b, This study describes the complete connectome and neuron inventory of the right optic lobe (blue). The optic lobe comprises five neuropils: the lamina (LA), the medulla (ME), the accessory medulla (AME), the lobula (LO) and the lobula plate (LOP). Scale bars, 100 µm (frontal view), 50 µm (side view) or 20 µm (optic lobe neuropils). c, The four main groups of cell types, with an example provided for each (values in parentheses indicate the number of cells out of the total number of the cell type). Scale bar, 50 µm. d, The number of cells and input–output synaptic connections for the 160 cell types with the largest contributions to total connectivity in the visual system connectome (all types are presented in Supplementary Table 1). Fewer than 100 cell types account for most cells and connections. e, Summary of the inventory, with the number of cell types, cells and connections aggregated by cell-type groups. The inventory includes a small group of ‘other’ cell types with minimal connectivity. k, thousand; M, million. f, Summary as in e, but grouped by the five optic lobe neuropils. Counts include cell types and cells with >2% of their synapses contained in a neuropil; many cells contribute to multiple neuropils. Contributions from the neurons in each cell-type group are shown as pie charts. These counts summarize the connectome in the optic-lobe:v1.1 neuPrint database and reflect the asymmetry between the completion percentage for presynapses and postsynapses (Extended Data Table 1). A few cell types are undercounted (estimated 2,777 cells from the lamina and 459 R7 and R8 photoreceptors, see Methods for details). g, Input–output connectivity in the optic lobe for all cell types in the inventory. VPNs generally have more input cells than output cells, whereas VCNs show the opposite connectivity pattern (excluding central brain connectivity). The example cell types from c and others with unusually high and low connectivity are highlighted.
Fig. 2
Fig. 2. Sorting neurons into types on the basis of morphology and connectivity.
a, Examples of 15 cell types that occur once per column in nearly every column of the visual system, shown across a slice of the optic lobe. Scale bar, 20 µm. b, Mi9 and Mi4, shown as LM images (Methods) and EM reconstructions, are an example of neurons that appear similar but can be distinguished by morphology in nearly all cases. Scale bar, 10 µm. c, Mi4 and Mi9 can also be distinguished by connectivity, as shown for selected input and output cell types. d, After cell typing all neurons, connectivity clustering sorted the cells assigned to the 15 columnar cell types shown in a into clearly distinct (note the lack of colour gradient) groups of approximately equal cell counts (numbers in the red squares), thereby confirming their assignments. e, Example of sorting cells with similar shapes. Two representatives of each of Pm2a and Pm2b neurons, medulla amacrine cells with highly similar morphology. D, dorsal; P, posterior. Scale bar, 50 µm. f, The distribution of cell volume is similar for Pm2a and Pm2b neurons, which makes sorting these cells on the basis of this metric unreliable. g, Pm2a and Pm2b are sorted into two types by connectivity clustering (Extended Data Figs. 3 and 4), which reveals two overlapping mosaics. The first two principal components (PC1 and PC2) of the centres of mass of their synapse locations are plotted. This visualization preserves the spatial relationships of the cells and aligns with major anatomical axes (in this case, the medulla). h, Selected distinguishing input and output connections for Pm2a and Pm2b cells. Individual points represent connections of single Pm2a and Pm2b neurons; horizontal line represents the median for each group. The combination of consistent connectivity differences with overlapping cell distributions supports the split into two types. i, Most cell types can be distinguished by their strong connections. Shown is the proportion of unique combinations of connections across all types for the indicated number of top-ranked connections.
Fig. 3
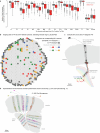
Fig. 3. Capturing the architecture of the visual system by analysing the connectivity of key cell types.
a, The lenses of the fly eye form a hexagonal grid and are mapped onto a hexagonal coordinate system in the medulla. p and q denote hexagonal coordinates; h and v indicate the horizontal and vertical axes of the eye, respectively. The darker hexagons correspond to locations along the equator of the eye (determined by counting photoreceptors in the corresponding lamina cartridges). The 15 columnar neuron types in Fig. 2a were assigned to each coordinate. Completely grey hexagons indicate a medulla location that has been assigned a set of all 15 neurons (Methods and Supplementary Table 3). The colour-coded wedges indicate cells of a type missing at that medulla location, most of which are along the edge. b, Schematic of the process used for creating columns and layers. Lobula-plate columns were based on sets of T4 neurons assigned to each Mi1 (Extended Data Fig. 6). c, Layer boundaries defined on the basis of the synapse distributions of marker cell types, as established from LM images. For each type, we show the distribution of presynapses and postsynapses across depths together with LM images of single-neuron clones (in green; rotated and rescaled to match the top and bottom of the neuropil in light grey). The lobula-plate image shows the neuropil (grey, nc82-antibody) and the axon terminals of the T4 neurons (magenta). The horizontal blue and orange lines indicate the distribution cut-off around a peak that defines each boundary. The collection of these parameters defines all layer boundaries, shown in grey. d, Layers and columns shown as volumes superimposed on greyscale EM data. Scale bars, 20 µm (top left) and 5 µm (bottom right). e, The spatial distribution of postsynapses by neuropil and column (Extended Data Fig. 7).
Fig. 4
Fig. 4. Diversity of neurotransmitter signalling in the visual system.
a, Schematic of the process for predicting neurotransmitters. Using previous neurotransmitter expression measurements in 59 cell types as ground-truth data, a visual geometry group (VGG)-style deep neural network was trained to classify the following presynaptic neurotransmitters: acetylcholine (ACh), glutamate (Glu), GABA, histamine (His), dopamine (Dop), octopamine (OA) and serotonin (5HT). b, Performance of the per-synapse predictions evaluated on held-out synapses. Cell types, cells and synapses used for training and testing are tabulated. c, Synapse predictions were aggregated for cell-type-level consensus neurotransmitter assignments. Individual points represented the predicted fraction per cell; boxes indicate the median and quartiles. Here 16 TmY cell types are shown. Example morphologies are below. Three cell types (indicated by asterisks) were included in the training data, and predictions for six types (names in bold) were confirmed using new validation data. Scale bar, 50 µm. d, Images of driver lines for the six TmY cell types that were assayed for neurotransmitter marker gene expression,, showing the cell marker for GAL4 (top), markers for ChAT, VGlut and GAD1 (middle), and merged images (bottom), and the assigned neurotransmitter below. Asterisks mark specific cell bodies as reference points to facilitate comparisons across the three rows. Scale bar, 20 µm. e, Performance of neurotransmitter predictions for 78 cell types evaluated using experimental data (Supplementary Table 5). f, Neurotransmitter types counted for synapses, cells, cell types and cell-type groups. In these and subsequent summaries, synapse-level predictions are inherited from consensus (cell-type-level) neurotransmitters. Cells with limited predictions were scored as ‘unclear’. g, Spatial distribution of presynapses with neurotransmitter classifications. The colour scale is normalized for each column. h, Median size for ONIN and ONCN cell types. i, Linear regression estimates of synaptic fan-out, the cell-type averaged ratio of output connections to presynapses, grouped by neurotransmitter. The whiskers indicate the median and quartiles for each transmitter. The fan-out values are significantly different between ACh and GABA (P < 0.001) and Glu and GABA (P < 0.001), but not between ACh and Glu (P ≈ 0.83), ANCOVA.
Fig. 5
Fig. 5. Quantitative summary of anatomy and connectivity of visual system neurons.
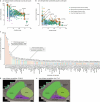
a, Examples of 13 cell types associated with the Dm3 line amacrine neurons, including their major inputs and outputs (summarized in a circuit diagram). Scale bar, 50 µm. PVLP, posterior ventrolateral protocerebrum. b, Each row presents the quantified summary for each cell type. Far left, number and location (right or left (R|L) hemisphere) of neurons and consensus (see Methods) neurotransmitter prediction. Left, distribution of presynapses and postsynapses across neuropil layers. Right, the top five connected input and output cell types by contributed connectivity (colour shade indicates rank). Far right, cell size measured by depth (mean number of innervated columns). Data are scaled by row, indicated with vertical scale bars. The visual cell types are summarized in the Cell Type Catalogue (Supplementary Fig. 1). c, The stripe-like patterns of Dm3 types each cover the entire M3 layer, shown here in separate panels and neurons coloured by their dominant column coordinate. Each inset shows two individual Dm3 cells of one type from adjacent coordinates and selected connected TmY cells. Scale bars, 40 µm. d, The number of Dm3c and TmY4 cells innervating each column as a spatial distribution by neuropil. Similar plots for all visual cell types are in the Cell Type Explorer web resource. e, Left, the relationship between the number of cells (population size) and the average number of columns innervated by each cell (cell size) in the medulla (for types with >50 synapses and >5% of total connectivity therein). Colour coded by the coverage factor (per-type average number of cells per column). The 1× line indicates onefold coverage, and cell types above or below cover the whole medulla with more or fewer neurons per column, respectively. Right, selected cell types show coverage factors for different tiling arrangements: Dm4 (about 1) and Dm20 (about 5). Scale bars, 10 µm (top) and 50 µm (bottom). f, The per-cell-type density of medulla coverage, comparing the column innervation of the population to its convex area. Types close to the diagonal (for example, MeVP10) densely cover the medulla, whereas types above the diagonal (for example, l-LNv) feature sparser coverage. Medulla layers are shown face-on. Scale bar, 50 µm.
Fig. 6
Fig. 6. Visual projection neurons.
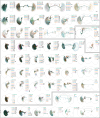
All VPNs that connect the right optic lobe with the central brain or the contralateral optic lobe. We first divided the approximately 4,500 VPNs into the 352 types shown here, and then placed them into 51 groups of morphologically similar types. These groups are based on the main neuropil they receive their optic lobe inputs in, whether they project to the ipsilateral or contralateral central brain or the contralateral optic lobe, and other aspects of their morphology. Unilateral cells, neurons without projections that cross the midline, are mainly shown in half-brain panels, and most cells with arbours in both brain hemispheres are shown in full-brain views. Each panel includes the names of the cell types (colour-matched to the rendered neurons) and the number of individual cells of each type (in parentheses). Types without a number are present once per brain hemisphere. Detailed morphology of the optic lobe neuropils can be found in the Cell Type Catalogue (Supplementary Fig. 1). Scale bar, 50 µm.
Fig. 7
Fig. 7. Genetic driver lines for targeting visual-system neuron types and summary of connectivity.
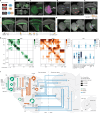
a, The genetic intersection of the expression patterns of two hemidrivers (AD and DBD) produces a split-GAL4 driver line selective for cells of interest. We report 582 split-GAL4 lines matched to >300 EM-defined cell types (Supplementary Table 6). be, LM features used for LM–EM matching. b, Pattern of a split-GAL4 line expressed in LPLC4 VPNs, with some off-target VNC expression. Scale bars, 100 µm. c, LM image of LPLC4 neurons (driver as in b) registered to a standard brain (JRC2018U, grey) (left) or overlayed with registered skeletons of all EM-reconstructed LPLC4 neurons (right). Scale bar, 50 µm. d, EM (left) and LM (MCFO, right) images of LPLC4 cells. e, Segmented, registered LM image of an MCFO-labelled LPLC4 neuron with a slice of the template brain (showing a different view than bd to emphasize the layer patterns) above a summary (Fig. 5b) of the innervation of LPLC4. f, Selected split-GAL4 lines for ONINs and ONCNs. Layer patterns of genetically labelled cell populations with a neuropil marker (anti-Brp). Corresponding layers are indicated on the LM images and EM summary figures (see e). Scale bar, 20 µm. g, Selected split-GAL4 labelled VPNs and VCNs (overlays with registered EM skeletons). h, Connectivity between regions, including optic lobe layers, quantified as a weighted sum (Methods) for the ONIN, ONCN and VPN groups. The colour code reflects contributions to total connectivity. Inter-region connections were ranked, binned and coloured by their contribution to the cumulative sum. Standard brain region names are abbreviated and grouped (see Methods and ref. ). i, Schematic of the main conduits for visual information flow in and between brain regions based on h. Arrows are scaled with the number of connections between regions and represent entries in the highest 50% (darkest colours), plus a few prominent connections below this threshold. Major contributing cell types are indicated for each arrow, and optic lobe layers and several central brain regions are grouped in this summary. Scale bars, 10 µm (optic lobe), 20 µm (central brain) or 50 µm (inset).
Extended Data Fig. 1
Extended Data Fig. 1. Proofreading summary and quality control for the optic lobe connectome.
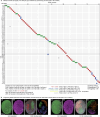
(a) Performance of synapse detection. The precision/recall curve for presynapses (black), and connections (pre-post pairs, red). Precision is the probability that a detected feature was human-annotated, and recall is the percentage of features found by human-annotators that were also identified by our trained network (described in Methods: EM volume synapse identification). (b) The estimated proportion of time spent in the major phases of proofreading, totaling 2584 proofreader/neuroanatomist days expended on this dataset, approximately ten proofreader-years. (c) The distribution of downstream capture fraction for the neurons in the optic lobe connectome, excluding the lamina and those with <30 presynapses. (d) The distribution of synapse counts for all 9.6 M remaining unmerged fragments (‘orphans’) in the optic lobe, excluding the lamina. (e) The completeness fraction for the postsynapses in medulla, by column is approximately uniform, showing no spatial gradients. (f) The postsynapse completeness fraction is shown as a scatter plot for all three major optic lobe neuropils, where each point represents the data for one column ROI (see Fig. 3). The superimposed line plots the median fraction across all columns, which are nearly identical to the completeness fraction for each neuropil (Extended Data Table 1). (g) The mean synapse counts, by cell type, for neurons belonging to cell types with downstream connections in most medulla columns (at least 30 output connections in each of at least 600 medulla columns), sorted into two groups based on R7 output connection count in each column. The map on the right shows the positions of the medulla columns making up these two groups. This summary shows that the data limitations of the R7 and R8 photoreceptors (see Methods and Extended Data Fig. 5) do not extend to other cell types, with the exception of Dm9, a cell type with extensive physical contact with R7/R8. (h) Spatial distribution of selected connections to illustrate that the missing photoreceptor connections, R8 in this example, do not extend to other cell types with connections in similar columns and layers of the medulla. Connections of all R7 and R8 types were combined for analysis in g,h.
Extended Data Fig. 2
Extended Data Fig. 2. Connectivity Summary for the visual cell types.
Related to Fig. 1. (a) The mean number of connected cells (in the optic lobe, counting all connections > 1) as a function of the number of cells per type for all cell types in the inventory. Several examples are highlighted, as in Fig. 1g. R1-6 are indicated with an asterisk since they are undercounted in the data set (see Methods). (b) Mean number of connected cell types (in the optic lobe, counting all connections > 1) as a function of number of cells per type. The same cells are highlighted as in (a). (c) The cell type pairs with the largest contributions to connections outside of the main optic lobe neuropils. The plot shows the number of synaptic connections outside the primary optic lobe neuropils and the fraction they contribute to all connections between the indicated cell type pairs. The connections are directional, and the pairs are ordered as A-B, where A is presynaptic to B. Many of these connections are in the outer or inner chiasm. Only pairs with >5% of their connections outside of the neuropil boundaries are included. Additional details are in Supplementary Table 2. (d) Example of prominent connectivity in the outer chiasm: ≈60% of C2-Mi15 connections are within the outer chiasm, highlighted in (c). (e) ≈30% of Am1-Tm3 connections are within the inner chiasm, as highlighted in (c).
Extended Data Fig. 3
Extended Data Fig. 3. Sorting neurons with connectivity.
Related to Fig. 2. (a) Clustering based on connectivity for all medulla intrinsic cells with at least 10 cells per type. The 68 cell types are split into a preselected number of 80 clusters. Each cluster indicates the number of individual cells assigned to it. Cell types (Y-axis) are listed alphabetically, and clusters (X-axis) are further ordered by the number of cells per cluster. This sorting produces clusters with different cell type compositions (color-coded as indicated in the figure). We note that in all cases, 1-to-many clusters (green) for a given cell type are in a shared subtree of the dendrogram that does not contain other clusters. Compare to morphology-only clustering for the same set of neurons in Extended Data Fig. 8. (b) EM to LM comparison of cell types Dm6 and Dm19. The LM images used split-GAL4 driver lines combined with population or stochastic labeling, see Methods. These cell types co-cluster in (a), but can be split by anatomy. For example, the cells have noticeably different sizes and distribution of cell bodies. Both features are visible in the EM and LM data (asterisks mark cell body locations). The two types can also be cleanly separated by further connectivity clustering (not shown), and the existence of a selective split-GAL4 driver for each indicates that they are genetically distinct.
Extended Data Fig. 4
Extended Data Fig. 4. Combining connectivity clustering with spatial distributions to evaluate cell type merges/splits.
Related to Fig. 2. 10 groups of cell types evaluated for potential splitting into separate cell types; presentation follows the conventions of Fig. 2c,g,h, where selected distinguishing input and output connections are shown. On the right side of each panel, each point represents the sum of connections to/from the indicated cell type for a single neuron from each group, horizontal line indicates the median value. This set of examples covers the various cases we find across the dataset. Cells that are split into distinct types are indicated by their assigned names, but examples of non-split cells are indicated as −1 and −2 for the clusters of cells with the same type designation. (a) Examples of groups of similar cell types that show connectivity differences and overlapping spatial distributions (mosaics) and were split into different types. Splitting TmY9a/TmY9b and Dm3a/b/c is also supported by their different arbor orientations (Fig. 5). (b) The Cm2 and Cm4 cell types show overlapping distributions, consistent connectivity differences, and different neurotransmitter predictions. Left and right instances of cells with arbors in both optic lobes (here LC14a-1) often have distinct connectivity within the same optic lobe. Such neurons were treated as two types (e.g., LC14a−1_L and LC14a-1_R) in some analyses. (c) Examples of cell types with subclusters with distinct spatial distributions. Mi15 and Dm2 subclusters occupy different domains along the DV axis; note that the overall density of Mi15 cells also differs along this axis. Such divisions suggest regional differences within these cell populations, but the absence of strong, consistent connectivity differences prevented division into distinct types. (d) Other examples of cell types that were not split owing to the lack of strong connectivity differences between the subclusters that show striking spatial distribution patterns: L5 (cells at margin separate) and LC9 (center vs. perimeter). (e) Additional examples of cell types that were not split and show no obvious structure in the spatial distributions of subclusters: L1 and LC12.
Extended Data Fig. 5
Extended Data Fig. 5. Functionally specialized inner photoreceptor types supply the visual system with color and polarized light information.
Related to Fig. 2. (a) Summary eye map of pale and yellow columns that supply color information and dorsal rim area (DRA) columns that supply polarized light information. Eye map uses the coordinate system based on medulla columns introduced in Fig. 3a. For details of column assignments, including columns with missing R7 or R8 photoreceptors (Extended Data Fig. 1g,h) see Methods: Assigning R7 and R8 photoreceptors and medulla columns to different types of ommatidia). (b) Plots of pale and yellow pathway connections. For each synaptic connection pair, bars indicate the fraction of pale-pathway connections, e.g. (# R7p to Tm5b connections) / (# R7 to Tm5b connections). The baseline is the fraction of connections expected from the fraction of pale-pathway cells of that type, e.g., # R7p cells / # R7 cells. (c) Overview of the pale/yellow identification process. Step 1: Identification of Tm5a and Tm5b cells based on connectivity clustering and cell morphology; summed connectivity with a subset of lobula cell types (LC6 & LC17, LT58 & LoVP2) is shown for individual Tm5a/b cells. Step 2: Identification of Dm8a and Dm8b with distinct connectivity to Tm5a, Tm5b, and other cell types by connectivity clustering; connectivity with Tm5a and Tm5b shown. Step 3: R7 cells are classified as pale (R7p) or yellow (R7y) using connectivity with Dm8a/b and Tm5a/b and anatomical markers; cells that could not be confidently assigned are labelled as ‘R7_unclear’. Step 4: R8 cells are classified as R8p or R8y based on connectivity with R7p/y or anatomical markers (in columns with missing R7 cells). (d) Left: Spatial map of Tm5a/b, separated as in Fig. 2, Extended Data Fig. 4. Right: Results of connectivity clustering Tm5a/b cells using all connections (top) and clustering each indicated pair of cells when connections with Tm5a/b, Dm8a/b, R7, and R8 are excluded (below). (e) Examples of Tm5a, Tm5b and Tm29 morphology. Many Tm5a cells have hook-shaped terminals in the lobula (yellow arrow) and slightly narrower medulla processes than Tm5b or Tm29 cell types; many Tm5b cells have a small process in the lobula layer 2 (purple arrow) missing in Tm5a and Tm29. (f) Colocalization (top) and connectivity (bottom) of inner photoreceptors with aMe12, a cell type previously identified as pale-specific. Top: percentage of R7p and R7y in manually identified columns innervated by aMe12. Bottom: distribution of aMe12 synapses from R8p/y cells.
Extended Data Fig. 6
Extended Data Fig. 6. Supporting data for the creation of columns and their extension to the lobula plate.
Related to Fig. 3. (a) Comparison of straight lines to spline-based method for defining medulla column centerlines. Plots shows the fraction of synapses in the home column (the column with the largest synapse count) of each neuron of a cell type. For each cell type used to construct the medulla columns (first 14), the fraction is higher for splines than for straight lines. For the other 2 cell types, the fractions are comparable. Boxes show first, second, and third quartiles; whiskers are drawn at 1.5 times the interquartile range below and above the first and third quartiles, respectively. (b) A lobula plate coordinate system was derived from the medulla coordinates by mapping neurons of the four T4 types to individual Mi1s. In most hexagons (712, in light gray), all 4 types could be matched to a single Mi1, but in 75, only 3 types could be matched (the missing neuron is indicated in color). In the 105 dark hexagons near the perimeter, only 2 or fewer T4s could be matched to an Mi1. Matching criteria include connectivity and distance (see Methods). (c) An example Mi1 and the set of 4 assigned T4 neurons. (d) TmY5a neurons are the most numerous TmY cells and are used to visualize the column assignments across neuropils. This example shows a few TmY5a cells with the corresponding home columns in the medulla, along with the lobula and lobula plate columns with the same hexagonal coordinate.
Extended Data Fig. 7
Extended Data Fig. 7. Summary of synapse distributions by columns and layers.
Related to Fig. 3. (a) The spatial distribution of presynapses (blue) and postsynapses (yellow) as a function of depth in the 3 main optic lobe neuropils. The ratio of pre-to-post is approximately 1:6 and this is conserved across most of the layers of the visual system. (b) Quantification of the dimensions of the columns in the main optic lobe neuropils. As expected, columns in the medulla are longest, the lobula columns somewhat shorter, and the lobula plate columns much shorter. Column volume is shown in the middle row. There is a noteworthy increase in volume near the equator of the eye and towards the front (left) that is especially prominent in the medulla. The bottom row shows the straightness of columns normalized by column length. Medulla columns, especially near the anterior and posterior margin are found to have the greatest curvature. While this reflects the nature of that neuropil, it is also in part due to the richer set of neurons used to define medulla columns. Gray columns around the periphery indicate columns that are not present in that brain neuropil.
Extended Data Fig. 8
Extended Data Fig. 8. Clustering neurons using quantified anatomy.
Related to Fig. 5. (a) Examples of 3 neurons, each of a different type, to illustrate the aspects of quantified morphology used to construct a feature vector for each cell. Each neuron is shown together with its primary columns and the layer distribution of its presynapses and postsynapses. The feature vector comprises scaled synapse distributions and the number of innervated columns per depth, separately for the presynapses and postsynapses (see Methods). The pre/post synapse distribution is normalized such that the sum equals the sum of pre/post number of innervated columns for that cell. It is noteworthy that Pm2a/b neurons can be more easily distinguished by the total number of innervated columns than by their volume (see Fig. 2f). (b) Confusion matrix of clustering the same 68 medulla intrinsic cell types as in Extended Data Fig. 3 where clustering was based on connectivity, but here based on the quantified morphological feature vectors. The data are sorted and color-coded as in Extended Data Fig. 3 to facilitate comparison. (c) As an example of morphologically similar neurons from different cell types, we highlight the feature vectors for one Dm6 and one Dm19, representing these cell types that are more separable by their quantified morphology (see (b)) than by their connectivity (Extended Data Fig. 3). The feature vectors show a noticeable difference in the innervation of layer M1, which we confirmed by visualizing the presynapses of both cells in a layer-slice view.
Extended Data Fig. 9
Extended Data Fig. 9. Interactive visual system Cell Type Explorer web resource.
Related to Fig. 5. The Drosophila Visual System Cell Type Explorer is a set of interactive webpages designed to offer more details about the retinotopy and connectivity for each cell type in the optic lobe. Each page features the name of the cell type at the top, which links to the cell type’s neuPrint page, and includes information on its assigned neuron group and predicted neurotransmitter. Below this header are tables displaying mean presynapse and postsynapse counts across every optic lobe neuropil, with the main neuropils divided into layers. These tables include mean (by cell) synapse counts within the central brain as well. The next section presents a 3D interactive view of a representative cell alongside a linked video that illustrates the cell type’s layer and tiling patterns, as well as the entire cell population. The ‘Spatial coverage” section further describes the distribution of synapses and cell counts per column across the main optic lobe neuropils (introduced in Fig. 5d), including data on cell size and total synapse counts. The bottom of the page is devoted to the optic lobe connectivity table, arranged by the magnitude of total synaptic connections. This table color-codes each cell type according to its main group, listing on the left (‘Inputs’) those cell types that provide input to the profiled cell type, and on the right (‘Outputs’), those cell types that receive input from it. The webpages are interconnected, allowing users to navigate between cell types via the Optic Lobe Connectivity table. Navigation is further facilitated by links at the page’s top to the Home page, where users can search for cell types by name, an Index page listing all optic lobe cell types, and a Glossary page that clarifies the terminology used throughout the site. We also provide interactive versions of the scatter plots in Fig. 5e,f, and Extended Data Fig. 10, so users can discover cell types by their coverage properties.
Extended Data Fig. 10
Extended Data Fig. 10. Coverage and density analysis for the cell types in the lobula and lobula plate.
Related to Fig. 5. (a) The relationship between population size (total number of cells) and cell size (the average number of columns innervated by a single cell) of cell types within the lobula, color-coded by coverage factor (the average number of cells that innervate a single column). The diagonal lines are guides to the ratio of global coverage: 1× for a given cell size, this is the ‘optimal’ population size to tile the columns of the neuropil, 2× and 5× more neurons and 0.5× and 0.2× fewer neurons than would be needed to fully cover the neuropil at this cell size. Selected types to highlight how the coverage factor reflects the tiling properties of the neurons are T2 (6.72), Tm2 (1.03). (b) Summary plots of the density with which cell types innervate the lobula, summarized by plotting the number of columns innervated against the convex area (in units of columns) covered by the total population. Only types with at least 5% of their total synapses and at least 50 synapses in total within the chosen brain neuropil were included in the plots. Selected types to highlight how the ratio between the columns innervated and area covered captures the density of innervation: MeVPLo1 (left instance, columns: 319, area: 710), LC40 (columns: 320, area: 329). (c) Same as (a) but for types assigned to the lobula plate. Selected types to highlight how the coverage factor reflects the tiling properties of the neurons are LPLC2 (4.63), LPLC4 (1.41). (d) As for (b) but for types assigned to the lobula plate. Selected types to highlight how the ratio between the columns innervated and area covered captures the density of innervation OLVC3 (left instance, columns: 283, area: 718), LPT31 (columns: 290, area: 290). (e) Distribution of coverage factor values in the three main optic lobe neuropils (top to bottom: medulla, lobula, lobula plate). Vertical black lines indicate the median coverage factor per neuropil.
Extended Data Fig. 11
Extended Data Fig. 11. Neurons associated with the Dorsal Rim Area.
Related to Fig. 6. The Dorsal Rim Area (DRA) of the eye is a specialized zone of photoreceptors engaged in detecting polarized light. In the dorsal medulla, there are specialized cell types not found elsewhere in the medulla that process the output of the DRA photoreceptors. The primary cell types of the medulla area that correspond to the DRA of the eye are shown and organized into groups. The first two groups show R7d (magenta) and R8d (blue) photoreceptors and their main targets, which for R7d include both VPNs and medulla intrinsic cells. The lower panels show additional cell types that are identified as other components of the medulla DRA network by their regional arborizations in the dorsal medulla and their connections with cells in the top panels and with each other. One of these cell types is a VPN that connects the DRA regions of the two optic lobes. Each panel shows all members of each cell type (for the right OL). The R7d and R8d photoreceptors are undercounted (see Extended Data Fig. 4 and Methods).
Extended Data Fig. 12
Extended Data Fig. 12. Selected neurons associated with the Accessory Medulla.
Related to Fig. 6. The Accessory Medulla (AME) is a small brain neuropil located at the anterior-medial edge of the medulla that is mainly known for its role in circadian regulation. It contains processes of several clock neuron types and a diverse group of VPN and VCN cells. This page does not include all AME-associated neurons but shows examples of cell types and cell type groups with processes in the aMe. For each cell type shown, all identified individual cells (for the right OL) are included.
Extended Data Fig. 13
Extended Data Fig. 13. Visual Centrifugal Neurons.
Related to Fig. 6. Visual centrifugal neurons receive major input in the central brain and project back to the optic lobes. We cataloged 104 VCN types (270 cells combined for the right optic lobe) and show them all here in groups organized by their main target neuropils in the optic lobes and other anatomical features (such as ipsi-, contra- or bilateral projection patterns). The figure also includes neurons (‘other’) that have some optic lobe synapses in addition to central brain synapses but were not classified as VPN or VCN (see Methods). Each panel indicates the names of the cell types (color-matched to the rendered neurons) and the number of individual cells of each type (in gray); types without numbers are present once per brain hemisphere. Detailed morphology within the optic lobe neuropils can be found in the Cell Type Catalog (Supplementary Fig. 1).
Extended Data Fig. 14
Extended Data Fig. 14. Additional examples of split-GAL4 lines matched to EM-defined cell types.
Related to Fig. 7. (a) Selected split-GAL4 lines driving expression in ONIN and ONCN types. Layer patterns of genetically labeled cell populations are shown with a neuropil marker (anti-Brp). Corresponding layers are indicated on both the LM images and the EM summary figures. (b) Selected split-GAL4 labeled VPN and VCN types. Images show overlays with registered EM skeletons. Detailed layer-specific patterns can be found in the Cell Type Catalog (Supplementary Fig. 1) and the list of split-GAL4 lines is in Supplementary Table 6. The EM/LM match shown for SS90112 is for MeVC11; this driver also has expression in MeVC2.
Extended Data Fig. 15
Extended Data Fig. 15. Supporting examples of anatomical features used for EM-LM matching.
Related to Fig. 7. Images in (b-e) and the left image in (g) show registered LM or EM images displayed on the JRC2018U template brain. LM images in (a-c) are based on full expression patterns; those in (d,e) show stochastic labeling. (a) Distribution of presynaptic sites in different medulla layers for three Cm cell types. LM images show projections through reoriented substacks (selected to show medulla layers) of the expression of a synaptic marker (syt-HA; magenta) and a membrane marker (green) driven by the indicated split-GAL4 lines. EM-based images show presynaptic sites (magenta) and EM meshes (green) of cells of the indicated types in a slice of the medulla selected to show layer patterns. (b) Cell body locations. While the soma location of individual cells is variable, general areas with cell bodies (indicated by asterisks) are similar within a cell type. Examples: TmY14 (cell bodies in a wedge-shaped subregion of the medulla cell body rind (MECBR), Tm30 (cell bodies in the ventral MECBR), and Pm6 (cell bodies in a cluster at the dorsal-medial edge of the medulla). (c) Regional arborization patterns. Examples: Dm-DRA1 (dorsal rim), MeLo4 (ventral medulla and lobula) and MeLo3b (dorsal medulla and subregion of dorsal lobula). The SS00368 driver also labels MeVP14 cells which overlap with MeLo3b in the medulla but extend into the central brain. (d) Arbor shape. Pm10 terminals have a more compact shape than those of Pm3 cells. Cm10 cells spread across nearly the full length of the medulla along the DV axis but are much narrower along the AP axis. (e) Arbor size indicates that SS34201 is expressed in Pm6 cells. SS00814 cells appears to be a better match to Pm2a than to Pm2b cells but the driver might also express in a combination of these cell types. (f) Examples of atypical cells observed in the EM reconstructions and LM examples with similar morphology, indicating the EM morphology is unlikely to be a reconstruction error. (Left two panels) Two clock neurons (the 5th s-LNv and LNd6) that typically have different cell body locations (asterisks) and similar projection patterns, show similar cell body locations and, in one case, an unusual axonal path in the optic lobe dataset (cells in magenta, asterisks mark cell body locations). For comparison, hemibrain reconstructions of the same cell types are shown in green. Most available LM images show the typical morphology, but we found one brain in which the expression pattern of a split-GAL4 line in one hemisphere matches the cell shape and cell body distribution seen in the optic lobe dataset. (Right four panels) An unusual cell (annotated as Pm7_Li28 in the EM dataset) has LM counterparts. From left to right: Optic lobe layer pattern of a driver line labeling both Pm7 and Li28 overlaid with registered EM reconstructions of these cells. Stochastic LM labeling of a Pm7 and an Li28 cell. The combined Pm7_Li28 cell in the EM (displayed on the standard brain). An LM example of a similar cell is displayed in a similar view. (g) Overlay of a segmented LM image of LoVP109, labeled using split-GAL4 line SS27802, with a matching unnamed reconstruction (bodyId 1288888967) in the (female) hemibrain volume. LoVP109 is also present in the (female) FAFB/FlyWire dataset (type LTe12, see Extended Data Fig. 16) but was not found in the (male) optic-lobe dataset. However, LM images of male and female brains (with SS27802 used to visualize LoVP109) indicate that this cell type is not female-specific (image on the right).
Extended Data Fig. 16
Extended Data Fig. 16. Matching cell types between the male optic lobe and FlyWire datasets (related to Supplementary Table 7).
Related to Supplementary Table 7. (a) Summary table of cell type matching from the (male) Optic Lobe (OL) to the (female) FlyWire (FW) dataset. The full set of matches across cell types is detailed in Supplementary Table 7. This table shows the number of matched cell types and cells for each dataset, categorized by optic lobe cell type groups (Fig. 1c) and the level of matching: 1-to-1, many-to-1, 1-to-many, many-to-many, and unmatched. The counts here are referenced to the male optic lobe dataset and do not include LoVP109 which was not found in the OL dataset. Compared to the counts in Fig. 1e, the tabulated data here only include the ‘right dominant’ neurons and so are slightly smaller. (b) Examples of matched sets of neurons from both datasets. The left panel shows an example of a ‘1-to-1’ match, with the neuron type aMe26 from both datasets. For most cell types, the FlyWire annotations of Schlegel et al. identify neurons on both sides of the brain. The right panel shows an example of a ‘2-to-1’ match, with the cell types MeVP40 and MeVP42 from the OL dataset matched to the type MTe17 in FW. (c) Examples of candidate dimorphic neurons, each identified in one dataset but not the other. The left panel shows the neuron type LTe12 from the FW dataset (see Extended Data Fig. 15g for additional information about LTe12/LoVP109 data), while the right panel shows the cell type Tm26 from the OL dataset (only the right optic lobe is shown). Tm26 appears to be the cell type previously reported as male-specific, and an additional unmatched OL cell type (LoVP92, not shown, see Supplementary Table 7) resembles a different previously described male-specific cell type. Images in b and c are shown at the same scale and perspective.

Update of

  • Connectome-driven neural inventory of a complete visual system.
    Nern A, Loesche F, Takemura SY, Burnett LE, Dreher M, Gruntman E, Hoeller J, Huang GB, Januszewski M, Klapoetke NC, Koskela S, Longden KD, Lu Z, Preibisch S, Qiu W, Rogers EM, Seenivasan P, Zhao A, Bogovic J, Canino BS, Clements J, Cook M, Finley-May S, Flynn MA, Hameed I, Fragniere AM, Hayworth KJ, Hopkins GP, Hubbard PM, Katz WT, Kovalyak J, Lauchie SA, Leonard M, Lohff A, Maldonado CA, Mooney C, Okeoma N, Olbris DJ, Ordish C, Paterson T, Phillips EM, Pietzsch T, Salinas JR, Rivlin PK, Schlegel P, Scott AL, Scuderi LA, Takemura S, Talebi I, Thomson A, Trautman ET, Umayam L, Walsh C, Walsh JJ, Xu CS, Yakal EA, Yang T, Zhao T, Funke J, George R, Hess HF, Jefferis GS, Knecht C, Korff W, Plaza SM, Romani S, Saalfeld S, Scheffer LK, Berg S, Rubin GM, Reiser MB. Nern A, et al. bioRxiv [Preprint]. 2024 Jun 1:2024.04.16.589741. doi: 10.1101/2024.04.16.589741. bioRxiv. 2024. Update in: Nature. 2025 May;641(8065):1225-1237. doi: 10.1038/s41586-025-08746-0. PMID: 38659887 Free PMC article. Updated. Preprint.

References

    1. Ramón y Cajal, S. & Sánchez, D. Contribución al conocimiento de los centros nerviosos de los insectos (Imprenta de Hijos de Nicolás Moya, 1915).
    1. Strausfeld, N. J. Atlas of an Insect Brain (Springer, 1976).
    1. Fischbach, K.-F. & Dittrich, A. P. M. The optic lobe of Drosophila melanogaster. I. A Golgi analysis of wild-type structure. Cell Tissue Res.258, 441–475 (1989).
    1. Currier, T. A., Pang, M. M. & Clandinin, T. R. Visual processing in the fly, from photoreceptors to behavior. Genetics224, iyad064 (2023). - PMC - PubMed
    1. Meinertzhagen, I. A. & O’Neil, S. D. Synaptic organization of columnar elements in the lamina of the wild type in Drosophila melanogaster. J. Comp. Neurol.305, 232–263 (1991). - PubMed

MeSH terms

Substances

LinkOut - more resources