. 2025 Mar;639(8056):897-901.
doi: 10.1038/s41586-025-08779-5. Epub 2025 Mar 26.

Witnessing the onset of reionization through Lyman-α emission at redshift 13

Affiliations

Witnessing the onset of reionization through Lyman-α emission at redshift 13

Joris Witstok et al. Nature. 2025 Mar.

Abstract

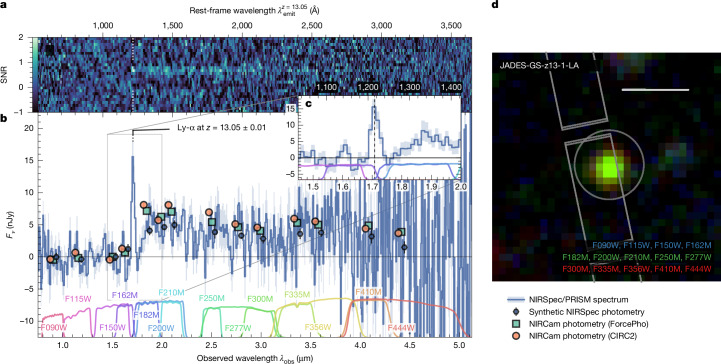
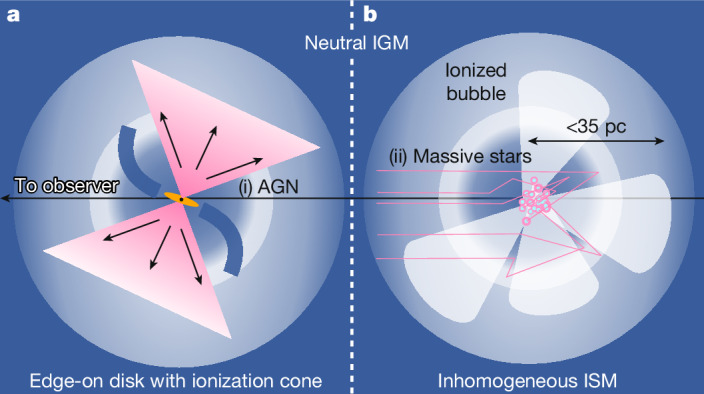
Cosmic reionization began when ultraviolet (UV) radiation produced in the first galaxies began illuminating the cold, neutral gas that filled the primordial Universe1,2. Recent James Webb Space Telescope (JWST) observations have shown that surprisingly UV-bright galaxies were in place beyond redshift z = 14, when the Universe was less than 300 Myr old3-5. Smooth turnovers of their UV continua have been interpreted as damping-wing absorption of Lyman-α (Ly-α), the principal hydrogen transition6-9. However, spectral signatures encoding crucial properties of these sources, such as their emergent radiation field, largely remain elusive. Here we report spectroscopy from the JWST Advanced Deep Extragalactic Survey (JADES10) of a galaxy at redshift z = 13.0 that reveals a singular, bright emission line unambiguously identified as Ly-α, as well as a smooth turnover. We observe an equivalent width of EWLy-α > 40 Å (rest frame), previously only seen at z < 9 where the intervening intergalactic medium becomes increasingly ionized11. Together with an extremely blue UV continuum, the unexpected Ly-α emission indicates that the galaxy is a prolific producer and leaker of ionizing photons. This suggests that massive, hot stars or an active galactic nucleus have created an early reionized region to prevent complete extinction of Ly-α, thus shedding new light on the nature of the earliest galaxies and the onset of reionization only 330 Myr after the Big Bang.


Conflict of interest statement

Competing interests: The authors declare no competing interests.

Figures

Fig. 1
Fig. 1. NIRCam and NIRSpec/PRISM observations of JADES-GS-z13-1-LA.
a, Two-dimensional SNR map of the PRISM spectrum (not used for extraction of the one-dimensional spectrum; see Methods for details). b, One-dimensional sigma-clipped PRISM spectrum (uncorrected for further path losses; see Methods) and photometric measurements (slightly offset in wavelength for visualization) according to the legend at the bottom right. Synthetic photometry is obtained by convolving the spectrum with the filter transmission curves shown at the bottom. Shading and error bars represent 1σ uncertainty. c, Zoom-in on the emission line at 1.7 μm, which falls precisely between the F162M and F182M medium-band filters. d, False-colour image of JADES-GS-z13-1-LA constructed by stacking NIRCam filters for each colour channel as annotated. The placement of the NIRSpec microshutters, nearly identical across the two visits, is shown in grey, as is the circular 0.3″-diameter extraction aperture for the CIRC2 photometry. A physical scale of 1 kpc (0.28″ at z = 13.05) is indicated as the scale bar.
Fig. 2
Fig. 2. Model of NIRSpec/PRISM observations of JADES-GS-z13-1-LA.
a, Model curves for the IGM and DLA transmission T (according to the legend on the right) and normalized Ly-α line profiles (see panel c). b, Blue line shows the sigma-clipped PRISM spectrum corrected for path losses (Methods). Model spectra with a power-law continuum, attenuated by DLA absorption, and a pure 2γ continuum are shown by the solid and dashed black lines, respectively. The legend shows their χ2 goodness-of-fit statistics compared with the degrees of freedom (DOF; Methods). The intrinsic and observed Ly-α EWs (relative to an unattenuated power-law continuum) and their ratio (the escape fraction) are annotated. c, Zoom-in on the intrinsic (dotted black line) and IGM-transmitted (solid black line) Ly-α line profiles. The vertical black dotted line shows the median systemic Ly-α redshift in the default model (Methods), differing from the Ly-α redshift by the observed velocity offset ΔvLy-α,obs. d, For the two different models, χ represents the residuals normalized by the observational uncertainty of a single wavelength bin (diagonal elements of the covariance matrix). The location of other rest-frame UV lines are indicated, although none are significantly detected (Methods). Shading represents 1σ uncertainty on all lines.
Fig. 3
Fig. 3. Schematic of production, escape and absorption of Ly-α in JADES-GS-z13-1-LA.
a,b, Ly-α emission is indicated in pink, whereas dark blue shows H i gas. We identify two potential explanations each for the source of emission ((i) and (ii)) and modes of Ly-α modulation. a, An extended disk of neutral gas seen in edge-on orientation may cause DLA absorption of the continuum source, whereas an ionization cone perpendicular to the disk plane allows Ly-α photons to escape. Under this escape mechanism, the source of the Ly-α emission may be interchanged from an AGN (i) to a nuclear starburst (ii). b, Alternatively, if neutral gas in the ISM is inhomogeneously distributed, resonant scattering could allow Ly-α to diffuse outwards while the central source remains obscured by H i gas, as seen in local, compact, star-forming galaxies (see text for details).
Extended Data Fig. 1
Extended Data Fig. 1. ForcePho modelling of JADES-GS-z13-1-LA.
The top row shows roughly 1″ × 1″ cutouts of the observed data (scaled according to the colour bar shown on the right) around JADES-GS-z13-1-LA in each of the 14 available NIRCam filters, as annotated at the top of each column. The PSF-convolved ForcePho model (see ‘Photometric measurements’) is shown in the middle row. The bottom row shows that residuals between data and model are consistent with pure noise, indicating that the model provides a good fit to the data. Note that, although the ForcePho fits are performed on more than 400 separate exposures, they are mosaiced together here to visualize the data and residuals.
Extended Data Fig. 2
Extended Data Fig. 2. Medium-resolution (R1000) grating spectra of JADES-GS-z13-1-LA.
a, Coloured lines represent observed spectra in different grating-filter modes, as obtained from the sigma-clipping procedure (Supplementary information). Specifically, we show the G140M/F070LP (dotted turquoise line) and G235M/F170LP (dashed range line) spectra compared with the low-resolution PRISM spectrum (dark blue line). Shading represents a 1σ uncertainty on all components of the figure. Solid curves represent emission-line profiles at increasing widths (according to the colour bar in panel b), starting from the R = 1,000 resolution limit and having matched the flux and central wavelength (1.708 μm; indicated by a vertical black line) to the values measured from the PRISM spectrum (see ‘Emission-line properties’). b, Measured Ly-α flux in an increasingly wide spectral aperture centred on 1.708 μm in G235M/F170LP are shown by circles with 1σ error bars, none of which show a significant detection. This is consistent with the less sensitive G140M/F070LP measurements (not shown here for clarity). A horizontal dashed line shows the measured PRISM line flux contained within the FWHM of a Gaussian profile (76%), whereas a vertical dotted line indicates the limiting R = 1,000 resolution. This illustrates that, if the emission line is well resolved (FWHM ≳ 600 km s−1), it would fall below the nominal noise level of the R1000 gratings (see annotated 2σ and 4σ levels).
Extended Data Fig. 3
Extended Data Fig. 3. Posterior distributions from spectral modelling of the observed spectrum of JADES-GS-z13-1-LA.
The small panels show inter-dependencies between all eight parameters freely varied in the model (Extended Data Table 3). Furthermore, we include the physical radius of the ionized bubble (Rion) and Ly-α luminosity (LLy-α), which are not independently varied but are instead determined by the other parameters (see ‘Spectral modelling’).
Extended Data Fig. 4
Extended Data Fig. 4. Modelled ionized bubble size evolution.
The right axis shows the physical radius of the ionized bubble Rion, whose evolution as a function of lookback time t is governed by equation (2). The solid line shows the median among the posterior distribution of the default model and the shading represents 1σ uncertainty (16th to 84th percentile). The dashed line illustrates the Hubble expansion rate if the bubble remains unchanged from t = 0 onwards, showing that this effect has little impact over the timescale relevant to our analysis. The dotted line shows how the neutral hydrogen fraction within the bubble (left axis) would evolve without further ionizing photons.

References

    1. Dayal, P. & Ferrara, A. Early galaxy formation and its large-scale effects. Phys. Rep.780, 1–64 (2018).
    1. Robertson, B. E. Galaxy formation and reionization: key unknowns and expected breakthroughs by the James Webb Space Telescope. Annu. Rev. Astron. Astrophys.60, 121–158 (2022).
    1. Curtis-Lake, E. et al. Spectroscopic confirmation of four metal-poor galaxies at z = 10.3–13.2. Nat. Astron.7, 622–632 (2023).
    1. Arrabal Haro, P. et al. Confirmation and refutation of very luminous galaxies in the early Universe. Nat. Astron.622, 707–711 (2023). - PubMed
    1. Carniani, S. et al. Spectroscopic confirmation of two luminous galaxies at a redshift of 14. Nat. Astron.633, 318–322 (2024). - PMC - PubMed

LinkOut - more resources