. 2025 Apr;27(4):619-632.
doi: 10.1038/s41556-025-01623-y. Epub 2025 Mar 26.

Proteostasis and lysosomal repair deficits in transdifferentiated neurons of Alzheimer's disease

Affiliations

Proteostasis and lysosomal repair deficits in transdifferentiated neurons of Alzheimer's disease

Ching-Chieh Chou et al. Nat Cell Biol. 2025 Apr.

Abstract

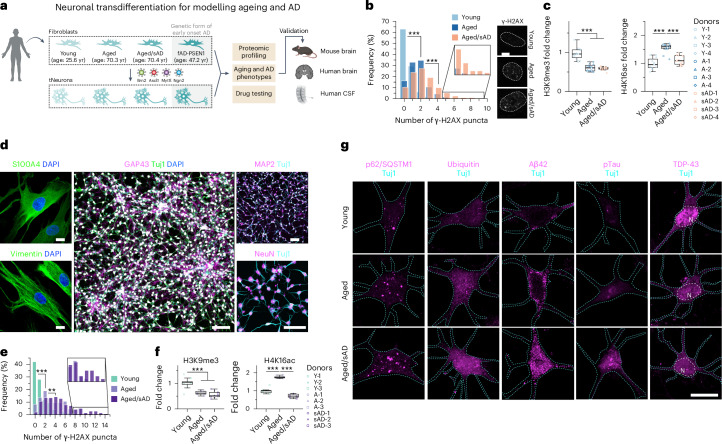
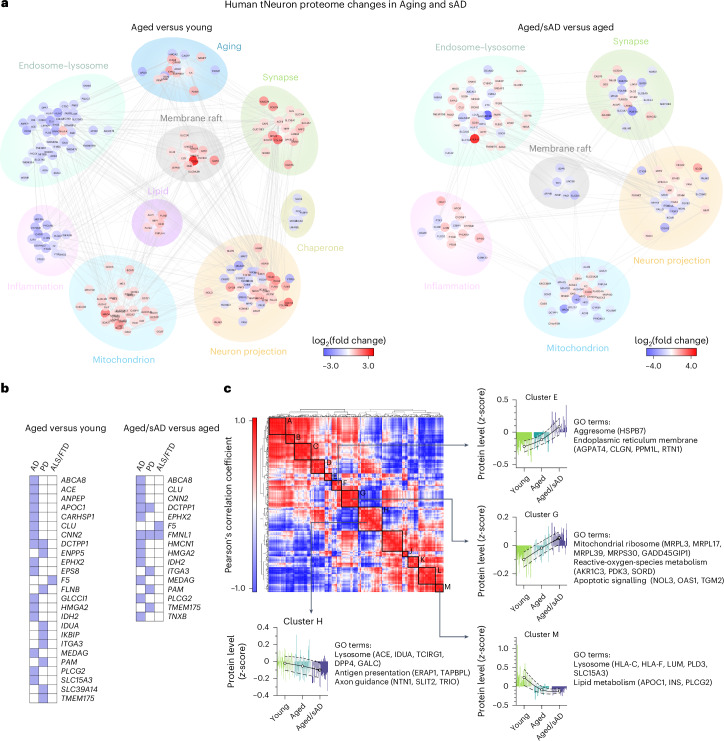
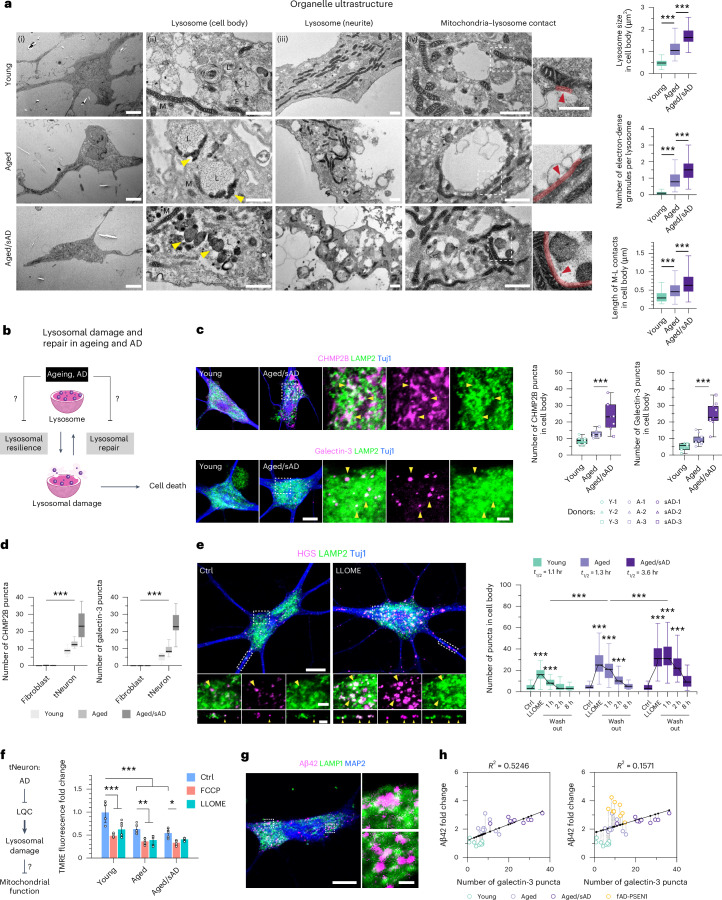
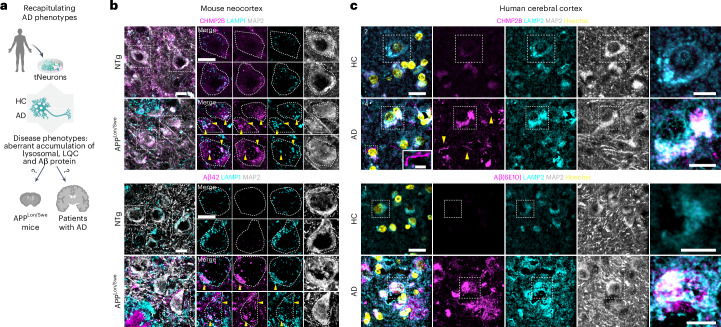
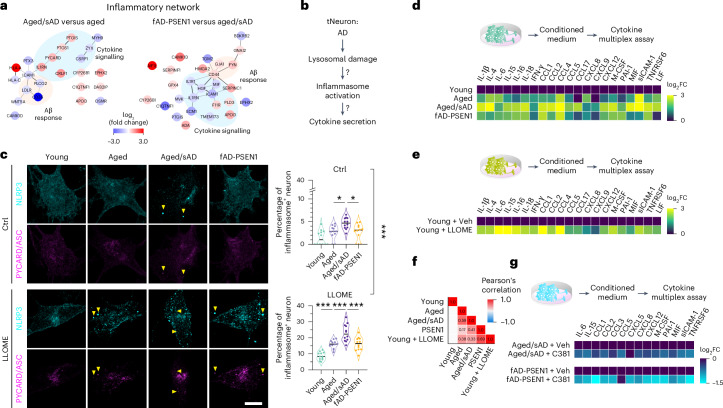
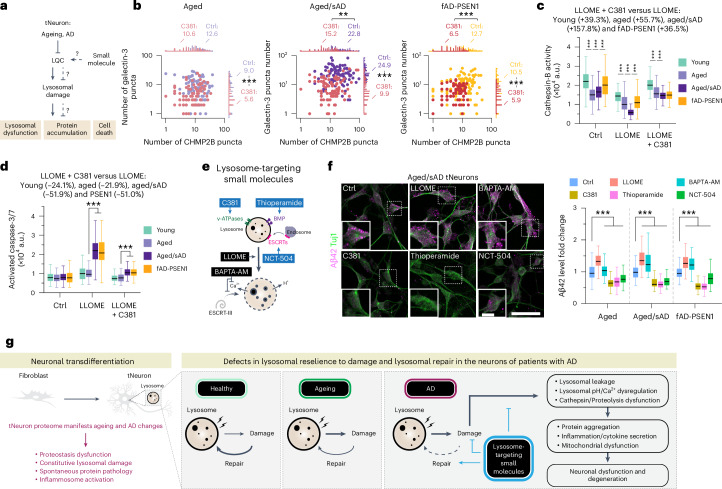
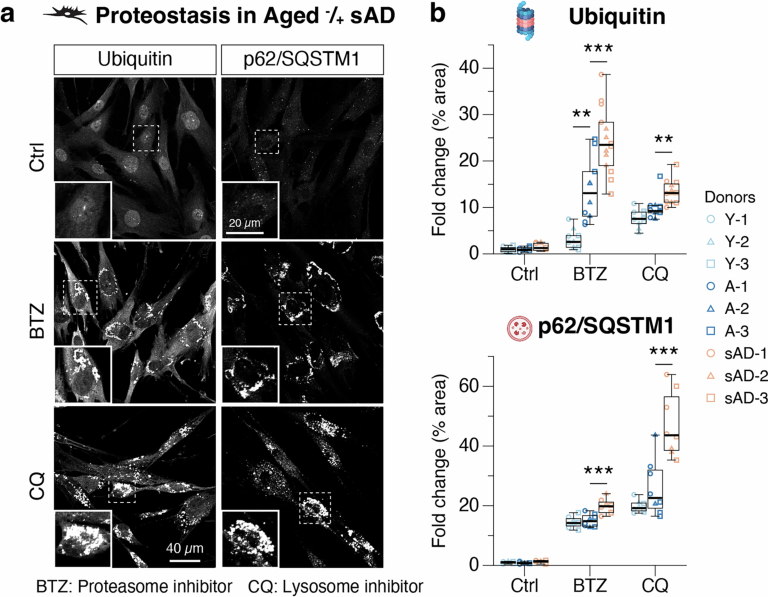
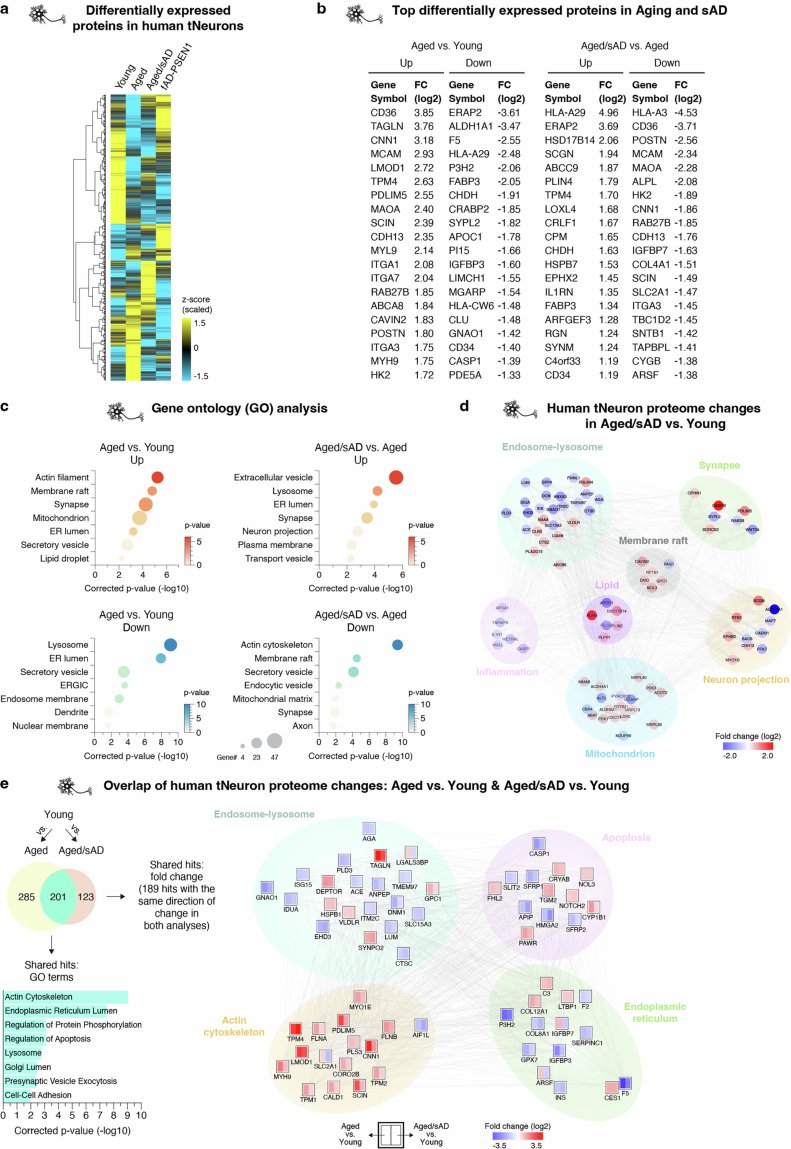
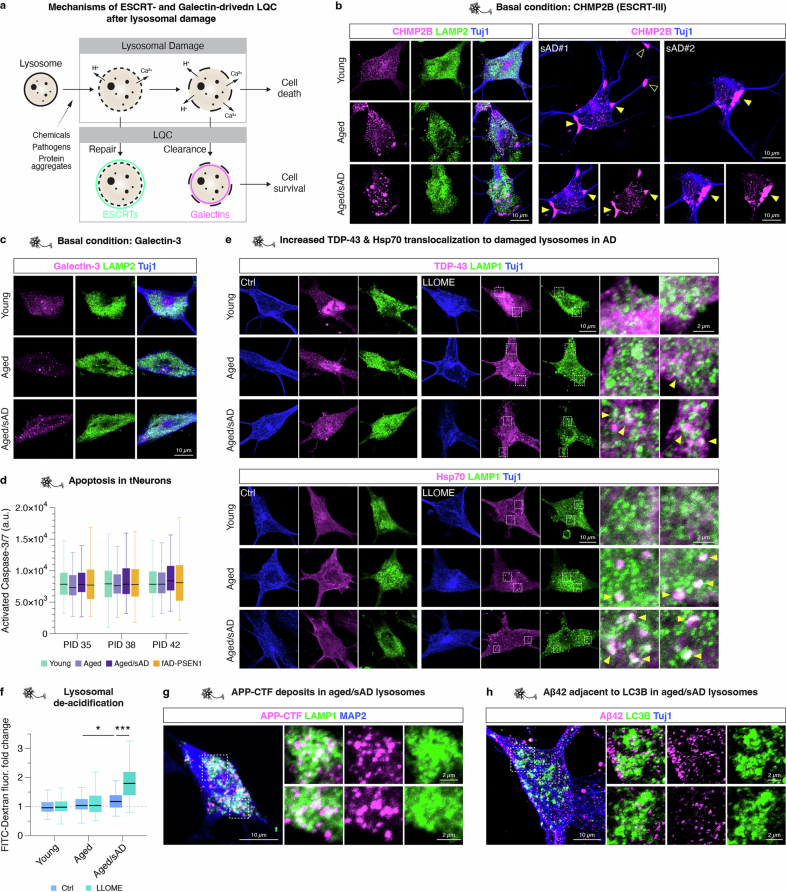
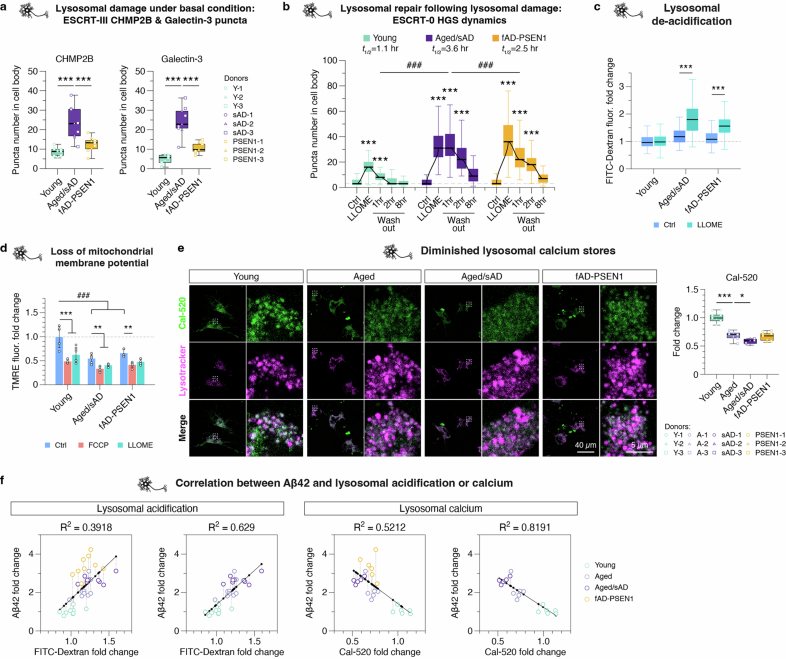
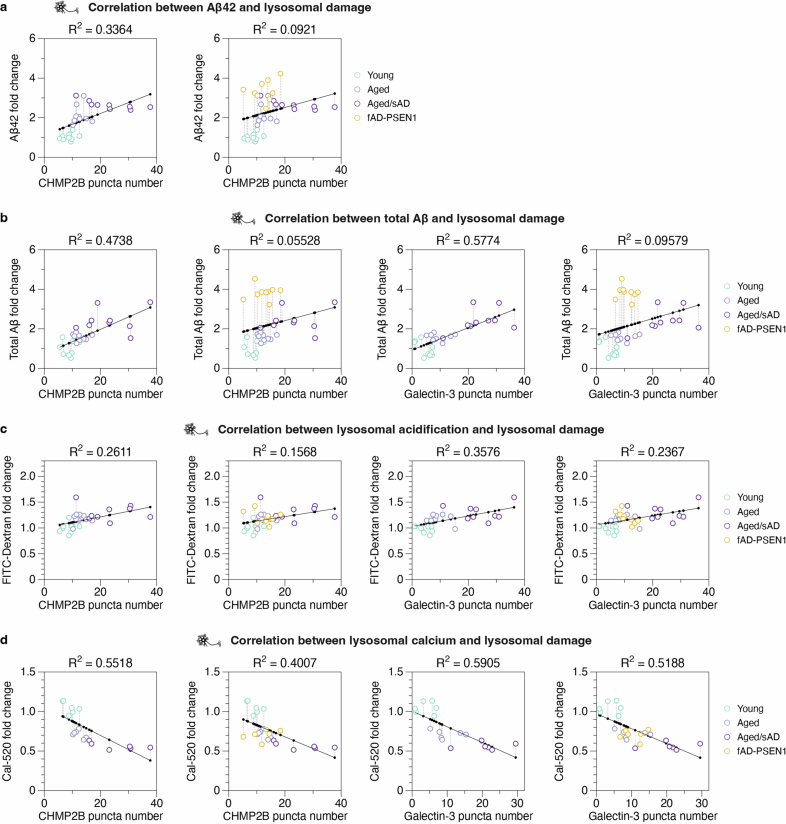
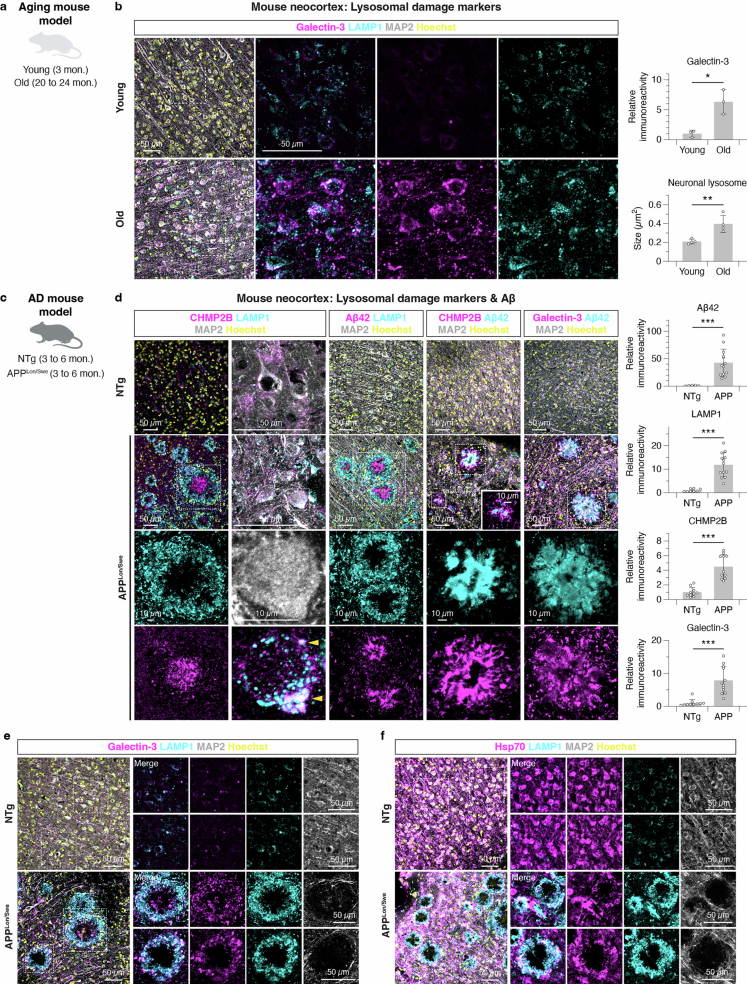
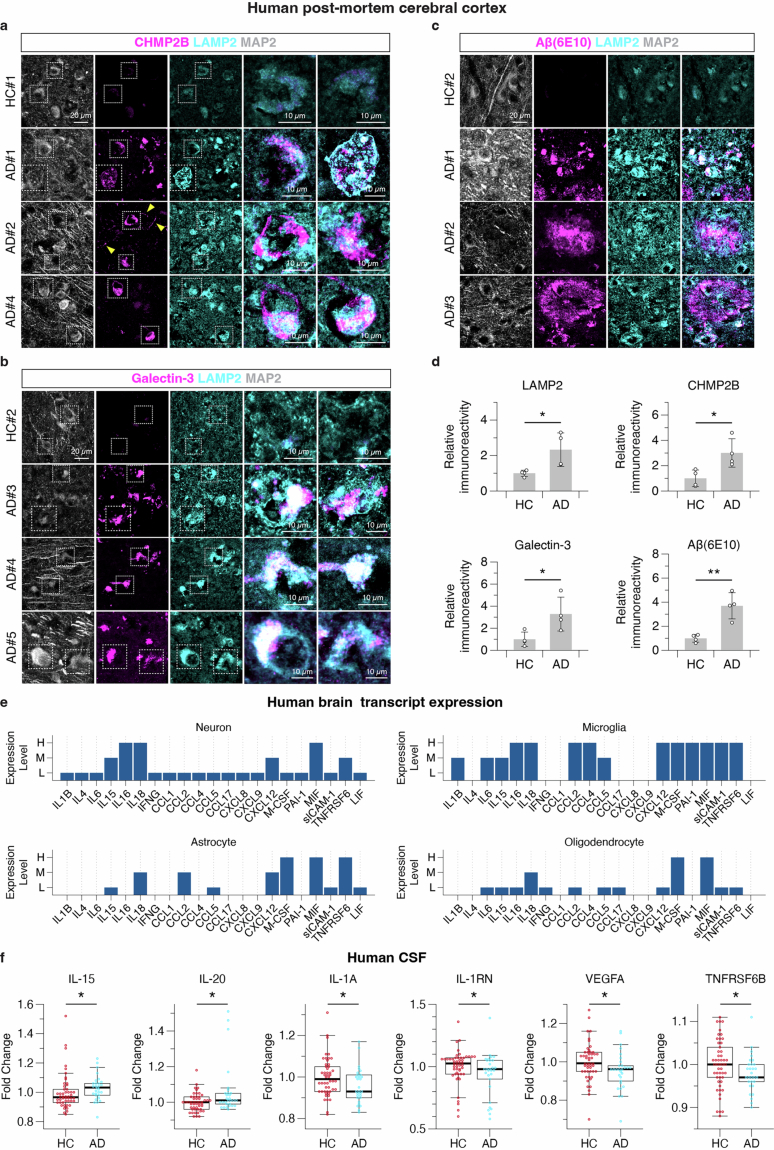
Ageing is the most prominent risk factor for Alzheimer's disease (AD). However, the cellular mechanisms linking neuronal proteostasis decline to the characteristic aberrant protein deposits in the brains of patients with AD remain elusive. Here we develop transdifferentiated neurons (tNeurons) from human dermal fibroblasts as a neuronal model that retains ageing hallmarks and exhibits AD-linked vulnerabilities. Remarkably, AD tNeurons accumulate proteotoxic deposits, including phospho-tau and amyloid β, resembling those in APP mouse brains and the brains of patients with AD. Quantitative tNeuron proteomics identify ageing- and AD-linked deficits in proteostasis and organelle homeostasis, most notably in endosome-lysosomal components. Lysosomal deficits in aged tNeurons, including constitutive lysosomal damage and ESCRT-mediated lysosomal repair defects, are exacerbated in AD tNeurons and linked to inflammatory cytokine secretion and cell death. Providing support for the centrality of lysosomal deficits in AD, compounds ameliorating lysosomal function reduce amyloid β deposits and cytokine secretion. Thus, the tNeuron model system reveals impaired lysosomal homeostasis as an early event of ageing and AD.


Conflict of interest statement

Competing interests: R.V., J.L. and T.W.-C. are co-founders of Qinotto Inc. The other authors declare no competing interests.

Figures

Fig. 1
Fig. 1. Transdifferentiation of human adult fibroblasts into neurons reveals signatures of ageing and AD.
a, Human dermal fibroblasts were collected from healthy young and aged, aged/sAD and fAD-PSEN1 donors. Fibroblasts and tNeurons were used for a variety of experiments and the findings were validated in post-mortem brain tissue as well as CSF. b, Levels of DNA damage (left) measured as the number of the nuclear foci of γ-H2AX immunofluorescence (right) in human fibroblasts. White dotted lines outline cell nuclei. Images are representative of three independent experiments; n = 248 young, 304 aged and 252 aged/sAD cells from three donors. Scale bar, 50 μm. c, Age- and AD-related epigenetic alterations. Immunofluorescence of the histone modifications H3K9me3 (left) and H4K16ac (right) in human fibroblasts was measured. Data are from four donors and three independent experiments; H3K9me3, n = 252 young, 241 aged and 237 aged/sAD cells; H4K16ac, n = 157 young, 167 aged and 141 aged/sAD cells. d, Neuronal transdifferentiation efficiency. Representative images of human fibroblasts immunostained for S100A4 and Vimentin, and tNeurons immunostained for Tuj1, GAP43, MAP2 and NeuN with 4,6-diamidino-2-phenylindole (DAPI) counterstaining on PID 35. Scale bars, 100 μm. e, Analysis of DNA damage in tNeurons revealed by γ-H2AX immunofluorescence; n = 150 young, 132 (aged) and 141 (aged/sAD) cells. b,e, Inset: magnified views of the bars in the boxed regions. f, Immunofluorescence analysis of H3K9me3 and H4K16ac changes in tNeurons. H3K9me3, n = 95 young, 123 aged and 124 aged/sAD cells; H4K16ac, n = 112 young, 115 aged and 117 aged/sAD cells. e,f, Data are from three donors and three independent experiments. g, Representative images of proteostasis- and disease-associated protein markers—autophagy adaptor p62/SQSTM1, ubiquitin, Aβ42, pTau and TDP-43—in tNeurons. The cyan dashed line outlines tNeuron morphology determined by Tuj1 staining and the white dashed line represents the nuclear region (N). Scale bar, 20 μm. c,f, The boxes show the median and first and third quartiles (box boundaries), and the whiskers extend 1.5× the interquartile range from the boxes. Statistical analysis was performed using a one-way analysis of variance (ANOVA), followed by Bonferroni’s post-hoc analysis. **P < 0.01 and ***P < 0.001. Source numerical data are provided. Source data
Fig. 2
Fig. 2. Human tNeurons carry proteomic signatures of ageing and AD.
a, Differential expression of proteins detected in tNeurons of healthy young (n = 3) and aged (n = 3) individuals as well as patients with aged/sAD (n = 6) on PID 40. The top pathways for ageing and sAD proteomes were analysed using gene ontology databases. Comparisons between tNeurons from aged and young donors (left) as well as aged/sAD and aged donors (right). The level of enrichment of the identified proteins (log2-transformed fold change) is represented by coloured circles (increase in red and decrease in blue). b, List of differentially expressed proteins associated with risk genes for age-related neurodegenerative diseases. PD, Parkinson’s disease; ALS/FTD, amyotrophic lateral sclerosis/frontotemporal dementia. c, Cluster heatmap of the Pearson’s correlation coefficients of total tNeuron protein expression (top left). Clusters A to M (right and bottom) show distinct protein expression patterns and the associated gene ontology terms between the young, age and aged/sAD samples. Each line represents the expression of individual protein defined by the relative protein abundance (z-score) across different groups. The white circles represent the average z-score for each cluster and the dashed lines represent the s.d.
Fig. 3
Fig. 3. Constitutive lysosomal damage and lysosomal repair deficits in AD tNeurons.
a, Analysis of the organelle ultrastructure of human tNeurons using TEM (left). E, endosome; L, lysosome; M, mitochondria. Yellow arrowheads point to electron-dense granules and red arrowheads and lines indicate the mitochondria–lysosome contact site. Insets: higher magnification views of the regions in the white boxes showing mitochondria–lysosome contact. The lysosome size (top right; n = 59 young, 69 aged and 69 aged/sAD lysosomes), electron-dense material abundance (middle right; n = 74 young, 68 aged and 60 aged/sAD lysosomes) and length of mitochondria–lysosome contacts (bottom right; n = 174 young, 262 aged and 246 aged/sAD contacts) from two donors and two independent experiments were determined. Scale bars, 10 μm (i), 1 μm (ii–iv) and 500 nm (insets). b, Schematic of the tests to determine how ageing and AD alters lysosomal damage responses, leading to cell death. c, Lysosomal damage under basal conditions. Representative images of tNeurons under basal conditions immunostained on PID 35 for LAMP2, Tuj1 and ESCRT-III CHMP2B or galectin-3 (left). Insets: higher magnification views of the region in the white boxes showing protein co-localization. The yellow arrowheads point to CHMP2B and galectin-3 co-localization with LAMP2. Numbers of CHMP2B and galectin-3 puncta (immunofluorescence quantification) in the cell body of tNeurons (right). CHMP2B, n = 117 young, 103 aged and 97 aged/sAD cells; galectin-3, n = 111 young, 108 aged and 95 aged/sAD cells. Scale bars, 10 μm (main images; first two columns on the left) and 2 μm (insets). d, Basal state lysosomal damage. Comparison of the numbers of CHMP2B and galectin-3 puncta in fibroblasts and tNeurons at basal conditions. Fibroblasts: CHMP2B, n = 102 young, 105 aged and 99 aged/sAD cells; galectin-3, n = 102 young, 105 aged and 99 aged/sAD cells. tNeurons: CHMP2B, n = 117 young, 103 aged and 97 aged/sAD cells; galectin-3, n = 111 young, 108 aged and 95 aged/sAD cells. e, Lysosomal repair following lysosomal damage. Representative images of AD tNeurons immunostained on PID 36 for LAMP2, ESCRT-0 HGS protein and Tuj1. Insets: magnified views of the regions in the white boxes (middle and bottom left). The yellow arrowheads point to HGS co-localization with LAMP2. Scale bars, 10 μm (main images) and 2 μm (insets). Cells were treated with 0.25 mM LLOME for 30 min, followed by LLOME washout for lysosomal repair. Numbers of HGS puncta in the cell body determined from the immunofluorescence images (right). The time required for lysosomal repair is indicated (t1/2). Young, n = 108 control (Ctrl), 107 LLOME, 111 washout 1 h, 118 washout 2 h and 90 washout 8 h cells; aged, n = 110 Ctrl, 113 LLOME, 114 washout 1 h, 116 washout 2 h and 109 washout 8 h cells; aged/sAD, n = 115 Ctrl, 115 LLOME, 117 washout 1 h, 109 washout 2 h and 79 washout 8 h cells. ce, Data are from three donors and three independent experiments. f, Schematic of the tests to determine whether defective LQC mediates mitochondrial dysfunction in ageing and AD. The mitochondrial membrane potential (fold change relative to young tNeurons treated with dimethylsulfoxide, DMSO) was quantified using TMRE staining following treatment with DMSO (Ctrl), 20 µM FCCP or 0.25 mM LLOME for 30 min. Data are the mean ± s.d.; n = 6 independent replicates (all groups) from three donors and two experiments. g, Aβ42 deposits in aged/sAD lysosomes. Immunofluorescence analysis of co-localization of Aβ42 with LAMP1 in aged/sAD tNeurons. Inset: higher magnification views of the regions in the white boxes showing Aβ42 and LAMP1. Scale bars, 10 μm (main image) and 1 μm (insets). h, Correlation between intracellular Aβ42 levels and galectin-3 puncta numbers, indicating lysosomal damage, in different groups of tNeurons. The black line represents the fitted linear correlation; Pearson’s correlations were used to calculate the R2 values; n = 9 independent replicates from three donors and three experiments. a,ce, The boxes show the median and first and third quartiles (box boundaries), and the whiskers extend 1.5× the interquartile range from the boxes. a,cf, Statistical analyses were performed using a one-way (a,c) or two-way (df) ANOVA, followed by Bonferroni’s post-hoc analysis. *P < 0.05, **P < 0.01 and ***P < 0.001. Source numerical data are provided. Source data
Fig. 4
Fig. 4. Lysosomal damage is linked to amyloid accumulation in post-mortem brain tissue.
a, Schematic of the experimental pipeline to test whether the disease phenotypes observed in AD tNeurons are also detected in brain tissue of patients with AD and transgenic mice expressing mutant human APP with the Swedish and London mutations (APPLon/Swe) for modelling AD. b, Immunofluorescence staining of CHMP2B, Aβ42 and LAMP1 in the neocortex of non-transgenic mice (NTg) and APPLon/Swe transgenic mice (left). The brain tissue was co-stained with MAP2. Higher magnification view of the regions in the dotted white boxes showing co-localization of CHMP2B, Aβ42 and LAMP1 in individual neurons are provided (right). The yellow arrowheads point to intraneuronal co-localization of CHPM2B and Aβ42 with LAMP1. Scale bars, 10 μm. c, Immunofluorescence staining of CHMP2B, Aβ(6E10) and LAMP2 in the cerebral cortex of human donors (HC and AD). The brain tissue was co-stained with MAP2 and Hoechst. Higher magnification views of the regions in the white boxes showing CHMP2B and Aβ(6E10) co-localization with LAMP2 are provided (right). Numbers (1, 2 and 4) indicate the case number associated with the representative images. Scale bars, 20 μm (main images), 5 μm (inset in image 4, left) and 10 μm (magnified views, right). The yellow arrowheads point to CHMP2B+ fibril structures.
Fig. 5
Fig. 5. Lysosomal damage mediates inflammatory responses in AD tNeurons.
a, Interaction network of proteins involved in the inflammatory response pathway in tNeurons. The relative abundance is shown as the log2-transformed fold change (log2FC); increase in red and decrease in blue. b, Schematic of the test to determine whether lysosomal damage is linked to inflammasome activation and cytokine secretion in AD neurons. c, Inflammasome activation. Representative images of tNeurons immunostained for the inflammasome markers NLRP3 and PYCARD/ASC following treatment with or without 0.25 mM LLOME for 3 h on PID 40 (left). The yellow arrowheads point to co-localization of NLRP3 and PYCARD/ASC. Scale bar, 10 μm. Percentage of tNeurons showing inflammasomes in each image (right). The median of the data is shown; n = 441–477 young, 399–513 aged and 522–648 aged/sAD cells from four donors and three independent experiments. d, Inflammatory profiling of the conditioned medium from all groups of tNeurons on PID 40 under basal conditions. The cytokine and chemokine log2FC values are relative to those for young tNeurons; n = 6 young, 6 aged, 12 aged/sAD and 4 fAD-PSEN1 independent replicates from two experiments. e, Inflammatory profile of the conditioned medium from young tNeurons with or without chronic lysosomal damage stress (0.1 mM LLOME for 7 d starting at PID 33). The cytokine and chemokine log2FC values are relative to the vehicle control (DMSO); n = 6 young + vehicle and 8 young + LLOME independent replicates from two experiments. f, Pearson’s correlation analysis of the identified cytokines and chemokines. The Pearson’s correlation coefficients are indicated on the graph. g, Inflammatory profiling of the conditioned medium from aged/sAD and fAD-PSEN1 tNeurons at PID 35 following treatment with or without 3.1 µM C381 for 7 d. The log2-transformed FC in mean fluorescence intensity relative to the vehicle control (DMSO) was determined; n = 4 independent replicates (all groups) from two experiments. ce,g, Statistical analysis was performed using a two-sided Student’s t-test (g), or one-way (d,e) or two-way (c) ANOVA, followed by Bonferroni’s post-hoc analysis. *P < 0.05 and ***P < 0.001. Veh, vehicle. Source numerical data are provided. Source data
Fig. 6
Fig. 6. Pharmacological improvement of lysosomal resilience to damage ameliorates AD phenotypes in tNeurons.
a, Schematic of tests to determined whether LQC rescue provides neuroprotective effects in AD tNeurons. b, Concurrent change in the number of CHMP2B and galectin-3 puncta by treatment with 0.25 mM LLOME for 30 min at PID 35 following pretreatment with DMSO (Ctrl) or 3.1 µM C381 for 7 d. Ctrl, n = 103 aged, 95 aged/sAD and 104 fAD-PSEN1 cells; C381, n = 88 aged, 95 aged/sAD and 91 fAD-PSEN1 cells. Each dot represents the number of detectable CHMP2B and galectin-3 puncta in an individual neuron. c, Changes in cathepsin-B activity caused by 0.25 mM LLOME treatment for 30 min at PID 35 following pretreatment with 3.1 µM C381 for 7 d. Young, n = 145 Ctrl, 142 LLOME and 147 LLOME + C381 cells; aged, n = 157 Ctrl, 156 LLOME and 122 LLOME + C381 cells; aged/sAD, n = 157 Ctrl, 152 LLOME and 155 LLOME + C381 cells; fAD-PSEN1, n = 142 Ctrl, 142 LLOME and 141 LLOME + C381 cells. d, Levels of caspase-3/7 activation after 0.5 mM LLOME treatment for 1 h at PID 42 following pretreatment with 3.1 µM C381 at PID 35 for 7 d. Young, n = 162 Ctrl, 142 LLOME and 105 LLOME + C381 cells; aged, n = 158 Ctrl, 146 LLOME and 133 LLOME + C381 cells; aged/sAD, n = 148 Ctrl, 167 LLOME and 142 LLOME + C381 cells; fAD-PSEN1, n = 136 Ctrl, 147 LLOME and 148 LLOME + C381 cells. e, Schematic showing small molecules that modulate lysosomal function and damage. Small molecules with beneficial effects are labelled in blue and those with detrimental effects are labelled in black. f, Effects of small molecules (treatment with 0.25 mM LLOME, 2.5 µM BAPTA-AM, 3.1 µM C381, 5 µM thioperamide or 2.5 µM NCT-504 for 2 d) on intraneuronal Aβ42 levels in aged, aged/sAD and fAD-PSEN1 tNeurons. Representative images of aged/sAD tNeurons immunostained for Aβ42 and Tuj1 at PID 35 (left). Insets: higher magnification views of the regions in the dashed boxes showing Aβ42 in individual neurons. Scale bars, 50 μm (main images) and 10 μm (insets). Fold changes in Aβ42 levels, determined from the immunofluorescence images, during small-molecule treatment relative to the DMSO Ctrl; n = 104–122 (aged), 88 to 144 (aged/sAD) and 61–136 (fAD-PSEN1) cells. bd,f, Data are from three donors and three independent experiments. g, We propose that in AD—either as a result of stochastic events or mutational burdens—lysosomal repair defects are exacerbated, leading to overwhelmed LQC machineries and the sustained presence of damaged lysosomes. Restoration of lysosomal homeostasis and damage ameliorate AD pathologies in neurons. c,d,f, The boxes show the median and first and third quartiles (box boundaries), and the whiskers extend 1.5× the interquartile range from the boxes. bd,f, Statistical analysis was performed using a two-sided Student’s t-test (b) or a one-way ANOVA (c,d,f), followed by Bonferroni’s post-hoc analysis. **P < 0.01 and ***P < 0.001. Source numerical data are provided. Source data
Extended Data Fig. 1
Extended Data Fig. 1. Proteostasis signatures of aging and Alzheimer’s disease (AD) are present in human adult fibroblasts.
(a) Representative images of endogenous ubiquitin and p62/SQSTM1 in young fibroblasts treated with DMSO control (Ctrl), proteasome inhibitor Bortezomib (BTZ, 25 nM) or lysosome inhibitor Chloroquine (CQ, 25 µM) for 24 hr (scale bar: 40 μm). Insert: higher magnification view of ubiquitin and p62/SQSTM1 (scale bar: 20 μm). (b) Immunofluorescence (IF) quantification of proteostasis markers shown in panel (a) for changes in ubiquitin and p62/SQSTM1 by the treatment of BTZ and CQ, respectively, in young (Y), aged (A) and aged/sAD (sAD) fibroblasts. Data represent as fold changes in ubiquitin and p62/SQSTM1 levels (% of area per image field) relative to young fibroblasts treated with DMSO Ctrl. Ubiquitin: Ctrl: n = 230 (young), 215 (aged) and 162 (aged/sAD) cells; BTZ: n = 124 (young), 142 (aged) and 131 (aged/sAD) cells; CQ: n = 152 (young), 131 (aged) and 134 (aged/sAD) cells. p62/SQSTM1: Ctrl: n = 140 (young), 117 (aged) and 138 (aged/sAD) cells; BTZ: n = 155 (young), 130 (aged) and 143 (aged/sAD) cells; CQ: n = 133 (young), 150 (aged) and 137 (aged/sAD) cells. In panel b, the boxes show median and 1st and 3rd quartile and the whiskers extending 1.5 times the interquartile range from the boxes. Data show box-and-whisker plots of three to five independent experiments and cells from three independent healthy control (HC) and AD donors. Statistical analysis is performed using Two-Way ANOVA followed by Bonferroni post-hoc analysis. **P < 0.01 and ***P < 0.001. Source numerical data are provided. Source data
Extended Data Fig. 2
Extended Data Fig. 2. Cortical neurons are generated directly from human adult fibroblasts using a combinatorial transcription-factor and small-molecule protocol.
(a) Transdifferentiation scheme using transcription factors Brn2, Ascl1, Myt1l, and Ngn2 (herein BAMN factors) that induces a global transcriptional change in fibroblasts to constitute a new neuronal cell state. Fibroblasts are plated one day before transdifferentiation. On Day 0, cells are infected with lentiviruses expressing BAMN factors and harvested four days after doxycycline-induction. Transduced cells expressing PSA-NCAM are magnetically isolated and replated to vitronectin/laminin-coated plates on Day 4 and then switched to reprogramming medium (DMEM/F12/Neurobasal) supplemented with small molecules 5 µM Forskolin, 10 µM SB 431542, 2 µM Dorsomorphin and 2 µM XAV939 on Day 5. 10 ng/mL BDNF and NT-3 are added into the reprogramming medium after one week. Cells are switched to maturation medium (Neuronal) on Day 20 and used for experiments after Day 35. (b) Fibroblasts are infected with lentiviruses expressing BAMN factors and GFP and monitored for morphological changes after lentiviral induction. Transduced cells undergo sorting based on PSA-NCAM+ gate in flow cytometry on Day 4. Scale bar: 200 μm. (c,d) IF images of neuronal markers in tNeurons at PID 35. Quantification of the percentage of cells positive for both NeuN and Tuj1 (c) and the numbers of Syn-1 puncta in the soma (d). Tuj1/DAPI, MAP2/DAPI & MAP2/Tuj1: n = 1208 (young), 678 (aged) and 789 (aged/sAD) cells; NeuN/DAPI and NeuN/Tuj1: n = 822 (young), 579 (aged) and 759 (aged/sAD) cells. Syn-1: n = 40 (young), 42 (aged) and 41 (aged/sAD) cells. Scale bars: 100 μm (c) and 20 μm (d). In panels c and d, the boxes show median and 1st and 3rd quartile and the whiskers extending 1.5 times the interquartile range from the boxes. Data show box-and-whisker plots of two to four independent experiments and cells from independent HC and AD patients. Statistical analysis is performed using One-Way ANOVA followed by Bonferroni post-hoc analysis. *P < 0.05 and ***P < 0.001. Source numerical data are provided. Source data
Extended Data Fig. 3
Extended Data Fig. 3. Human tNeurons derived from sAD patients exhibit disease-related protein pathologies.
(a) IF images and quantification of proteostasis- and disease-associated protein markers, including p62/SQSTM1, ubiquitin, total Aβ and the toxic isoform Aβ42, hyperphosphorylated tau (pTau) and TDP-43 (pTDP-43) and nuclear-to-cytoplasmic (N-to-C) ratio of TDP-43 in tNeurons shown as full images for Fig. 1g. Cells are co-stained with Tuj1. White dash line represents the nuclear region (N). p62/SQSTM1: n = 62 (young), 62 (aged) and 66 (aged/sAD) cells; ubiquitin: n = 46 (young), 53 (aged) and 66 (aged/sAD) cells; total Aβ: n = 111 (young), 106 (aged) and 114 (aged/sAD) cells; Aβ42: n = 103 (young), 95 (aged) and 93 (aged/sAD) cells; pTau: n = 91 (young), 89 (aged) and 114 (aged/sAD) cells; pTDP-43: n = 91 (young), 74 (aged) and 95 (aged/sAD) cells; N-to-C ratio of TDP-43: n = 85 (young), 86 (aged) and 103 (aged/sAD) cells. Scale bar: 20 μm. (b) IF staining and quantification of small heat shock protein HspB1 in tNeurons. n = 80 (young), 111 (aged) and 134 (aged/sAD) cells. Scale bar: 20 μm. (c) Sandwich ELISA assay for detecting endogenous Aβ42 in total cell lysates of tNeurons. The values are revealed by a fold change relative to young tNeurons. n = 4 (young), 4 (aged) and 4 (aged/sAD) independent replicates. (d) IF staining of pTau and pTDP-43 with p62/SQSTM1 and ubiquitin in aged/sAD tNeurons (scale bar: 20 μm). Cells are co-stained with Tuj1 and DAPI. White dash line represents the nuclear region (N). Insert: higher magnification view of protein co-localization within individual neuron (scale bar: 5 μm). Arrowhead: protein co-localization. In panels a, b and c, the boxes show median and 1st and 3rd quartile and the whiskers extending 1.5 times the interquartile range from the boxes. Data show box-and-whisker plots of two to three independent experiments and cells from independent HC and AD patients. Statistical analysis is performed using One-Way ANOVA followed by Bonferroni post-hoc analysis. *P < 0.05, **P < 0.01 and ***P < 0.001. Source numerical data are provided. Source data
Extended Data Fig. 4
Extended Data Fig. 4. Quantitative proteomic analysis of human tNeurons identifies proteins and pathways associated with aging and sAD.
(a) Heatmap of the differentially expressed proteins across tNeurons from young, aged, aged/sAD and fAD-PSEN1 donors. (b) Top-ranked proteins (rows) changing with aging and sAD (columns) based on log2-fold change (log2-FC). (c) Gene ontology (GO) analysis of the differentially expressed proteins between young, aged and aged/sAD tNeurons. Circle sizes reflect the number of proteins. (d) Network analysis of tNeuron proteomes, including proteins in the top-ranked pathways associated with young and sAD, revealed by GeneMANIA and GO. Comparison between healthy young (n = 3 individuals) and aged/sAD tNeurons (n = 6 individuals) at PID 40. Coloured circles represent the enrichment of identified proteins revealing by log2-FC: increase in red and decrease in blue. (e) Venn diagram reveals an overlap of differentially expressed proteins between tNeurons from aged and young donors, and between tNeurons from aged/sAD and young donors. The shared hits and assigned GO terms are showed in light green colour. Interaction network for the shared hits that are either increased or decreased in aged and aged/sAD tNeurons as compared with young tNeurons. Each node representing a single protein that is divided to reflect the individual change for aged vs. young (left) and aged/sAD vs. young (right). Protein abundance increases are shown in red, and decreases shown in blue.
Extended Data Fig. 5
Extended Data Fig. 5. Quantitative proteomic and molecular analysis of tNeurons identify signatures of pathogenic mutations in the PSEN1 gene in AD patient neurons.
(a) IF images and quantification of proteostasis- and disease-associated protein markers in tNeurons from healthy young donors as well as AD patients with aged/sAD and fAD-PSEN1. White dash line represents the nuclear region (N). p62/SQSTM1: n = 62 (young), 66 (aged/sAD) and 49 (fAD-PSEN1) cells; ubiquitin: n = 46 (young), 66 (aged/sAD) and 50 (fAD-PSEN1) cells; total Aβ: n = 111 (young), 114 (aged/sAD) and 57 (fAD-PSEN1) cells; Aβ42: n = 103 (young), 93 (aged/sAD) and 68 (fAD-PSEN1) cells; pTau: n = 91 (young), 114 (aged/sAD) and 107 (fAD-PSEN1) cells; pTDP-43: n = 91 (young), 95 (aged/sAD) and 82 (fAD-PSEN1) cells; N-to-C ratio of TDP-43: n = 85 (young), 103 (aged/sAD) and 109 (fAD-PSEN1) cells. Scale bar: 20 μm. (b) Detection of endogenous Aβ42 in total cell lysates of tNeurons using sandwich ELISA assay. The values are revealed by a fold change relative to young tNeurons. n = 4 (young), 4 (aged/sAD) and 4 (fAD-PSEN1) independent replicates. (c) IF quantification of small heat shock protein HspB1 in young, aged/sAD and fAD-PSEN1 tNeurons. n = 80 (young), 134 (aged/sAD) and 136 (fAD-PSEN1) cells. (d) Top-ranked proteins (rows) changing with aged/sAD and fAD-PSEN1 (columns) based on log2-FC. (e) Network analysis of tNeuron proteins in the top-ranked pathways associated with aged/sAD and fAD-PSEN1. Comparison between aged/sAD (n = 6 individuals) and fAD-PSEN1 (n = 2 individuals) at PID 40. Coloured circles represent the enrichment of identified proteins revealing by log2FC: increase in red and decrease in blue. (f) GO analysis of the differentially expressed proteins across aged/sAD and fAD-PSEN1 tNeurons. Circle sizes reflect the number of proteins. (g) Lists of top-ranked proteins (rows) changing with fAD-PSEN1 and young (columns) based on log2FC. (h) Network analysis and differential expression of proteins detected in tNeurons from healthy young donors (n = 3 individuals) and patients with fAD-PSEN1 (n = 2 individuals) at PID 40. The top-ranked pathways for fAD-PSEN1 proteome are analysed using GO databases. Coloured circles represent the enrichment of identified proteins revealing by log2FC: increase in red and decrease in blue. (i) GO analysis of the differentially expressed proteins across fAD-PSEN1 and young tNeurons. Circle sizes reflect the number of proteins. In panels a, b and c, the boxes show median and 1st and 3rd quartile and the whiskers extending 1.5 times the interquartile range from the boxes. Data show box-and-whisker plots of two to three independent experiments and cells from independent HC and AD patients. Statistical analysis is performed using One-Way ANOVA followed by Bonferroni post-hoc analysis. *P < 0.05, **P < 0.01 and ***P < 0.001. Source numerical data are provided. Source data
Extended Data Fig. 6
Extended Data Fig. 6. Aberrant response to lysosomal damage at basal conditions and during LLOME treatment are prominent in aged/sAD tNeurons.
(a) Schematic for describing the ESCRT- and Galectin-mediated lysosomal quality control (LQC) machinery. When undergoing lysosomal damage stress, lysosomal membrane is subjected to rupture. To avoid the leakage of lysosomal contents and activation of cell death pathways, the compromised lysosomes recruit ESCRT proteins (ESCRTs) to repair the small membrane wounds and Galectins to target the massively damaged lysosomes for lysophagy. (b) Representative images for immunostaining of CHMP2B (magenta), LAMP2 (green) and Tuj1 (blue) in young, aged and aged/sAD tNeurons, related to Fig. 3c. Arrowhead: high-density accumulations of CHMP2B in the vicinity of plasma membrane (solid) and within neurites (hollow). Scale bar: 10 μm. (c) Representative images for immunostaining of Galectin-3 (magenta), LAMP2 (green) and Tuj1 (blue) in young, aged and aged/sAD tNeurons, related to Fig. 3c. Scale bar: 10 μm. (d) Measurement of spontaneous cell death, indicated by apoptosis markers (for example active Caspase-3/7), in young, aged, aged/sAD and fAD-PSEN1 tNeurons during in vitro culture at PID 35, 38 and 42. PID 35: n = 162 (young), 158 (aged), 148 (aged/sAD) and 136 (fAD-PSEN1) cells; PID 38: n = 163 (young), 159 (aged), 147 (aged/sAD) and 156 (fAD-PSEN1) cells; PID 42: n = 159 (young), 151 (aged), 142 (aged/sAD) and 145 (fAD-PSEN1) cells. (e) Immunostaining of TDP-43 and Hsp70 (magenta), LAMP1 (green) and Tuj1 (blue) during DMSO Ctrl or 0.25 mM LLOME treatment for 30 min in young, aged, aged/sAD tNeurons at PID 35 (scale bar: 10 μm). Insert: higher magnification view of protein co-localization within individual neuron (scale bar: 2 μm). Arrowhead: protein co-localization. (f) Changes in lysosomal acidification by detecting the intensity of preloaded pH-sensitive FITC-conjugated Dextran in tNeurons at basal conditions and during 0.25 mM LLOME treatment for 30 min. Ctrl: n = 145 (young), 135 (aged) and 148 (aged/sAD) cells; LLOME: n = 142 (young), 137 (aged) and 155 (aged/sAD) cells. (g) IF analysis of co-localization of APP-CTF with LAMP1 in aged/sAD tNeurons (scale bar: 10 μm). Insert: higher magnification view of APP-CTF and LAMP1 (scale bar: 2 μm). (h) IF analysis of co-localization of Aβ42 with LC3B in aged/sAD tNeurons (scale bar: 10 μm). Insert: higher magnification view of Aβ42 and LC3B (scale bar: 2 μm). In panels d and f, the boxes show median and 1st and 3rd quartile and the whiskers extending 1.5 times the interquartile range from the boxes. Data show box-and-whisker plots of three independent experiments and cell lines from independent HC and AD donors. Statistical analysis is performed using Two-Way ANOVA followed by Bonferroni post-hoc analysis. Source numerical data are provided. Source data
Extended Data Fig. 7
Extended Data Fig. 7. Abnormal lysosomal damage response links to defective organelle and calcium homeostasis in aged/sAD and fAD-PSEN1 tNeurons.
(a) Quantification of numbers of ESCRT-III CHMP2B and Galectin-3 puncta in the cell body of young, aged/sAD and fAD-PSEN1 tNeurons in the absence of lysosomal damage insults. tNeurons: CHMP2B: n = 117 (young), 97 (aged/sAD) and 104 (fAD-PSEN1) cells; Galectin-3: n = 111 (young), 95 (aged/sAD) and 104 (fAD-PSEN1) cells. (b) Quantification of numbers of ESCRT-0 HGS puncta in the cell body of young, aged/sAD and fAD-PSEN1 tNeurons during lysosomal damage insults mediated by LLOME treatment, and recovery from lysosomal damage after LLOME washout for up to 8 hr. The half-life (t1/2) represents the time required for lysosomal repair. Young: n = 108 (Ctrl), 107 (LLOME), 111 (Washout 1 hr), 118 (Washout 2 hr) and 90 (Washout 8 hr) cells; Aged/sAD: n = 115 (Ctrl), 115 (LLOME), 117 (Washout 1 hr), 109 (Washout 2 hr) and 79 (Washout 8 hr) cells; fAD-PSEN1: n = 117 (Ctrl), 117 (LLOME), 113 (Washout 1 hr), 116 (Washout 2 hr) and 85 (Washout 8 hr) cells. (c) Changes in lysosomal acidification revealed by the intensity of preloaded pH-sensitive FITC-conjugated Dextran in young, aged/sAD and fAD-PSEN1 tNeurons at basal conditions or during 0.25 mM LLOME treatment for 30 min. Ctrl: n = 145 (young), 148 (aged/sAD) and 137 (fAD-PSEN1) cells; LLOME: n = 142 (young), 155 (aged/sAD) and 147 (fAD-PSEN1) cells. (d) Quantification of changes in mitochondrial membrane potential in young, aged/sAD and fAD-PSEN1 tNeurons at basal conditions and after the treatment of DMSO Ctrl, 20 µM FCCP or 0.25 mM LLOME for 30 min by analysing TMRE intensity. The values are revealed by a fold change relative to young tNeurons treated with DMSO. n = 6 (young), 6 (aged/sAD) and 6 (fAD-PSEN1) independent replicates. (e) Live-cell imaging and analysis of lysosomal calcium revealed by Cal-520, a fluorogenic calcium-sensitive indicator, conjugated with Dextran molecules, in young, aged, aged/sAD and fAD-PSEN1 tNeurons at basal conditions. Lysosomes are labelled with Lysotracker Red DND-99 (scale bar: 40 μm). n = 163 (young), 156 (aged), 187 (aged/sAD) and 139 (fAD-PSEN1) cells. Insert: higher magnification view of Cal-520 and Lysotracker Red DND-99 (scale bar: 5 μm). (f) Analysis of correlation between intracellular Aβ42 levels and lysosomal acidification or calcium in young, aged, aged/sAD and fAD-PSEN1 tNeurons. n = 9 independent replicates from three donors (lysosomal acidification) and n = 6 independent replicates from two donors (lysosomal calcium) from three independent experiments. Black solid line represents the fitted linear correlation. Coefficient of Discrimination (R2) is calculated using Pearson’s correlation. In panel a, b, c, and e, the boxes show median and 1st and 3rd quartile and the whiskers extending 1.5 times the interquartile range from the boxes. In panel d, data are displayed as mean ± SD. Data show mean and SD or box-and-whisker plots of two to three independent experiments and three cell lines from independent HC and AD donors. Statistical analysis is performed using One-Way ANOVA (a, and e) or Two-Way ANOVA (b, c and d) followed by Bonferroni post-hoc analysis. *P < 0.05, **P < 0.01 and ***P < 0.001. ###P < 0.001. Source numerical data are provided. Source data
Extended Data Fig. 8
Extended Data Fig. 8. Lysosomal damage correlates with aging and intrinsic disease properties in AD patient neurons.
(a) Analysis of correlation between intracellular Aβ42 levels and CHMP2B puncta numbers in young, aged, aged/sAD and fAD-PSEN1 tNeurons. (b) Analysis of correlation between intracellular total Aβ levels and Galectin-3 or CHMP2B puncta numbers in young, aged, aged/sAD and fAD-PSEN1 tNeurons. (c) Analysis of correlation between lysosomal acidification and Galectin-3 or CHMP2B puncta numbers in young, aged, aged/sAD and fAD-PSEN1 tNeurons. (d) Analysis of correlation between lysosomal calcium and Galectin-3 or CHMP2B puncta numbers in young, aged, aged/sAD and fAD-PSEN1 tNeurons. Panel a, b and c: n = 9 independent replicates from three donors and three experiments; Panel d: n = 6 independent replicates from two donors and three experiments. Black solid line represents the fitted linear correlation. Coefficient of Discrimination (R2) is calculated using Pearson’s correlation. Source numerical data are provided. Source data
Extended Data Fig. 9
Extended Data Fig. 9. Lysosomal damage markers are elevated in the cortex of old mice and associated with neuropathological signatures of AD in the cortex of APP transgenic mice.
(a) Experimental schematic for wild-type young (3-month old) and old (20 to 24-month old) mice. (b) Representative images and IF quantification of Galectin-3 immunoreactivity and lysosomal size based on LAMP1 signals in neurons of wild-type young and old mice. Galectin-3: n = 3 mice; Lysosomal size: n = 4 mice; Scale bar: 50 μm. (c) Experimental schematic for non-transgenic wild-type mice (NTg) and transgenic mice expressing mutant human APP with the Swedish (K670N/M671L) and London (V717I) mutations (APPLon/Swe) (3 to 6-month old). (d) IF staining and quantification of Aβ42, LAMP1, CHMP2B and Galectin-3 in the neocortex of NTg and APPLon/Swe transgenic mice, related to Fig. 4b. Extracellular and intraneuronal co-localization of CHPM2B with LAMP1 in the brain of APPLon/Swe mice. The brain tissue is co-stained with MAP2 and Hoechst (scale bar: 50 μm). Aβ42: n = 8 (NTg) and 13 (APPLon/Swe) mice; LAMP1: n = 8 (NTg) and 13 (APPLon/Swe) mice; CHMP2B: n = 10 (NTg) and 11 (APPLon/Swe) mice; Galectin-3: n = 10 (NTg) and 12 (APPLon/Swe) mice. Insert: higher magnification view of co-localization between CHMP2B, Galectin-3, LAMP1 and Aβ42 (scale bar: 10 μm). Arrowhead: CHMP2B and LAMP1 co-localization in an individual neuron. (e) Immunostaining of Galectin-3 (magenta), LAMP1 (cyan) and MAP2 (grey) counterstained with Hoechst (yellow) in the cortex of NTg and APPLon/Swe mice (scale bar: 50 μm). Inset: higher magnification view of LAMP1-positive inclusions (scale bar: 50 μm). (f) Immunostaining of Hsp70 (magenta), LAMP1 (cyan) and MAP2 (grey) counterstained with Hoechst (yellow) in the cortex of NTg and APPLon/Swe mice (scale bar: 50 μm). Inset: higher magnification view of LAMP1-positive inclusions (scale bar: 50 μm). Panel b and d are displayed as mean ± SD from three to four independent experiments in aging and AD mice model. Statistical analysis is performed using two-sided Student’s t-test. *P < 0.05, **P < 0.01 and ***P < 0.001. Source numerical data are provided. Source data
Extended Data Fig. 10
Extended Data Fig. 10. AD patients show prominent lysosomal damage phenotypes in brain tissue and elevated inflammatory factor secretion in CSF samples.
(ac) Immunostaining of LAMP2 (cyan) and MAP2 (grey) along with CHMP2B (a), Galectin-3 (b) or Aβ(6E10) (c) (magenta), in the post-mortem cerebral cortex of HC and AD donors, related to Fig. 4c (scale bar: 20 μm). #: indicates images acquired from different individuals. Inset: higher magnification view of LAMP2-positive inclusions within individual neuron (scale bar: 10 μm). (d) IF quantification of LAMP2, CHMP2B, Galectin-3 and Aβ(6E10) in the post-mortem cerebral cortex of HC and AD donors. HC: n = 4; AD: n = 4 individuals. (e) Secreted inflammatory factors by human tNeurons are detected in human brain cells. Single-cell transcriptomic analysis of selected cytokines and chemokines from Fig. 5d,e in major cell types of human brain, including neuron, astrocyte, microglia and oligodendrocyte. The transcript expression scores (H: high; M: medium; L: low) is determined by the expression level of each transcript in public datasets retrieved from the Human Cell Atlas and Allen Brain Map. (f) Quantification of changes in the levels of inflammatory panel biomarkers measured in human CSF from HC and AD donors using the SOMAScan assay platform. HC: n = 50; AD: n = 29 individuals. In panel d, IF data are displayed as mean ± SD. In panel f, the boxes show median and 1st and 3rd quartile and the whiskers extending 1.5 times the interquartile range from the boxes. Statistical analysis is performed using two-sided Student’s t-test. *P < 0.05, **P < 0.01. Source numerical data are provided. Source data

Update of

Similar articles

Cited by

References

    1. Balch, W. E., Morimoto, R. I., Dillin, A. & Kelly, J. W. Adapting proteostasis for disease intervention. Science319, 916–919 (2008). - PubMed
    1. Kaushik, S. & Cuervo, A. M. Proteostasis and aging. Nat. Med.21, 1406–1415 (2015). - PubMed
    1. Hughes, A. L. & Gottschling, D. E. An early age increase in vacuolar pH limits mitochondrial function and lifespan in yeast. Nature492, 261–265 (2012). - PMC - PubMed
    1. Gottschling, D. E. & Nyström, T. The upsides and downsides of organelle interconnectivity. Cell169, 24–34 (2017). - PMC - PubMed
    1. Lapierre, L. R., Kumsta, C., Sandri, M., Ballabio, A. & Hansen, M. Transcriptional and epigenetic regulation of autophagy in aging. Autophagy11, 867–880 (2015). - PMC - PubMed

Publication types

MeSH terms

LinkOut - more resources