. 2025 Mar 26;16(1):2954.
doi: 10.1038/s41467-025-58135-4.

Resolving multi-image spatial lipidomic responses to inhaled toxicants by machine learning

Affiliations

Resolving multi-image spatial lipidomic responses to inhaled toxicants by machine learning

Nathanial C Stevens et al. Nat Commun. .

Abstract

Regional responses to inhaled toxicants are essential to understand the pathogenesis of lung disease under exposure to air pollution. We evaluate the effect of combined allergen sensitization and ozone exposure on eliciting spatial differences in lipid distribution in the mouse lung that may contribute to ozone-induced exacerbations in asthma. We demonstrate the ability to normalize and segment high resolution mass spectrometry imaging data by applying established machine learning algorithms. Interestingly, our segmented regions overlap with histologically validated lung regions, enabling regional analysis across biological replicates. Our data reveal differences in the abundance of spatially distinct lipids, support the potential role of lipid saturation in healthy lung function, and highlight sex differences in regional lung lipid distribution following ozone exposure. Our study provides a framework for future mass spectrometry imaging experiments capable of relative quantification across biological replicates and expansion to multiple sample types, including human tissue.


Conflict of interest statement

Competing interests: The authors declare no competing interests.

Figures

Fig. 1
Fig. 1. Experimental design and summary of annotated lipids across positive and negative ionization modes.
a Experimental design including allergic sensitization, challenge, and ozone exposure. Left lung lobes were collected 24 h following the final day of ozone exposure. b Summary of all lipid annotations grouped by major class, subclass, and saturation validated by LC-MS/MS of scraped tissue slides and microdissected lung tissue under identical experimental conditions as previously reported. The individual annotation list is included in Supplementary Data 1 and a supplemental list containing the proportion of lipids in each major class, including saturated and unsaturated lipid species, is included in Supplementary Data 2. Source data for panel b are provided as a Source Data file.
Fig. 2
Fig. 2. Effect of TIC and sparse LOESS normalization on technical variance in MSI signal intensity.
Total ion current scatterplots of signal intensity vs. pixel number according to acquisition order in negative ionization mode for (a) raw, (b) TIC, and (c) sparse LOESS normalized data. d–f Total ion current ion images for a representative sample displaying the raw, TIC, and sparse LOESS normalized signal intensity in negative mode, respectively. TIC values correspond to the sum intensity of all annotated compounds for each pixel. Sample ID reflects the identity of individual imaging runs in order of data acquisition. Bar = 1 mm. Source data for panels (ac) are provided as Source Data files.
Fig. 3
Fig. 3. Spatial distribution of individual phospholipid species in sparse LOESS-normalized ion images.
Ion images representing pixel intensities of annotated phospholipids in negative mode, including (a) PE 18:0/22:6, (b) PI 36:4, and (c) PA 16:0/16:0. Ion images correspond to a representative sample from the female control group. Ion images for each lipid species from each individual sample is included in Supplementary Fig. 4. Bar = 1 mm. No acyl chain information was available for PI 36:4 based on the LC-MS/MS reference library used for peak annotation.
Fig. 4
Fig. 4. Segmentation and colocalization analysis of annotated lipids.
a Representative positive ionization mode tissue section segmented into individual regions by Seurat-based KNN clustering analysis. Extracted pixels from clusters corresponding roughly to the (b) airway epithelium (Cluster 9), (c) airway basement membrane (Cluster 3), and (d) alveolar epithelium (Cluster 8) from a matched H&E-stained serial section (Supplementary Fig. 2). e Heatmap displaying the median-scaled intensity of the top-5 lipids represented by each cluster. Lipids shared between the top-5 lists in multiple clusters are only included once. The average log2 signal intensity per pixel for each lipid is included in the top heatmap annotation. Bar = 1 mm. Source data for panel e are provided as a Source Data file.
Fig. 5
Fig. 5. Overlap between lung histology, unsupervised image segmentation, and individual lipid spatial distribution.
a Representative H&E-stained serial section selected from three separate sections from a male mouse exposed to HDM + O3 at ×4 magnification with multiple morphological regions of interest labeled. b A consecutive segmented serial section acquired by MSI, including all clusters from Fig. 4. The cluster colors in (b) generally represent the matched regions in (a). c Ion image displaying the signal intensity and distribution of phosphatidylcholine 40:6. d Ion image displaying the signal intensity and distribution of PC 38:4. Both sections analyzed by MSI and H&E staining were obtained at a thickness of 15 μm. Bar = 0.5 mm.
Fig. 6
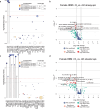
Fig. 6. Comparison of airway and alveolar epithelial changes in lipid composition between HDM + O3 and control-treated female mice.
a Dot plot summarizing lipid class enrichment results comparing female HDM + O3 and control-treated airway epithelium. Lipid classes were separated into fatty acyls with a high degree of saturation (Sat.) or a low degree of saturation (Unsat.). b Volcano plot summarizing significantly altered lipids in the airway epithelium comparing the HDM + O3 group relative to female control mice. c Dot plot summarizing lipid class enrichment results comparing female HDM + O3 and control-treated alveolar epithelium. d Volcano plot summarizing significantly altered lipids in the alveolar epithelium comparing the HDM + O3 group relative to female control mice. All dot plots and volcano plots used a p value cutoff of p < 0.05 to determine statistical significance. The fold change direction for all panels is expressed as the abundance in the HDM + O3 group relative to the control group. P values for enrichment analyses were based on a one-sided Kolmogorov-Smirnov Test with FDR-correction. P values for univariate analyses were determined based on a one-way ANOVA with Tukey’s post hoc analysis in R using a 95% confidence interval and default R function parameters. A log2 fold-change of 0.5 (or a fold-change that is greater than 1) was used to define a high-effect size. Fatty acid (FA), acylcarnitine (AC), cardiolipin (CL), ceramide (Cer), cholesterol ester (CE), dihydrosphingomyelin (DhSM), glycosylceramide (HexCer), lysophosphatidylcholine (LPC), lysophosphatidylethanolamines (LPE), lysophosphatidylglycerol (LPG), lysophosphatidylinositol (LPI), sphingomyelin (SM), phosphatidic acid (PA), phosphatidylcholine (PC), phosphatidylethanolamine (PE), phosphatidylglycerol (PG), phosphatidylinositol (PI), phosphatidylserine (PS), triacylglycerol (TG). Source data for panels a-d are provided as Source Data files.

Update of

References

    1. ALA. State of the air report 2022. Chicago, IL: American Lung Association; 2022.
    1. Tetreault, L. F. et al. Childhood exposure to ambient air pollutants and the onset of asthma: An administrative cohort study in Quebec. Environ. Health Perspect.124, 1276–1282 (2016). - PMC - PubMed
    1. Thurston, G. D. et al. Ta. Outdoor air pollution and new-onset airway disease: An official. Am. Thorac. Soc. Workshop Rep.17, 387–398 (2020). - PMC - PubMed
    1. Guarnieri, M. & Balmes, J. R. Outdoor air pollution and asthma. Lancet383, 1581–1592 (2014). - PMC - PubMed
    1. Plopper, C. et al. Relationship of inhaled ozone concentration to acute tracheobronchial epithelial injury, site-specific ozone dose, and glutathione depletion in rhesus monkeys. Am. J. Respir. Cell Mol. Biol.19, 387–399 (1998). - PubMed