. 2025 Mar 26;11(1):52.
doi: 10.1038/s41522-025-00671-4.

Vaginal host immune-microbiome-metabolite interactions associated with spontaneous preterm birth in a predominantly white cohort

Affiliations

Vaginal host immune-microbiome-metabolite interactions associated with spontaneous preterm birth in a predominantly white cohort

Megan Cavanagh et al. NPJ Biofilms Microbiomes. .

Abstract

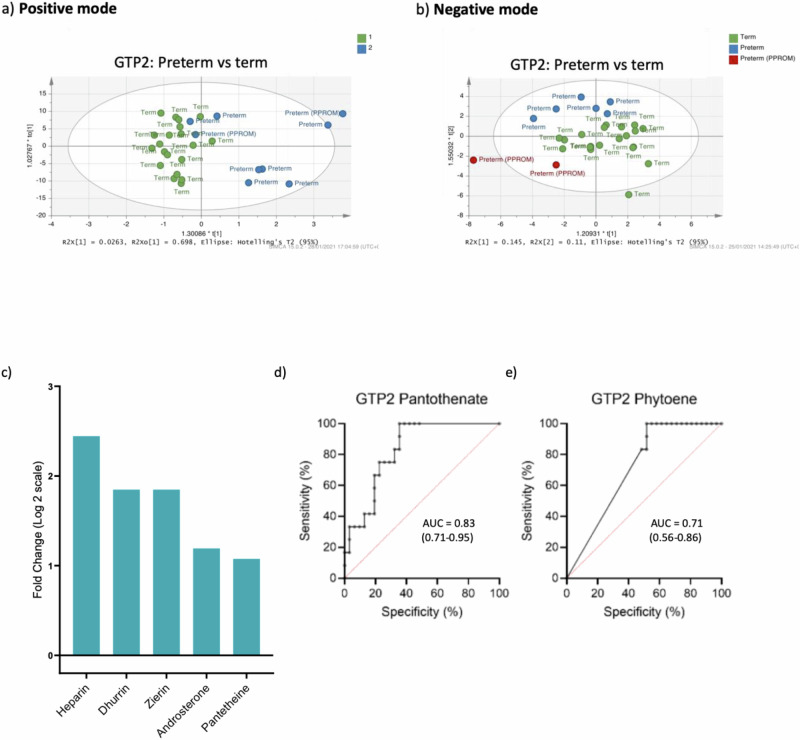
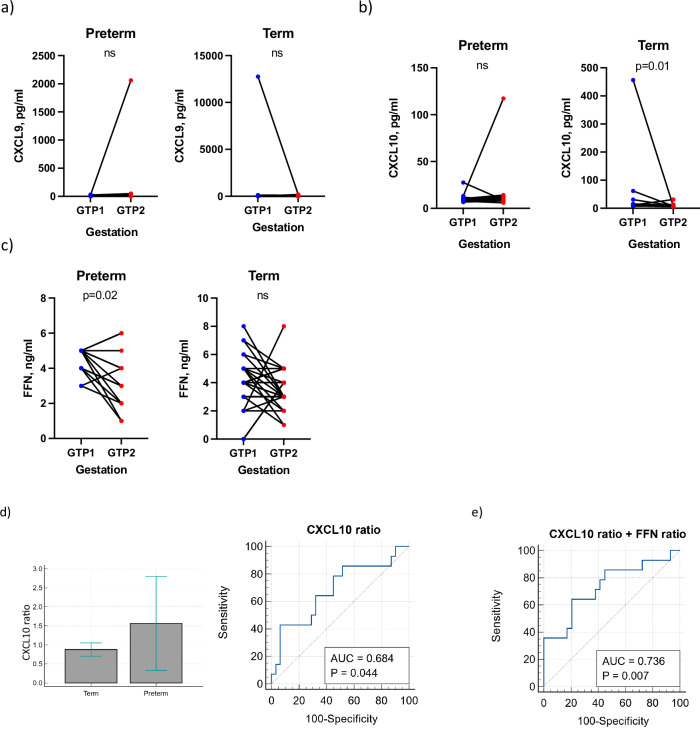
In order to improve spontaneous preterm birth (sPTB) risk stratification in a predominantly white cohort of non-labouring pregnant women, we analysed their vaginal microbiota, metabolite, cytokine and foetal fibronectin (FFN) concentrations at two gestational time points (GTPs): GTP1 (20+0-22+6 weeks, preterm = 17; term = 32); and GTP2 (26+0-28+6 weeks, preterm = 14; term = 31). At GTP1, the preterm-delivered women showed abundant G. vaginalis (AUC = 0.77) over L. crispatus and L. iners, and upregulation of 10 metabolites. At GTP2, the same women had more lactobacilli- and mixed anaerobes-dominated microbiota, upregulation of five metabolites, and decreased TNFR1, distinguishing them from their term counterparts (AUC = 0.88). From GTP1 to GTP2, sPTB was associated with increased microbiota α-diversity, and upregulation of pantothenate and urate. CXCL10 declined in the term-delivered women by ~3-fold, but increased in the preterm-delivered women (AUC = 0.68), enhanced by FFN (AUC = 0.74). Characterising the complex dynamic interactions between cervicovaginal microbial metabolites and host immune responses could enhance sPTB risk stratification.


Conflict of interest statement

Competing interests: The authors declare no competing interests.

Figures

Fig. 1
Fig. 1. Study population and sample flow chart.
GTP gestational time point.
Fig. 2
Fig. 2. Changes in cervicovaginal bacterial community at gestational time point (GTP) 1 (20–22 weeks).
a Community state types (CSTs) and b Alpha-diversity. Key: red = high or more dominant; blue = low or less dominant. Term = 13 vs. preterm = 8. Wilcoxon rank-sum test, p < 0.0001.
Fig. 3
Fig. 3. Comparison of bacterial species relative abundance at the gestational time point (GTP) 1 (20–22 weeks).
The bacterial species relative abundances in the term group were very low (zero in most cases) relative to the preterm group, hence, the bars are almost absent. Term = 13 vs. preterm = 8. Wilcoxon rank-sum test, bars represent mean, error bars represent 95% confidence interval.
Fig. 4
Fig. 4. Relative abundance of clinically relevant cervicovaginal bacterial species at GTP1 (20-22 weeks).
a Gardnerella vaginalis/Lactobacillus crispatus ratio. b Gardnerella vaginalis/Lactobacillus iners ratio (middle line = median, error bars = 95% Confidence Interval, Wilcoxon rank-sum test). c–e Receiver operating characteristic curve analysis of cervicovaginal bacterial species relative abundance for the prediction of spontaneous preterm birth. Term = 13; Preterm = 8. AUC area under receiver operating characteristic curve, GTP gestational time point.
Fig. 5
Fig. 5. Orthogonal projections to latent structures discriminant analysis (OPLS-DA) of cervicovaginal fluid samples of preterm- and term-delivered women at gestational time point (GTP) 1 (20–22 weeks, n = 49).
a Positive ionisation mode that detects peaks corresponding to protonated metabolites. b Negative ionisation mode, which detects peaks corresponding to deprotonated metabolites. c Fold change of metabolites that differ between preterm- vs. term-delivered women at GTP1. All the metabolites were upregulated in the women who delivered preterm except isobutrin (Welch’s t-test).
Fig. 6
Fig. 6. Changes in cervicovaginal bacterial community at gestational time point (GTP) 2 (26-28 weeks).
a Community state types (CSTs) and b Alpha-diversity. Key: red = high or more dominant; blue = low or less dominant. Term = 13 vs. preterm = 6. Wilcoxon rank-sum test, p < 0.0001.
Fig. 7
Fig. 7. Orthogonal projections to latent structures discriminant analysis (OPLS-DA) of cervicovaginal fluid samples of preterm- and term-delivered women at gestational time point (GTP) 2 (26–28 weeks, n = 45).
a Positive ionisation mode that detects peaks corresponding to protonated metabolites. b Negative ionisation mode, which detects peaks corresponding to deprotonated metabolites. c Fold change of metabolites that differ between preterm- vs. term-delivered women at GTP2. All the metabolites were upregulated in the women who delivered preterm compared to their term-delivered counterparts (Welch’s t-test). d and e Receiver operating characteristic curve analysis of the performance of pantothenate and phytoene for prediction of spontaneous preterm birth at GTP2 (Term = 31, Preterm = 14). AUC area under the ROC curve (95% confidence interval).
Fig. 8
Fig. 8. Receiver operating characteristic (ROC) curve analysis for TNFR1.
TNFR1 was able to distinguish both groups at GTP2 (26–28 weeks) (n = 12, term = 8, preterm = 4). TNFR1 tumour necrosis factor receptor 1, AUC area under the ROC curve, GTP gestational time point.
Fig. 9
Fig. 9. Changes in cervicovaginal bacterial community in asymptomatic pregnant women between gestational time points (GTPs).
a and b Community state types (CSTs). Key: red = high or more dominant; blue = low or less dominant. c and d Alpha-diversity. There was a decrease in community diversity from GTP1 to GTP2 in the term-delivered women, while an opposite trend was observed in the preterm-delivered women (p < 0.0001). GTP1: 20–22 weeks (n = 21); GTP2: 26–28 weeks (n = 19), term = 26 and preterm = 14; Wilcoxon rank-sum test.
Fig. 10
Fig. 10. Comparison of bacterial species relative abundance between gestational time points.
GTP1 (20–22 weeks, n = 21) vs. GTP2 (26–28 weeks, n = 19). Wilcoxon rank-sum test (p < 0.0001). GTP gestational time point.
Fig. 11
Fig. 11. Orthogonal projections to latent structures discriminant analysis (OPLS-DA) of cervicovaginal fluid samples of preterm- and term-delivered women between gestational time points (GTPs) 1 and 2.
a Positive ionisation mode that detects peaks corresponding to protonated metabolites. b Negative ionisation mode, which detects peaks corresponding to deprotonated metabolites. A clear separation was observed between GTP 1 and 2 in the term-delivered women (negative ionisation mode). Whereas, a similar but less distinct trend was observed in the preterm-delivered women perhaps due to the relatively smaller number of samples. GTP1 (n = 49) and GTP2 (n = 45).
Fig. 12
Fig. 12. Comparison of cervicovaginal metabolite changes across gestation and in relation to birth outcome.
a Fold change of metabolites that differ between GTP1 and GTP2 in the combined sample population. Nicotinamide adenine dinucleotide and 1-(5-Phospho-d-ribosyl)-5-amino-4-imidazolecarboxylate were upregulated in GTP1 samples and downregulated in GTP2 samples, while the other metabolites were upregulated in GTP2 samples. b Fold change in metabolite abundance from GTP1 to GTP2 in preterm- vs. term-delivered women determined by ANOVA. Pantothenate, putrescine, and pyruvate were significantly higher in the preterm-delivered women and increased from GTP1 to GTP2 in this group compared with term-delivered women. These metabolites also decreased significantly in the term-delivered women from GTP1 to GTP2 compared to women who delivered preterm. c Changes in metabolite abundance determined by subtracting the abundance at GTP1 from GTP2 (Welch’s t-test); and d these metabolite changes predicted risk of spontaneous preterm birth. GTP1 - 20-22 weeks (n = 49, term = 32, preterm = 17), GTP2—26–28 weeks (n = 45, term = 31, preterm = 14); GTP1 + GTP2 refers to combined sample population. Abundance = normalised % total ion count. Midline = median, error bars = 95% confidence interval; AUC area under receiver operating characteristic curve, GTP gestational time point.
Fig. 13
Fig. 13. Gestational changes in cervicovaginal fluid levels of inflammatory markers between gestational time points.
a CXCL9, b CXCL10 and c foetal fibronectin. (GTP1: 20–22 weeks, n = 45; and GTP2: 26–28 weeks, n = 45). CXCL9 and CXCL10 increased in the preterm-delivered women (though not significantly) from GTP1 to GTP2. By contrast, both chemokines decreased in the term women from GTP1 to GTP2. However, this trend was only significant for CXCL10 by 3-fold. Exclusion of the “outlier” data from the analysis did not change the outcome. Furthermore, FFN decreased with gestation irrespective of delivery outcome, especially in the preterm-delivered women (Wilcoxon matched-pairs signed rank test). d and e CXCL10 and a combination of CXCL10 and FFN levels expressed as ratios of GTP1/GTP2, distinguished the groups (n = 45, term = 31, preterm = 14). CXCL9, Chemokine (C-X-C motif) ligand 9 or monokine induced by gamma interferon (MIG); CXCL10, C-X-C motif chemokine ligand 10 (CXCL10) or Interferon gamma-induced protein 10 (IP10); FFN foetal fibronectin, AUC area under the ROC curve, GTP gestational time point.

References

    1. Gajer, P. et al. Temporal dynamics of the human vaginal microbiota. Sci. Transl. Med.4, 132ra152 (2012). - PMC - PubMed
    1. Srinivasan, S. et al. Temporal variability of human vaginal bacteria and relationship with bacterial vaginosis. PLoS ONE5, e10197 (2010). - PMC - PubMed
    1. Kaur, H., Merchant, M., Haque, M. M. & Mande, S. S. Crosstalk between female gonadal hormones and vaginal microbiota across various phases of women’s gynecological lifecycle. Front. Microbiol.11, 551 (2020). - PMC - PubMed
    1. Ravel, J. et al. Daily temporal dynamics of vaginal microbiota before, during and after episodes of bacterial vaginosis. Microbiome1, 29 (2013). - PMC - PubMed
    1. Auriemma, R. S. et al. The vaginal microbiome: a long urogenital colonization throughout woman life. Front. Cell. Infect. Microbiol.11, 686167 (2021). - PMC - PubMed

LinkOut - more resources