. 2025 Apr;10(4):973-991.
doi: 10.1038/s41564-025-01959-z. Epub 2025 Mar 26.

Metabolic modelling reveals the aging-associated decline of host-microbiome metabolic interactions in mice

Affiliations

Metabolic modelling reveals the aging-associated decline of host-microbiome metabolic interactions in mice

Lena Best et al. Nat Microbiol. 2025 Apr.

Abstract

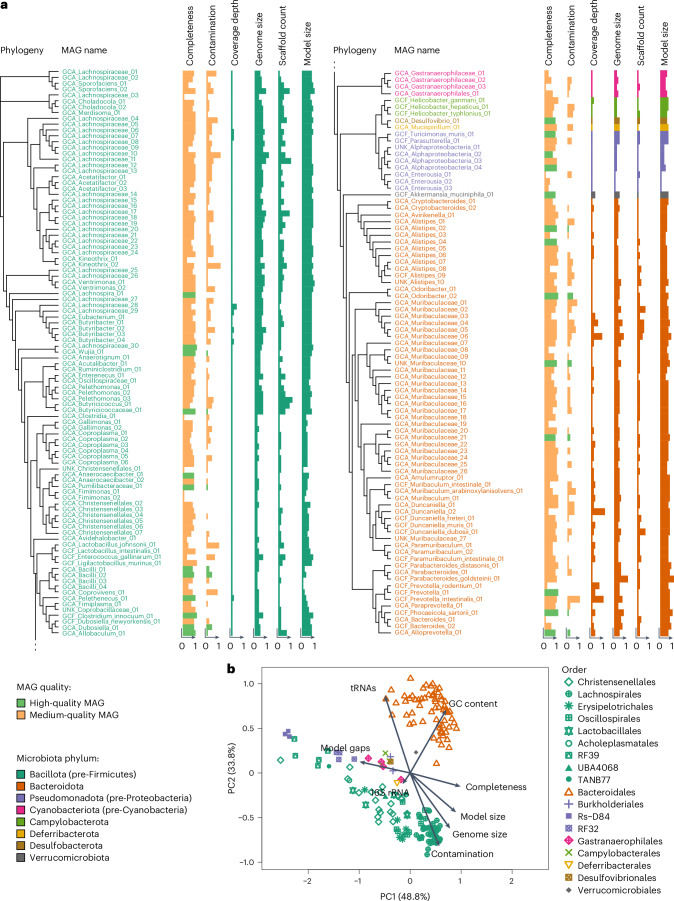
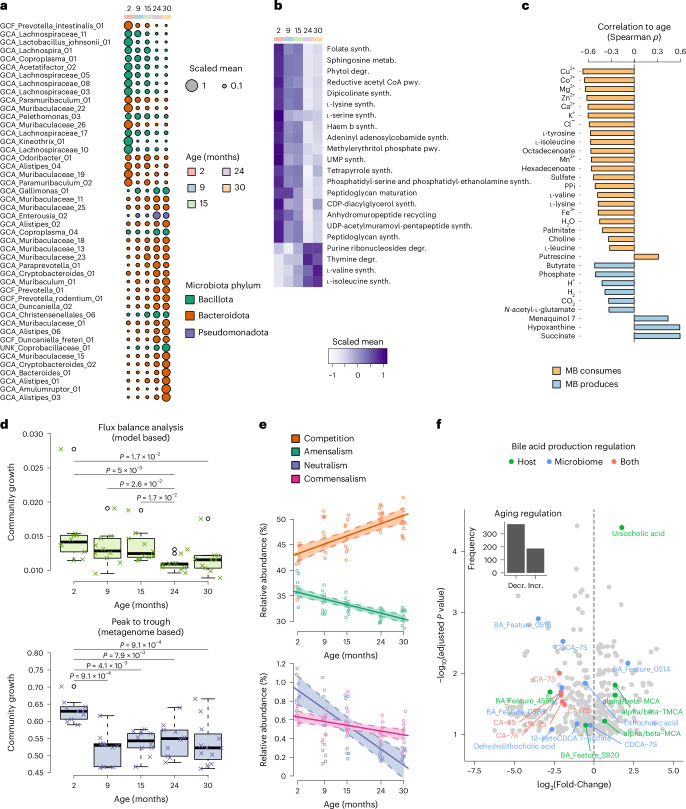
Aging is accompanied by considerable changes in the gut microbiome, yet the molecular mechanisms driving aging and the role of the microbiome remain unclear. Here we combined metagenomics, transcriptomics and metabolomics from aging mice with metabolic modelling to characterize host-microbiome interactions during aging. Reconstructing integrated metabolic models of host and 181 mouse gut microorganisms, we show a complex dependency of host metabolism on known and previously undescribed microbial interactions. We observed a pronounced reduction in metabolic activity within the aging microbiome accompanied by reduced beneficial interactions between bacterial species. These changes coincided with increased systemic inflammation and the downregulation of essential host pathways, particularly in nucleotide metabolism, predicted to rely on the microbiota and critical for preserving intestinal barrier function, cellular replication and homeostasis. Our results elucidate microbiome-host interactions that potentially influence host aging processes. These pathways could serve as future targets for the development of microbiome-based anti-aging therapies.


Conflict of interest statement

Competing interests: The authors declare no competing interests.

Figures

Fig. 1
Fig. 1. Mouse microbiome and metabolic model characterization.
a, Phylogenetic tree of the 181 MAGs. See Supplementary Table 1.2 for detailed metadata information. b, Principal component analysis of the metabolic models of the mouse microbiota. Metadata associations to PCs are overlaid as arrows; the shapes denote the taxonomic rank order; the colouring of the symbols are according to a.
Fig. 2
Fig. 2. Correlation-derived host–microbiome interactions.
ac, Interactions between host biological processes and microbiome metabolic subsystems for the colon (a), liver (b) and brain (c). Only processes with the most significant associations (colon FDR ≤ 1 × 10−10, liver FDR ≤ 1 × 10−4 and brain FDR ≤ 1 × 10−3) with at least two interactions are shown. For complete data and full pathway names, see Supplementary Tables 2.1–2.4. d, Enrichment of microbiome-associated host genes among microbiome-colonization-responsive genes. FDR-corrected P values from upper-tailed (one-sided) hypergeometric tests of the overlap plotted above each bar.
Fig. 3
Fig. 3. Model-predicted host–microbiome interactions.
a, Structure of the metamodel. The solid borders indicate compartments of the metamodel. The black arrows indicate metabolite exchanges between compartments. The dashed borders indicate compartments represented only by exchange reactions. The white arrows indicate the direction of metabolic exchanges along the bloodstream. BBB, blood–brain barrier. b, Frequency of microbiome dependence of metabolite import (positive) and export (negative) across organs. Metabolites with the highest frequency of exchange across 52 models are shown (Supplementary Table 3.2). For metabolite abbreviations, see Supplementary Table 3.2. c, Microbiome dependency of microbiome-responsive host genes in a cohort of GF, conventionalized and conventionally raised mice (n = 8 each). The y axis indicates sets of genes differentially regulated in tissues and contrasts; the x-axis shows the microbiome dependency of corresponding reactions. ‘Shared’ indicates genes regulated in at least three tissues. FDR-corrected P values of Dunn’s tests following a group-level Kruskal–Wallis test are shown next to the bar plots of means with error bars representing the standard deviation. Only comparisons with a Kruskal–Wallis test P < 0.05 are shown. *P < 0.05; **P < 0.01; ***P < 0.001. Exact P values are provided in Supplementary Table 3.11. df Subsystem enrichment of model-predicted interactions between host and microbiome reactions for subsystems connected with at least two host subsystems and an FDR-corrected enrichment P < 10−4 (one-sided Fisher’s exact test; Supplementary Tables 3.3–3.5). For pathway abbreviations, please see Supplementary Tables 3.3–3.5.
Fig. 4
Fig. 4. Microbiome alterations associated with host age.
a, Aging-associated changes in MAG abundance. b, Subsystem-level aging-associated changes in microbiome internal reaction fluxes. c, Aging-associated changes of host–microbiota metabolic exchange. d, Comparison of microbiome community growth rates derived from FBA or the PTR (30 months: n = 12; all others, n = 10; FDR-corrected P values from Dunn’s test following Kruskal–Wallis test). e, Aging-associated changes in model-predicted ecological interactions in the microbiota. Linear-model-derived regression with 95% confidence intervals (30 months: n = 12; all others, n = 10). f, Aging-associated changes in faecal metabolite concentrations in mice. All age-associated metabolites are shown (FDR-adjusted P ≤ 0.1 from Spearman correlations; log2(fold change (FC)) of 3 to 28 months; 3 months: n = 15; 9 months: n = 16; 15 months: n = 15; 24 months: n = 17; 28 months: n = 18; Supplementary Table 4.12). The origin of bile acids is indicated. ‘Both’ refers to bile acids produced by the host but regulated by the microbiota. Metabolites with the prefix ‘BA_Feature’ have not been fully resolved. incr., increase; decr., decrease; CA-7S, cholic acid-7-sulfate; CDCA-7S, chenodeoxycholic acid-7-sulfate; MCA, muricholic acid; TMCA, tauromuricholic acid. Box plot elements: centre line, median; box limits, 25–75% quantiles; whiskers, 1.5× interquartile range (IQR); points, outliers.
Fig. 5
Fig. 5. Aging-associated transcriptomic changes across host tissues.
Enriched GO biological processes, shared by at least two organs, are shown as the average expression of all associated features, stratified by age group and organ (hypergeometric test FDR cutoff for displayed terms: colon, 10−4; liver, 10−6, brain 10−6; 30 months: n = 12; all others n = 10). For complete data and full pathway names, see Supplementary Tables 5.4‒5.6.
Fig. 6
Fig. 6. Aging-associated changes in host–microbiome interactions.
a, Overlap between aging-regulated and microbiome-regulated host genes (P values via upper-tailed hypergeometric test). b, Colon-specific gene expression changes with age in processes correlated with microbiome metabolic functions (legend shared with c). c, Aging-dependent changes in microbiome processes correlated with host gene expression. For complete data and full pathway names, see Supplementary Tables 6.1 and 6.4. d, Frequency of microbiome dependence of aging-regulated metabolic modules across host tissues (P values via one-sided Fisher’s exact test). e, Subsystem-level enrichment of indicator reactions of aging-regulated metabolic modules (one-sided Fisher’s exact test). The x axis represents enriched host subsystems; the y axis represents aging-regulated gene sets. f, Aging association of brain metabolites predicted to be exchanged between the microbiome and host. Data from ref. (Supplementary Table 6.9). P values obtained by two-sided Wilcoxon rank-sum test. g, Aging-associated metabolome changes for selected model-predicted microbiota-produced and microbiota-consumed metabolites (P values via Kruskal–Wallis test). Data from ref. (n = 64 mice). Box plot elements: centre line, median; box limits, 25–75% quantiles; whiskers, 1.5× IQR; points, outliers. Significance: *P ≤ 0.05; **P ≤ 0.01; ***P ≤ 0.001. Exact P values are provided in Supplementary Table 6.9.
Extended Data Fig. 1
Extended Data Fig. 1. Metagenomic processing steps and results.
a Metagenomics workflow. b, c Abundance of metagenomics reads derived from b microbes or c mouse DNA. d Alpha diversity derived from metagenomic reads mapped against MAGs. b-d Dunn’s test FDR, all not significant; sample size: 30mo.: n = 12, all others n = 10. e Abundance profile of the 60 most abundant MAGs in the full cohort. Bacteroidota predominated in the cohort. Boxplot elements: center line, median; box limits, 25%–75% quantiles; whiskers, 1.5x IQR; points, outliers.
Extended Data Fig. 2
Extended Data Fig. 2. Correlation-derived host–microbiome interactions.
a High-level pathway overview of host–microbiome associations. For complete data and full pathway names, see Supplementary Table 2.4. b HUMAnN3 predicted microbial functions (MetaCyc) correlated to host colon transcription (GO biological processes) using Biobakery 3. Bacterial pyruvate fermentation and co-factor biosynthesis were negatively correlated with host side neuron survival, while microbial fatty acids were found positively associated with colon immune processes (MHC class I) and negatively with transcription regulation. These HUMAnN3-based results were generally in concordance, although much less detailed, to our MAG and metabolic model derived host-microbiome correlations (cf. Fig. 2a).
Extended Data Fig. 3
Extended Data Fig. 3. Metamodel validation.
a Maximal interaction scores for pairs of host–microbiome-associated processes versus 100 randomly selected pairs of host genes and microbiome reactions for each tissue (see Methods). P-values indicate the significance of the differences according to a two-sided Wilcoxon rank-sum test. b Randomization of germfree mouse analysis (cf. Fig. 3c). The identification of significant differences in microbiome dependence between significantly up-regulated, down-regulated as well as unregulated genes was repeated 1000 times after randomization of gene assignments and the number of significant associations was counted. The dashed red line indicates the number of significant associations in the original analysis. c Association between model-predicted microbiome dependency of metabolites in blood and explained variation of serum concentrations of the corresponding metabolite by microbiome composition in a human cohort (each dot is one metabolite). The association between microbiome dependency and explained variance is significant using Spearman’s correlation (rho=0.43, p-value = 1.5×10⁻³). Boxplot elements: center line, median; box limits, 25%–75% quantiles; whiskers, 1.5x IQR; points, outliers.
Extended Data Fig. 4
Extended Data Fig. 4. Age-dependent microbiome changes.
a MetaPhlAn4 derived species with significant changes in abundance with host age. The MetaPhlAn-based approach identified 335 bacteria at the species level of which 69 were found differentially abundant with age. The species Lactobacillus johnsonii matched the MAG based analysis (Fig. 4a). However, due to different taxonomic databases and methods of annotation the resulting species names might vary. On phylum level, the overall aging pattern of both MetaPhlAn and MAG-based taxonomic analysis yielded comparable results, which was a general decrease of Bacillota spec. and an increase of Bacteroidota spec. with host age. b Age-associated changes in metabolic fluxes within the community. c Comparison of community growth rates derived from FBA or PTR. d, e Change of microbiome community growth rate upon removal of a single MAG from the community. The y-axis shows the difference of community growth rate compared to the full community while the x-axis names the MAG that was removed in d or the age group of the host in e (p-values via FDR corrected Wilcoxon’s rank sum test). f Relative abundance of universal adaptive strategies in microbiome communities by age (p-values via FDR corrected Dunn’s test). Sample size for a-f: 30mo.: n = 12, all others n = 10. g Metabolomics derived D-galactose concentration in mouse feces increases with age (Spearman’s ρ = 0.22, unadjusted p = 0.04; Pairwise p-values via Dunn’s test with FDR correction; 3mo.: n = 15, 9mo.: n = 16, 15mo.: n = 15, 24mo.: n = 17, 28mo.: n = 18). Boxplot elements: center line, median; box limits, 25%–75% quantiles; whiskers, 1.5x IQR; points, outliers.
Extended Data Fig. 5
Extended Data Fig. 5. Aging-associated transcriptomic changes across host tissues.
a Each row represents a gene that shows common expression changes across all tissues studied (see Supplementary Table 5.7‒5.9). b–d Enriched GO biological processes are shown as the average expression of all associated features, stratified by age group and organ. (Hypergeometric test FDR cutoff for displayed terms: colon, 10−4; liver, 10−6, brain 10−6; 30 months: n = 12; all others n = 10). For complete data and full pathway names, see Supplementary Tables 5.4‒5.6.
Extended Data Fig. 6
Extended Data Fig. 6. Host-Microbiome associations in aging.
a–e Strong host–microbiome correlations stratified by age group, compared with Yates’s chi-squared test (one-sided). a Frequency of microbiome–colon correlations stratified by age group. Significance was tested via Yates’ Chi-squared test with Bonferroni multiple testing correction. b Liver transcripts correlated with microbiome reactions. c Liver transcripts partially correlated with microbiome reactions, corrected for sequencing batch. d Brain transcripts correlated with microbiome reactions. e Brain transcripts partially correlated with microbiome reactions, corrected for sequencing batch. f–g Organ-specific gene expression changes with age in GO biological processes that were also correlated with microbiome metabolic functions (F = liver, G = brain). For complete data and full pathway names, see Supplementary Tables 6.2, 6.3.
Extended Data Fig. 7
Extended Data Fig. 7. Summary of study highlights.
Multi-omics analysis and metabolic modeling of aging mice revealed a decline in microbiome metabolic activity, reducing beneficial host-microbe and microbe-microbe interactions. Aging-related microbiome changes led to the accumulation of pro-aging metabolites (D-galactose, succinate) and a decline in beneficial metabolites (nucleotides, butyrate). These shifts correlated with increased systemic inflammation and downregulation of essential host pathways, like energy and nucleotide metabolism, which are involved in intestinal barrier function and cellular homeostasis.

References

    1. Lopez, A. D., Mathers, C. D., Ezzati, M., Jamison, D. T. & Murray, C. J. L. Global and regional burden of disease and risk factors, 2001: systematic analysis of population health data. Lancet367, 1747–1757 (2006). - PubMed
    1. López-Otín, C., Blasco, M. A., Partridge, L., Serrano, M. & Kroemer, G. Hallmarks of aging: an expanding universe. Cell186, 243–278 (2023). - PubMed
    1. Aramillo Irizar, P. et al. Transcriptomic alterations during ageing reflect the shift from cancer to degenerative diseases in the elderly. Nat. Commun.9, 327 (2018). - PMC - PubMed
    1. Zhou, Y., Hu, G. & Wang, M. C. Host and microbiota metabolic signals in aging and longevity. Nat. Chem. Biol.17, 1027–1036 (2021). - PubMed
    1. Wilmanski, T. et al. Gut microbiome pattern reflects healthy ageing and predicts survival in humans. Nat. Metab.3, 274–286 (2021). - PMC - PubMed

LinkOut - more resources