. 2025 Mar 26;24(1):97.
doi: 10.1186/s12943-025-02302-0.

Inhibition of 6-phosphogluconate dehydrogenase suppresses esophageal squamous cell carcinoma growth and enhances the anti-tumor effects of metformin via the AMPK/mTOR pathway

Affiliations

Inhibition of 6-phosphogluconate dehydrogenase suppresses esophageal squamous cell carcinoma growth and enhances the anti-tumor effects of metformin via the AMPK/mTOR pathway

Bei Wang et al. Mol Cancer. .

Abstract

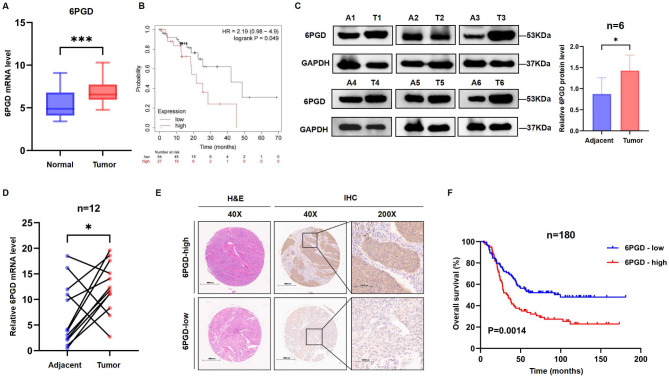
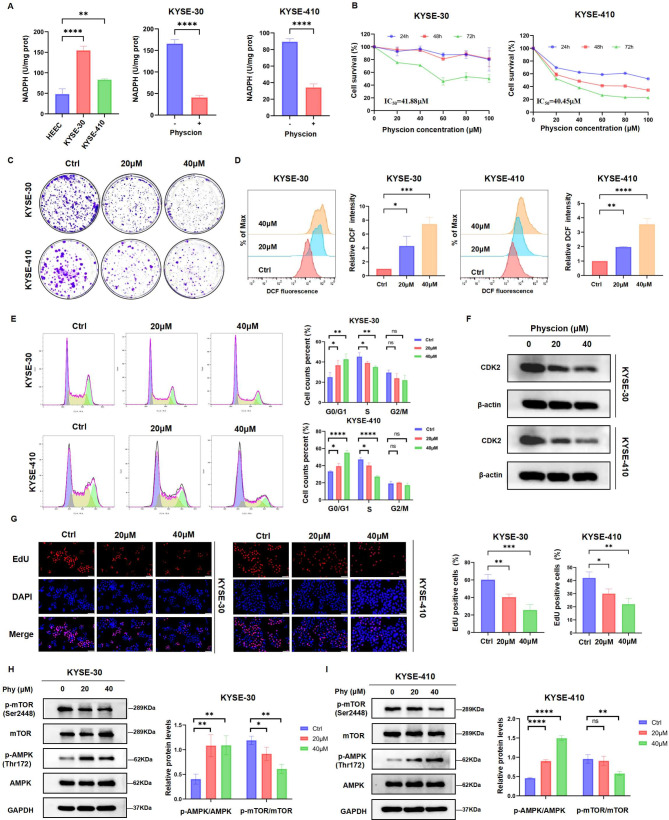
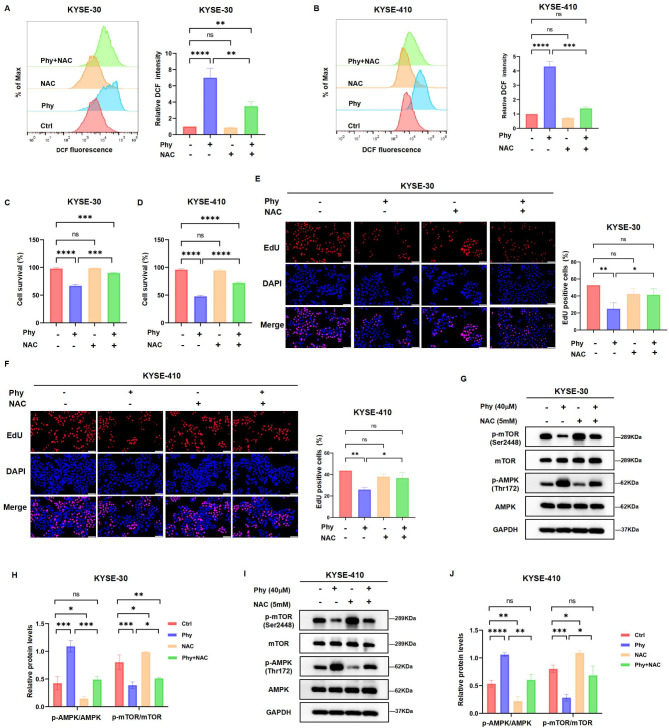
Metabolic reprogramming plays a pivotal role in the development and progression of tumors. Tumor cells rely on glycolysis as their primary energy production pathway and effectively utilize biomolecules generated by the pentose phosphate pathway (PPP) for efficient biosynthesis. However, the role of 6-phosphogluconate dehydrogenase (6PGD), a crucial enzyme in the PPP, remains unexplored in esophageal squamous cell carcinoma (ESCC). In this study, we observed a significant upregulation of 6PGD expression in ESCC tissues, which correlated with an unfavorable prognosis among patients. The experiments demonstrated that knockdown of 6PGD induces oxidative stress and suppresses ESCC cell proliferation. Mechanistically, this is achieved through AMPK activation and subsequent inhibition of downstream mTOR phosphorylation. Moreover, physcion has been found to inhibit 6PGD activity and exert its anti-ESCC effect via the AMPK/mTOR pathway. Subsequently, we conducted both in vitro and in vivo experiments to validate the anticancer efficacy of combining metformin, an AMPK activator, with physcion. The results demonstrated a significantly enhanced inhibition of ESCC growth. This study elucidates the impact of 6PGD on ESCC cell proliferation along with its underlying molecular mechanisms, highlighting its potential as a therapeutic target for ESCC. Furthermore, we investigated a novel approach for improved anti-tumor therapy involving physcion and metformin. These findings will contribute new insights to clinical treatment strategies for ESCC while providing a theoretical foundation for developing molecular targeted therapies.

Keywords: 6-phosphogluconate dehydrogenase; Esophageal squamous cell carcinoma; Metformin; Pentose phosphate pathway; Physcion.


Conflict of interest statement

Declarations. Competing interests: The authors declare no competing interests. Ethics approval and consent to participate: This study was conducted with the approval of the Ethics Committee of the Yancheng First People’s Hospital (Approval number: 2022-K-016), and all patients provided written informed consent. The animal experimental procedures strictly adhered to the guidelines for animal welfare and were approved by the Ethics Committee for Medical Experimental Animals of Jiangsu Medical College (Approval number: XMLL-2022-853).

Figures

Fig. 1
Fig. 1
The up-regulation of 6PGD in ESCC tissues is associated with a poor prognosis. (A) Expression levels of 6PGD in ESCC tissues and non-tumor esophageal tissues in the TCGA database. (B) Survival analysis based on 6PGD for ESCC using the Kaplan-Meier Plotter (n = 81, P = 0.049). (C) 6PGD protein level in tumor and adjacent tissues detected by Western blotting (n = 6). (D) The mRNA level of 6PGD in tumor and adjacent tissues quantified by RT‒qPCR (n = 12). (E) Representative H&E and IHC staining images of tumor tissues from TMAs comprising samples collected from ESCC patients. Scale bar for 40× magnification: 500 μm; scale bar for 200× magnification: 100 μm. (F) Overall survival difference between the groups with high and low expression of 6PGD (n = 180, P = 0.0014). *P < 0.05, ***P < 0.001
Fig. 2
Fig. 2
Knockdown of 6PGD suppresses the proliferation of ESCC cells. (A, B) The mRNA and protein levels of 6PGD were evaluated using RT-qPCR and western blot analyses in ESCC cell lines and normal esophageal epithelial cells (n = 3, mean ± SD). (C, D) The knockdown efficiency of 6PGD in KYSE-30 and KYSE-410 cells was validated through RT-qPCR and western blot analyses (n = 3, mean ± SD). (E) The production of NADPH decreased following the knockdown of 6PGD (n = 3, mean ± SD). (F) CCK-8 assay was employed to assess the impact of 6PGD knockdown on the viability of KYSE-30 and KYSE-410 cells (n = 3, mean ± SD). (G) The colony-forming ability of ESCC cells undergoes alterations following the knockdown of 6PGD. (H) The knockdown of 6PGD in KYSE-30 and KYSE-410 cells resulted in an elevation of intracellular ROS levels (n = 3, mean ± SD). (I-K) The alterations in the cell cycle distribution of ESCC cells following the knockdown of 6PGD (n = 3, mean ± SD). (L) Western blot analysis revealed a reduction in the expression of CDK2 protein in ESCC cells following 6PGD knockdown (n = 3, mean ± SD). (M, N) The DNA synthesis capacity in ESCC cells following 6PGD knockdown was assessed using EdU staining assays (n = 3, mean ± SD); Scale bar, 100 μm. *P < 0.05, **P < 0.01, ***P < 0.001, ****P < 0.0001; ns means non-significant
Fig. 3
Fig. 3
6PGD regulates cell proliferation by modulating the AMPK/mTOR pathway. (A) The volcano plot shows changes in gene expression after 6PGD knockdown in KYSE-30 cells. (B) KEGG pathway analysis was performed on the down-regulated genes following 6PGD knockdown in KYSE-30 cells. (C) Western blot analysis showed increased p-AMPK and decreased p-mTOR levels after 6PGD knockdown in KYSE-30 cells (n = 3, mean ± SD). (D) The elevation in intracellular ROS levels induced by 6PGD knockdown was reversed by NAC treatment (n = 3, mean ± SD). (E) NAC mitigates the reduction in cell viability caused by 6PGD knockdown (n = 3, mean ± SD). (F, G) Western blot analysis showed that NAC treatment effectively reversed the changes in phosphorylation levels of AMPK and mTOR (n = 3, mean ± SD). (H) The AMPK inhibitor (Compound C) mitigated the reduction in cell viability caused by 6PGD knockdown (n = 3, mean ± SD). (I, J) Compound C reversed the increased phosphorylation of AMPK caused by 6PGD knockdown, and subsequently restored the phosphorylation levels of mTOR (n = 3, mean ± SD). (K, L) The mTOR agonist MHY1485 mitigated the reduction in mTOR phosphorylation induced by 6PGD knockdown (n = 3, mean ± SD). (M) MHY1485 alleviated the suppressive effect of 6PGD knockdown on cellular viability (n = 3, mean ± SD). *P < 0.05, **P < 0.01, ***P < 0.001, ****P < 0.001; ns means non-significant
Fig. 4
Fig. 4
Physcion inhibits ESCC cell proliferation through the suppression of 6PGD activity. (A) The production of NADPH is upregulated in KYSE-30 and KYSE-410 cells, but it is significantly reduced after treatment with physcion (40µM) for 24 h (n = 3, mean ± SD). (B) The cell viability of KYSE-30 and KYSE-410 cells was evaluated after treatment with various concentrations of physcion for 24 to 72 h (n = 3, mean ± SD). (C) KYSE-30 and KYSE-410 cells were treated with physcion for 72 h, followed by an additional 10 days of incubation to assess colony formation. (D) Intracellular ROS levels in ESCC cells fluctuated after 48 h of physcion treatment (n = 3, mean ± SD). (E) Cell cycle changes in KYSE-30 and KYSE-410 cells were observed after exposure to physcion for 48 h (n = 3, mean ± SD). (F) Western blot analysis revealed a reduction in CDK2 protein expression in ESCC cells following physcion treatment. (G) The effect of physcion on DNA synthesis in ESCC cells was detected using an EdU staining assay (n = 3, mean ± SD); Scale bar: 100 μm. (H, I) Western blot analysis was performed to evaluate changes in p-AMPK and p-mTOR protein expression following physcion treatment (n = 3, mean ± SD). *P < 0.05, **P < 0.01, ***P < 0.001, ****P < 0.0001; ns means non-significant
Fig. 5
Fig. 5
ROS inhibitor mitigates the anticancer effects of physcion on ESCC. (A, B) Pre-treatment with NAC (5 mM) attenuated the physcion-induced increase in ROS levels in KYSE-30 and KYSE-410 cells (n = 3, mean ± SD). (C, D) CCK-8 assay showed that NAC effectively counteracted physcion’s inhibitory effect on ESCC cell viability (n = 3, mean ± SD). (E, F) The rescue effect of NAC on physcion-induced inhibition of DNA synthesis was assessed using the EdU staining assay (n = 3, mean ± SD); Scale bar: 100 μm. (G-J) The western blot analysis showed that NAC pre-treatment effectively reversed the impact of physcion on the AMPK/mTOR pathway (n = 3, mean ± SD). *P < 0.05, **P < 0.01, ***P < 0.001, ****P < 0.0001; ns means non-significant
Fig. 6
Fig. 6
The combination of metformin and physcion enhances the inhibition of ESCC cell proliferation. (A, B) The cell viability of KYSE-30 and KYSE-410 cells was evaluated after treatment with various concentrations of metformin for 24 to 72 h (n = 3, mean ± SD). (C, D) A CCK-8 assay was used to detect the effects of different concentrations of metformin alone or in combination with 40 µM physcion on the viability of ESCC cells treated for 72 h (n = 3, mean ± SD). (E, F) The effects of varying concentrations of physcion alone or in combination with 1 mM metformin on the viability of KYSE-30 and KYSE-410 cells were examined (n = 3, mean ± SD). (G) The synergistic effect of physcion and metformin in ESCC cells was investigated using Compusyn software. (H) The impact of the combination of physcion (40 µM) and metformin (1mM) on clonal formation in ESCC cells. (I, J) The EdU staining assay was employed to assess the inhibitory effect of physcion (40 µM) on DNA synthesis in ESCC cells treated with metformin (1mM) for 48 h (n = 3, mean ± SD); Scale bar: 100 μm. (K, L) Flow cytometry detected the effect of physcion combined with metformin on intracellular ROS levels (n = 3, mean ± SD). (M, N) The modulation of the AMPK/mTOR pathway in response to physcion and metformin treatments, either alone or in combination, was evaluated (n = 3, mean ± SD). *P < 0.05, **P < 0.01, ***P < 0.001, ****P < 0.0001; ns means non-significant
Fig. 7
Fig. 7
Effects of physcion combined with metformin on the growth of ESCC in vivo. The changes in body weight (A, B) and tumor volume (C, D) in nude mice after administration of physcion (20 mg/kg) and metformin (200 mg/kg) as single drugs or in combination. (E-H) The differences in tumor volume among the treatment groups (n = 6). (I) The differential expression of p-AMPK and p-mTOR in tumor tissues across various groups was assessed using western blot analysis (n = 3, mean ± SD). (J) H&E staining as well as Ki-67 IHC analysis were conducted on sections obtained from KYSE-30 tumor-bearing nude mice; Scale bar: 100 μm. (K) H&E staining was performed to assess organ damage across different treatment groups, Scale bar: 100 μm. *P < 0.05, **P < 0.01, ***P < 0.001, ****P < 0.0001; ns means non-significant
Fig. 8
Fig. 8
Graphical representation of the mechanism by which 6PGD modulates the proliferation of ESCC

References

    1. An L, Li M, Jia Q. Mechanisms of radiotherapy resistance and radiosensitization strategies for esophageal squamous cell carcinoma. Mol Cancer. 2023;22(1):140. - PMC - PubMed
    1. Zhu H, et al. Esophageal cancer in China: practice and research in the new era. Int J Cancer. 2023;152(9):1741–51. - PubMed
    1. Puhr HC, Prager GW, Ilhan-Mutlu A. How we treat esophageal squamous cell carcinoma. ESMO Open. 2023;8(1):100789. - PMC - PubMed
    1. Li K, et al. Resected lymph nodes and survival of patients with esophageal squamous cell carcinoma: an observational study. Int J Surg. 2023;109(7):2001–9. - PMC - PubMed
    1. Yin J, et al. Neoadjuvant adebrelimab in locally advanced resectable esophageal squamous cell carcinoma: a phase 1b trial. Nat Med. 2023;29(8):2068–78. - PMC - PubMed

MeSH terms

LinkOut - more resources