. 2025 Mar 26;23(1):89.
doi: 10.1186/s12915-025-02194-y.

Pangenome graph mitigates heterozygosity overestimation from mapping bias: a case study in Chinese indigenous pigs

Affiliations

Pangenome graph mitigates heterozygosity overestimation from mapping bias: a case study in Chinese indigenous pigs

Jian Miao et al. BMC Biol. .

Abstract

Background: Breeds genetically distant from the reference genome often show considerable differences in DNA fragments, making it difficult to achieve accurate mappings. The genetic differences between pig reference genome (Sscrofa11.1) and Chinese indigenous pigs may lead to mapping bias and affect subsequent analyses.

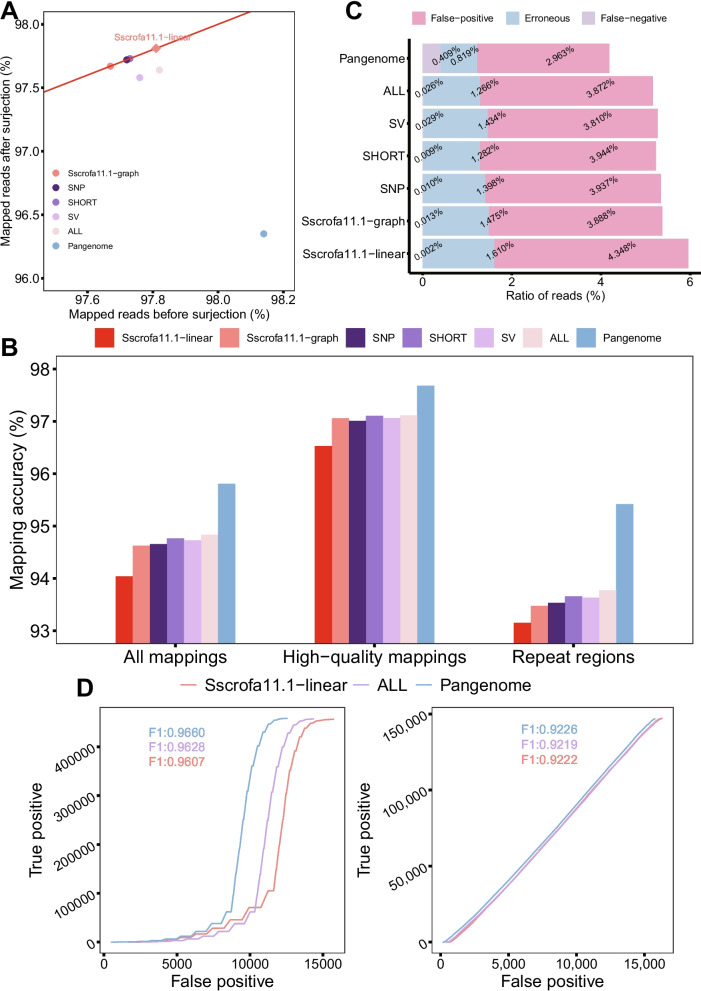
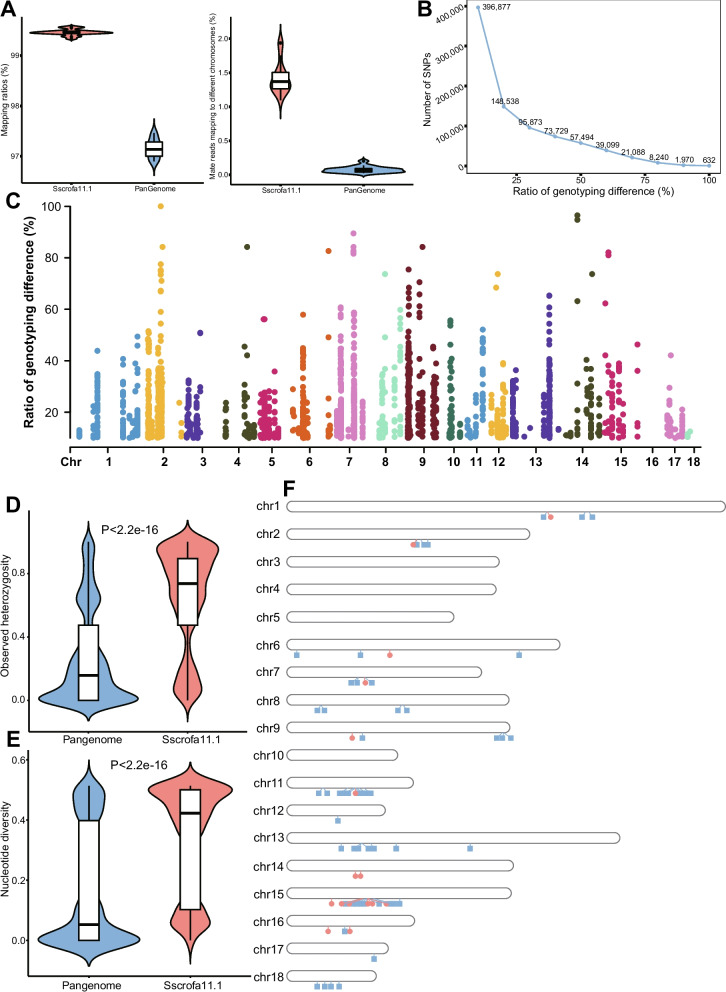
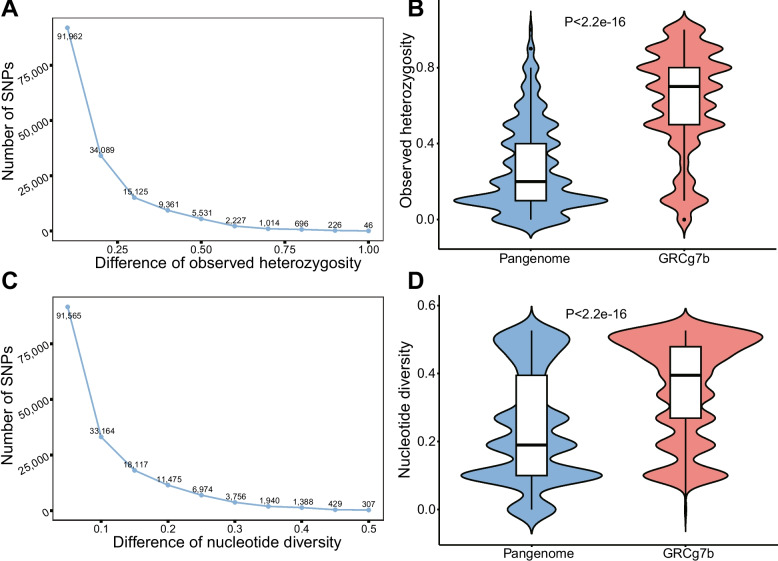
Results: Our analysis revealed that pangenome exhibited superior mapping accuracy to the Sscrofa11.1, reducing false-positive mappings by 1.4% and erroneous mappings by 0.8%. Furthermore, the pangenome yielded more accurate genotypes of SNP (F1: 0.9660 vs. 0.9607) and INDEL (F1: 0.9226 vs. 0.9222) compared to Sscrofa11.1. In real sequencing data, the inconsistent SNPs called from the pangenome exhibited lower genome heterozygosity compared to those identified by the Sscrofa11.1, including observed heterozygosity and nucleotide diversity. The same reduction of heterozygosity overestimation was also found in the chicken pangenome.

Conclusions: This study quantifies the mapping bias of Sscrofa11.1 in Chinese indigenous pigs, demonstrating that mapping bias can lead to an overestimation of heterozygosity in Chinese indigenous pig breeds. The adoption of a pig pangenome mitigates this bias and provides a more accurate representation of genetic diversity in these populations.

Keywords: Genome graph; Mapping bias; Pangenome; Pig; Variant calling.


Conflict of interest statement

Declarations. Ethics approval and consent to participate: Not applicable. Consent for publication: Not applicable. Competing interests: The authors declare no competing interests.

Figures

Fig. 1
Fig. 1
The mapping and genotyping performance of different genomes. A The ratio of mapped reads in the graph space (x-axis) and in the linear space (y-axis). B The accuracy of all mappings, high-quality mappings (mapping quality > 30), and mappings in repeat regions. C The ration of different mapping bias. The mapping bias was classified into three types: false-positive mappings, false-negative mappings, and erroneous mappings. D Genotyping accuracy of SNPs (left panel) and short INDELs (right panel)
Fig. 2
Fig. 2
The comparison of real SNPs called from pangenome and Sscrofa11.1. A The ratio of mapped reads (left panel) and mate reads that mapped to different chromosomes (right panel). B The number of SNPs under different genotyping differences. C The Manhattan plot showing the distribution of sliding windows under different genotyping differences. The colors of the points are used to distinguish different chromosomes. D Distribution of observed heterozygosity for the 10,000 SNPs with the largest differences in observed heterozygosity between the pangenome and Sscrofa11.1. E Distribution of nucleotide diversity for the 10,000 SNPs with the largest differences in nucleotide diversity between the pangenome and Sscrofa11.1. F The distribution of ROHs identified by pangenome and Sscrofa11.1. The blue squares represent the pangenome, while red circles represent Sscrofa11.1
Fig. 3
Fig. 3
The comparison of real SNPs called from chicken pangenome and GRCg7b. A The number of SNPs with different observed heterozygosity between the pangenome and GRCg7b under different thresholds. B Distribution of observed heterozygosity for the 10,000 SNPs with the largest differences in observed heterozygosity between the pangenome and GRCg7b. C The number of SNPs with different nucleotide diversity between the pangenome and GRCg7b under different thresholds. D Distribution of nucleotide diversity for the 10,000 SNPs with the largest differences in observed heterozygosity between the pangenome and GRCg7b
Fig. 4
Fig. 4
The comparison of peaks called from Sscrofa11.1 and pangenome. AC Volcano plots showing the significantly different peaks identified by pangenome and Sscrofa11.1. DF The number significantly different peaks in each chromosome. The character “U” represents unplaced contigs

Similar articles

References

    1. Nurk S, Koren S, Rhie A, Rautiainen M, Bzikadze AV, Mikheenko A, et al. The complete sequence of a human genome. Science. 2022;376:44–53. - PMC - PubMed
    1. Wang T, Antonacci-Fulton L, Howe K, Lawson HA, Lucas JK, Phillippy AM, et al. The Human Pangenome Project: a global resource to map genomic diversity. Nature. 2022;604:437–46. - PMC - PubMed
    1. Chen N-C, Solomon B, Mun T, Iyer S, Langmead B. Reference flow: reducing reference bias using multiple population genomes. Genome Biol. 2021;22:8. - PMC - PubMed
    1. Lin M-J, Iyer S, Chen N-C, Langmead B. Measuring, visualizing, and diagnosing reference bias with biastools. Genome Biol. 2024;25:101. - PMC - PubMed
    1. Paten B, Novak AM, Eizenga JM, Garrison E. Genome graphs and the evolution of genome inference. Genome Res. 2017;27:665–76. - PMC - PubMed

LinkOut - more resources