. 2025 Mar 27;17(1):68.
doi: 10.1186/s13195-025-01719-5.

Diagnostic performance of plasma p-tau217 in a memory clinic cohort using the Lumipulse automated platform

Affiliations

Diagnostic performance of plasma p-tau217 in a memory clinic cohort using the Lumipulse automated platform

Francisco Martínez-Dubarbie et al. Alzheimers Res Ther. .

Abstract

Background: Plasma biomarkers for Alzheimer's disease (AD) are a promising tool for accessible and accurate biological diagnostics. However, data in clinical practice are needed to better understand their diagnostic and prognostic ability in memory unit patients.

Methods: We analyzed plasma phosphorylated tau at threonine 217 (p-tau217) and neuroflament light chain (NfL) levels and AD cerebrospinal fluid (CSF) biomarkers in a group of 493 subjects using the Lumipulse G600II platform. The sample includes 340 patients from our memory unit (142 dementia, 186 mild cognitive impairment, and 12 with subjective complaints) and 153 cognitively unimpaired volunteers. We have correlated plasma and CSF biomarkers; we have analyzed plasma biomarker levels as a function of clinical diagnosis, cognitive status and amyloid status. We have also studied the ability of p-tau217 to discriminate between amyloid-positive and -negative subjects according to CSF using receiver operating characteristic curves.

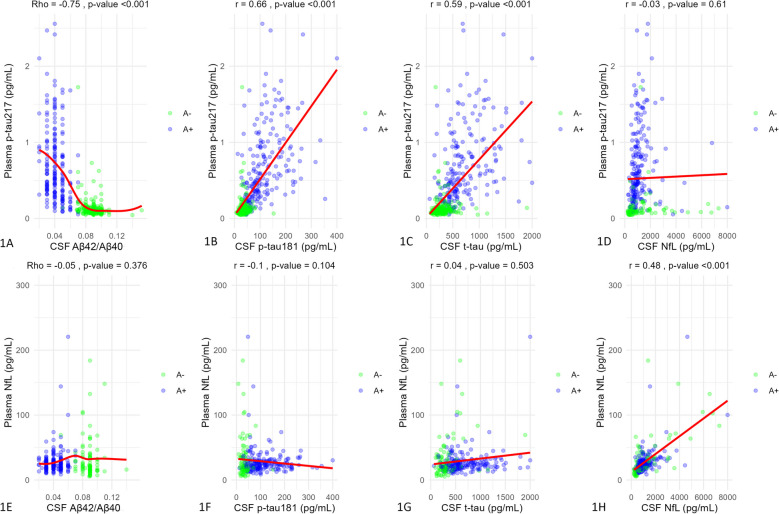
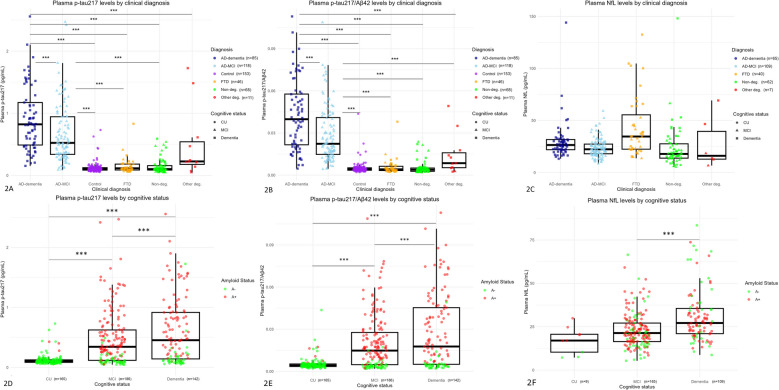
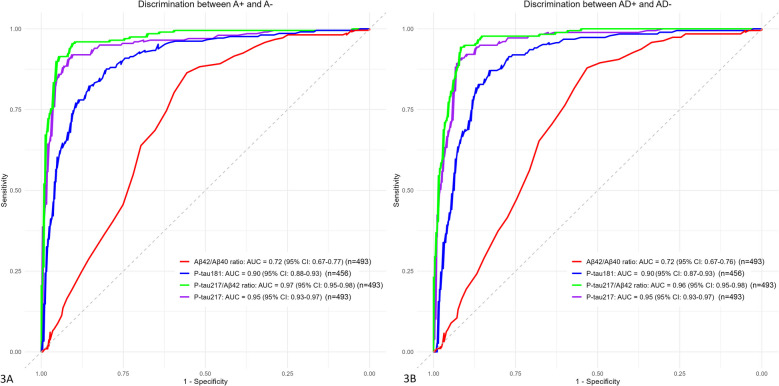
Results: Plasma p-tau217 correlated significantly with CSF Aβ42/Aβ40 (Rho = -0.75; p-value < 0.001), p-tau181 (r = 0.66; p-value < 0.001), and t-tau (r = 0.59; p-value < 0.001). Plasma NfL correlated with CSF NfL (r = 0.48; p-value < 0.001). By clinical diagnosis, plasma p-tau217 levels showed to be higher in AD patients than in healthy controls (difference = 0.63 pg/ml; p-value < 0.001), FTD (difference = 0.60 pg/ml; p-value < 0.001), and nondegenerative dementias (difference = 0.61 pg/ml; p-value < 0.001). Plasma p-tau217 showed an area under the curve of 0.95 to discriminate between A + and A- subjects (95%CI 0.93-0.97).

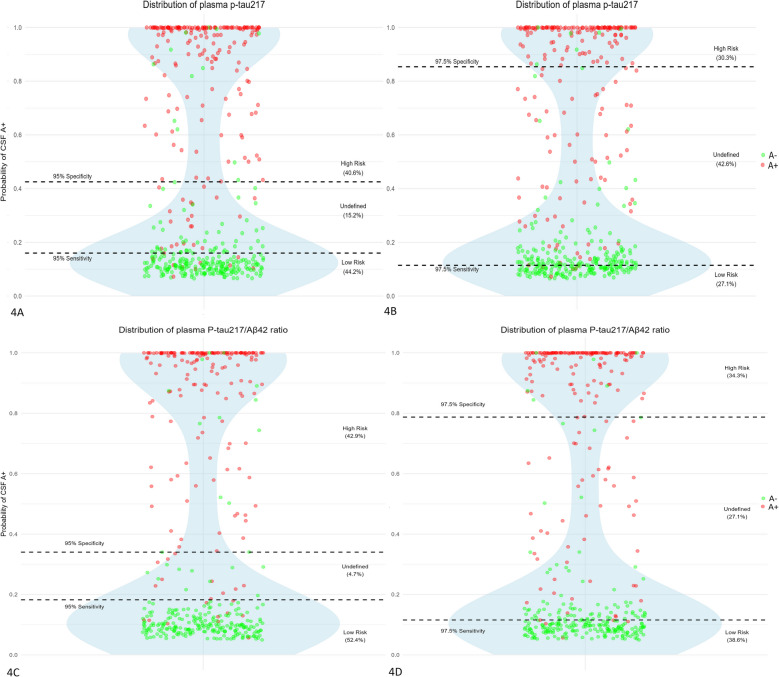
Conclusion: Plasma p-tau217 shows excellent results for detecting amyloid pathology at brain level in a clinical setting with an AUC of 0.95. It is a highly specific marker of AD and increases progressively along the disease continuum. Using plasma p-tau217 as an initial diagnostic tool with cut-offs at sensitivities and specificities of 95 or 97.5% could save between 57.4-84.8% of LP/PETs with diagnostic accuracies of 95-97%. Plasma NfL increases progressively at different cognitive stages.

Keywords: Alzheimer’s disease; Biomarkers; Cross-sectional; Early diagnosis; Healthy controls; Plasma p-tau217.


Conflict of interest statement

Declarations. Ethics approval and consent to participate: This research has been conducted in accordance with the Declaration of Helsinki and has been approved by the ethics committee of the Hospital Universitario Marqués de Valdecilla. Title: Valdecilla Cohort for the study of memory and brain aging. Internal code: 2018.111. All subjects have given their signed consent to participate. Consent for publication: Not applicable. Competing interests: The authors declare no competing interests.

Figures

Fig. 1
Fig. 1
Correlations between both plasma p-tau217 and NfL and CSF biomarkers. The plots show correlations between plasma p-tau217 (A-D) and NfL (E-H) and CSF biomarkers. CSF amyloid ratio correlations were measured by Spearman's Rho and the rest by Pearson's correlation coefficient. X-axes corresponds to CSF values (all except amyloid ratio expressed in pg/mL) and Y-axes to plasma values (expressed in pg/ml). Dots represent a pair of values of both variables for each observation. The green ones are those corresponding to amyloid-negative subjects and the blue ones represent amyloid-positive subjects. Red lines are regression lines. Above each plot are the correlation values and their statistical significance. Abbreviations: CSF, cerebrospinal fluid. P-tau, phosphorylated tau. T-tau, total tau. NfL, neurofilament light chain. R, Pearson’s correlation coefficient. p-value, statistical significance. A, amyloid status
Fig. 2
Fig. 2
Plasma p-tau217, p-tau217/Aβ42, and NfL values by clinical diagnosis and cognitive status. Figures show box and whiskers plots of plasma biomarkers by groups. In Figures A, B, and C, X axis represents the different clinical diagnostic groups (AD-MCI, AD-dementia, FTD, other degenerative pathology, non-degenerative pathology, and controls). In Figures CD, and E, X axis represents different cognitive status (cognitively unimpaired, MCI and dementia). Y axis corresponds to plasma concentrations expressed in pg/ml. Boxes show the interquartile range (the upper boundary is the Q3, and the lower boundary is the Q1). The line inside the box corresponds to the median of the sample and the whiskers represent the maximum (upper) and minimum (lower) values. In first row individual values are shown in different colors and shapes according to clinical diagnosis and cognitive status. Dots represent CU subjects, triangles are MCI patients, and squares show patients with dementia. Dark blue color corresponds to patients with AD-dementia, light blue to AD-MCI patients, purple to controls, green to non-degenerative pathology, and red to other degenerative pathology. In second row, green dots correspond to amyloid-negative subjects and red ones to amyloid-positive subjects. Significant differences are represented with three asterisks between boxes. Healthy volunteers are not included in NfL analysis because plasma NfL was not available for this group. Abbreviations: AD, Alzheimer's Disease. FTD, frontotemporal dementia. P-tau, phosphorylated tau. NfL, neurofilament light chain. CU, cognitively unimpaired. MCI, mild cognitive impairment. A, amyloid group. n, number of participants
Fig. 3
Fig. 3
Ability of single plasma biomarkers to detect CSF amyloid pathology. ROC curves showing the ability of single plasma biomarkers to detect CSF pathology. A corresponds to amyloid pathology and B to A,D pathology (A+ plus T+). X axis shows 1-specificity, and Y axis corresponds to sensitivity. Red curve corresponds to Aβ42/Aβ40 ratio; the blue one corresponds to p-tau181; green one to p-tau217/Aβ42 ratio; and purple one to p-tau217. Abbreviations: ROC, receiver operating characteristic. A, amyloid. AUC, area under the curve. P-tau, phosphorylated tau. CI, confidence interval. n, number of participants
Fig. 4
Fig. 4
Two-cutoff approach in our sample. The results are shown in violin plots. Y axis represents the probability of being considered amyloid positive according to a logistic regression model in which amyloid status was taken as the response and plasma p-tau217 (Figures A and B) or plasma p-tau217/Aβ42 ratio (Figures C and D) values as predictive variable. Blue shaded area represents the concentration of observations at each probability. Dots are the individual values of plasma p-tau217 and p-tau217/Aβ42 ratio. Those subjects considered as amyloid-positive according to CSF are red dots and the amyloid-negative are the green ones. Black dashed lines represent the cut-off of the different specificities and sensitivities (95% in Figures A and C, 97.5% in Figure B and D). Values above the specificity line are considered "high risk", those below the sensitivity line are "low risk" and values between the lines are subjects classified as undefined. Abbreviations: p-tau, phosphorylated tau. Aβ, amyloid beta. CSF, cerebrospinal fluid. A, amyloid status

References

    1. Jack CR, Bennett DA, Blennow K, et al. NIA-AA research framework: toward a biological definition of Alzheimer’s disease. Alzheimers Dement. 2018;14(4):535–62. 10.1016/j.jalz.2018.02.018. - PMC - PubMed
    1. Sims JR, Zimmer JA, Evans CD, et al. Donanemab in early symptomatic Alzheimer disease: the TRAILBLAZER-ALZ 2 randomized clinical trial. JAMA. 2023;330(6):512–27. 10.1001/jama.2023.13239. - PMC - PubMed
    1. van Dyck CH, Swanson CJ, Aisen P, et al. Lecanemab in early Alzheimer’s disease. N Engl J Med. 2023;388(1):9–21. 10.1056/NEJMoa2212948. - PubMed
    1. US Food and Drug Administration. Drugs@ FDA: FDA... - Google Académico. https://scholar.google.com/scholar_lookup?journal=Drugs@FDA:+FDA-Approve.... Accessed 28 Aug 2024.
    1. Pais MV, Forlenza OV, Diniz BS. Plasma biomarkers of Alzheimer’s disease: a review of available assays, recent developments, and implications for clinical practice. J Alzheimers Dis Rep. 2023;7(1):355–80. 10.3233/ADR-230029. Published 2023 May 3. - PMC - PubMed

MeSH terms

LinkOut - more resources