. 2025 Mar 26;58(1):18.
doi: 10.1186/s40659-025-00589-3.

Functional characterization of two KCND3 variants associated with SCA 19/22 ataxia in Latin American families

Affiliations

Functional characterization of two KCND3 variants associated with SCA 19/22 ataxia in Latin American families

Felipe Arancibia et al. Biol Res. .

Abstract

Background: Spinocerebellar ataxia 19/22 (SCA19/22) represents a rare autosomal dominant genetic disorder resulting in progressive ataxia and cerebellar atrophy. SCA19/22 is caused by variants in the KCND3 gene, which encodes a voltage-gated potassium channel subunit essential for cerebellar Purkinje cell function. To date, 22 variants have been reported worldwide, with incomplete functional studies.

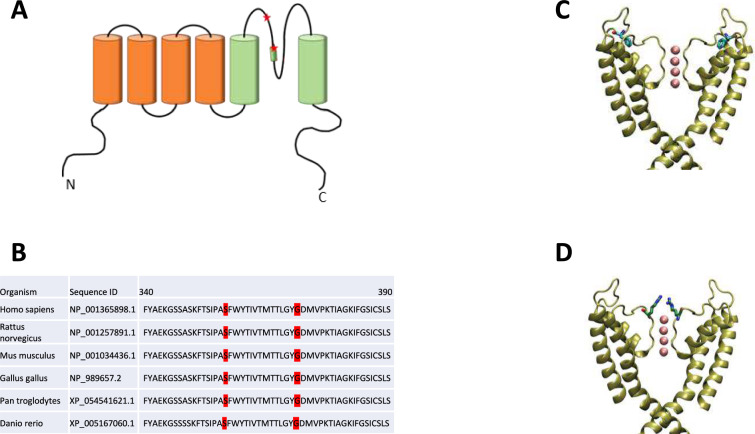
Results: We present four Chilean and Mexican cases in whom two single-nucleotide variants were identified through whole-exome sequencing of the probands. One variant (G371R) was initially cataloged as pathogenic and the other (S357W) as likely pathogenic according to the American College of Medical Genetics and Genomics criteria. The pathogenicity of the G371R variation was confirmed by in-silico mutagenesis. Our molecular models, that include electrostatic potential analysis and algorithms to analyze the pore dimensions (HOLE), indicated that the longer side chain of the arginine narrowed the channel's selectivity filter, while the positive charge modified its surface electrostatic potential, presumably preventing potassium flux. Functional characterization of the S357W variant was performed in AD293 cells. When overexpressed, KV4.3S357W channels alone showed no current. Protein electrophoresis revealed that the total number of KV4.3 channels expressed did not differ between the wild-type and mutated phenotypes, suggesting a protein trafficking malfunction. Co-expression of the KChIP2 auxiliary subunit partially rescued the potassium currents when the variant was expressed, albeit with very different biophysical characteristics, including faster inactivation vs. wild-type channels.

Conclusions: This functional characterization of two KCND3 variants associated with SCA19/22 adds new evidence for the pathogenic role of Kv4.3 loss-of-function mutations and establishes a correlation between functional dominance and clinical severity in SCA19/22.

Keywords: KCND3; Congenital ataxia; Functional characterization; Kv4.3; Spinocerebellar ataxia SCA19/22.


Conflict of interest statement

Declarations. Ethics approval and consent to participate: This study was performed in line with the principles of the Declaration of Helsinki. All participants provided informed consent for the genetic study and the publication of their clinical information. Approval was granted by the Investigation in Human Beings Ethics Committee of Facultad de Medicina-Universidad de Chile and carried out in compliance with the current legislation in Chile on Scientific Research in humans of laws 20120, and 19,628. Consent for publication: All authors approved the final version of the manuscript. Competing interests: The authors declare that they have no competing interests.

Figures

Fig. 1
Fig. 1
Protein structure modeling of human p.S357W and p.G371R variants: (A) Schematic diagram of the membrane topology of a Kv4.3 subunit containing six transmembrane segments (S1–S6). The localizations of the two variants studied in this work are highlighted. B Amino acid sequence alignment of various Kv4.3-relvent homologs and orthologs showing that the residues studied in this work are highly conserved. C and D Structural models of Kv4.3 variants based on the Kv4.3 structure available in the RCSB Protein Data Bank (PDB: 7W3Y). For clarity, the N-terminal of Kv4.3 channel was removed up to residue 318, and chains B and D are not shown. S357W (C) and G371R variants (D) shown in licorice
Fig. 2
Fig. 2
Representation of the electrostatic potential surface and in silico predictions of the changes associated with the G371R variant: (A) Electrostatic potential surface of the Kv4.3 (left) channel, the Kv4.3G371R homotetramer (middle), and the Kv4.3 heterotetramer with only one G371R subunit, viewed from the extracellular side. The color scale of the electrostatic potential surface is in units of kT/e at T = 37 °C. Electropositively and electronegatively charged areas are in blue and red, respectively. Neutral residues are white. B Pore size comparison for wild-type Kv4.3 (left) vs. Kv4.3G371R homotetramer (right) channels, extracellular view. Intracellular residues from 40 to 180 removed for clarity. C The pore radii of the wild-type Kv4.3 (green) and Kv4.3G371R homotetramer (blue) channels were calculated using HOLE. The solvent-accessible pathway along the pore was mapped using the same program. The middle and right images show the wild-type Kv4.3 and Kv4.3G371R homotetramer channels, respectively. The amino acids at the 371 position are displayed as sticks. For clarity, only two diagonally-opposed subunits are shown in each case
Fig. 3
Fig. 3
Functional characterization of the S357S variant: Representative K + current traces recorded from cells transfected with the wild-type Kv4.3 (A) or Kv4.3S357S channel variant (B). Currents were elicited by voltage steps from − 80 to + 80 mV from a holding potential of − 80 mV. Voltage steps lasted 1 s and were applied in 10 mV increments with an interpulse interval of 5 s. C Summary peak current I/V plots (mean ± SEM) obtained from currents family as shown in (A) and (B). The black symbols in the plot represent wild-type Kv4.3 currents while the white symbol stands for the Kv4.3S357W channel variant. The best fit to a Boltzmann equation (see Methods) is represented by a solid line. D Summary bar graph showing the normalized peak current amplitudes at + 40 mV (n = 6). E Representative immunoblots showing total protein expression of the wild-type Kv4.3 and Kv4.3S357W variant. Cell lysates were subject to immunoblotting analyses with the indicated antibodies. F Summary bar graph showing protein density standardized as the ratio of each variant to the corresponding total α-tubulin signal, followed by normalization with respect to the wild-type Kv4.3 as a control (n = 4). *p < 0.01 vs. Kv4.3WT
Fig. 4
Fig. 4
KChIP-2 partially restores the potassium currents of the S357S variant: (A) Representative K+ current traces recorded from cells transfected with the wild-type Kv4.3 (upper) or Kv4.3S357S (lower) channel and the auxiliary subunit KChIP-2. Currents were elicited by voltage steps from − 80 to + 80 mV from a holding potential of − 80 mV. Voltage steps lasted 1 s and were applied in 10 mV increments with an interpulse interval of 5 s. B The upper portion of the figure displays a representative immunoblot showing total protein expression of the wild-type Kv4.3 and Kv4.3S357W variant with and without KChIP-2. Cell lysates were subjected to immunoblotting analyses with the indicated antibodies. The summary bar graph shows protein density standardized as the ratio of each variant to the corresponding total α-tubulin signal, followed by normalization with respect to the wild-type Kv4.3 as a control (n = 4). C Left: Normalized G–V plots (mean ± SEM) measured at the peak current from currents family as shown in (A). The best fit to a Boltzmann equation (see Methods) is represented by a solid line. Middle: Summary bar graph (n = 6) showing half-activation voltages of normalized conductance, derived from fits of the Boltzmann function to data. Right: Summary bar graph (mean ± SEM) showing the Boltzmann slope factor (n = 6). D Summary peak current I/V plots obtained from currents family as shown in (A). The black symbols in the plot represent wild-type Kv4.3 currents while the white symbol stands for the Kv4.3S357W channel variant. The best fit to a Boltzmann equation (see Methods) is represented by a solid line. Lower: Summary bar graph showing the normalized peak current amplitudes at + 40 mV (n = 6). E Voltage-dependent activation kinetics (mean ± SEM) of wild-type Kv4.3 currents (black symbols) and the Kv4.3S357W channel variant (white symbols) expressed as time to peak (TTP). Lower: Summary bar graph (mean ± SEM) showing the TTP at + 40 mV (n = 6). F Deactivation time constant for the inactivating current, derived from the best fit to an exponential decay function. The black symbols in the plot represent wild-type Kv4.3 currents, while the white symbol stands for the Kv4.3S357W channel variant. Lower: Summary bar graph showing the decay time at + 40 mV (n = 6). *p < 0.01 with respect to Kv4.3WT plus KChIP-2
Fig. 5
Fig. 5
The S357W variant exerts a dominant effect on the functional expression of Kv4.3 channels: (A) Representative K+ current traces recorded from cells transfected with the wild-type Kv4.3 (left) or wild-type Kv4.3 and Kv4.3S357W channel at 1:1 proportions (right). Currents were elicited by voltage steps from − 80 to + 80 mV from a holding potential of − 80 mV. Voltage steps lasted 1 s and were applied in 10 mV increments with an interpulse interval of 5 s. B Left: Normalized G–V plots (mean ± SEM) measured at the peak current from currents family as shown in (A). The best fit to a Boltzmann equation (see Methods) is represented by a solid line. Middle: Summary bar graph (n = 6) showing half-activation voltages of normalized conductance, derived from fits of the Boltzmann function to data. Right: Summary bar graph (mean ± SEM) showing the Boltzmann slope factor (n = 6). C Summary peak current I/V plots obtained from currents family as shown in (A). The black symbols in the plot represent wild-type Kv4.3 currents, while the white symbol stands for the Kv4.3WT:Kv4.3S357W channels. The best fit to a Boltzmann equation (see Methods) is represented by a solid line. Lower: Summary bar graph showing the normalized peak current amplitudes at + 40 mV (n = 6). D Voltage-dependent activation kinetics (mean ± SEM) of wild-type Kv4.3 currents (black symbols) and Kv4.3WT:Kv4.3S357W channels (white symbols) expressed as time to peak (TTP). Lower: Summary bar graph (mean ± SEM) showing the TTP at + 40 mV (n = 6). E Deactivation time constant for the inactivating current, derived from the best fit to an exponential decay function. The black symbols in the plot represent wild-type Kv4.3 currents, while the white symbol stands for Kv4.3WT:Kv4.3S357W channels. Lower: Summary bar graph showing the decay time at + 40 mV (n = 6). *p < 0.01 with respect to Kv4.3WT

References

    1. Duarri A, Lin MC, Fokkens MR, Meijer M, Smeets CJ, Nibbeling EA, et al. Spinocerebellar ataxia type 19/22 mutations alter heterocomplex Kv4.3 channel function and gating in a dominant manner. Cell Mol Life Sci. 2015;72(17):3387–99. - PMC - PubMed
    1. Hsiao CT, Fu SJ, Liu YT, Lu YH, Zhong CY, Tang CY, et al. Novel SCA19/22-associated KCND3 mutations disrupt human K(V) 4.3 protein biosynthesis and channel gating. Hum Mutat. 2019;40(11):2088–107. - PubMed
    1. Avila-Jaque D, Martin F, Bustamante ML, Luna Alvarez M, Fernandez JM, Ortiz D, de Montellano DJ, et al. The phenotypic spectrum of spinocerebellar ataxia type 19 in a series of Latin American patients. Cerebellum. 2024;23(4):1727–32. - PubMed
    1. Klockgether T, Mariotti C, Paulson HL. Spinocerebellar ataxia. Nat Rev Dis Primers. 2019;5(1):24. - PubMed
    1. Li M, Liu F, Hao X, Fan Y, Li J, Hu Z, et al. Rare KCND3 loss-of-function mutation associated with the SCA19/22. Front Mol Neurosci. 2022;15: 919199. - PMC - PubMed

Substances

LinkOut - more resources