. 2025 Mar 16;26(6):2675.
doi: 10.3390/ijms26062675.

Exploiting Paradoxical Activation of Oncogenic MAPK Signaling by Targeting Mitochondria to Sensitize NRAS Mutant-Melanoma to Vemurafenib

Affiliations

Exploiting Paradoxical Activation of Oncogenic MAPK Signaling by Targeting Mitochondria to Sensitize NRAS Mutant-Melanoma to Vemurafenib

Laura Francisca Leite do Prado-Souza et al. Int J Mol Sci. .

Abstract

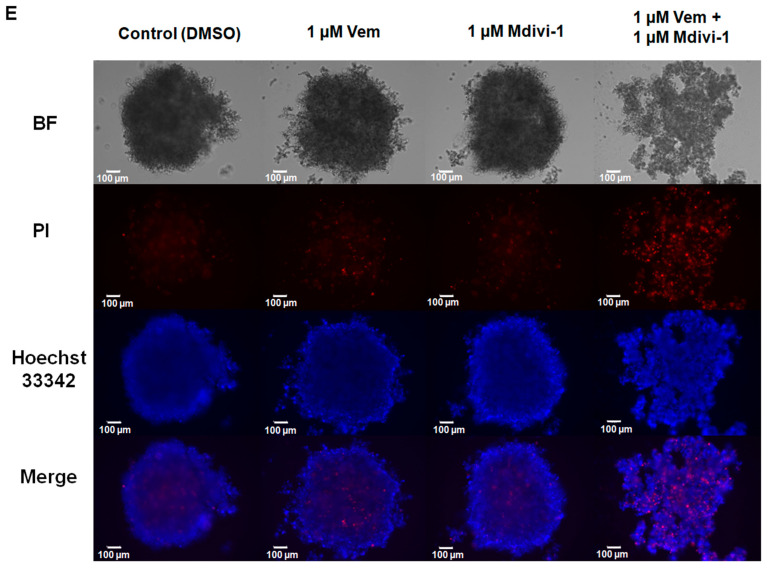
Vemurafenib is a BRAF (rapidly accelerated fibrosarcoma B-type)-targeted therapy used to treat patients with advanced, unresectable melanoma. It inhibits the MAPK (mitogen-activated protein kinase)/ERK (extracellular signal-regulated kinase) pathway and tumor proliferation in BRAFV600E-mutated melanoma cells. Resistance to vemurafenib has been reported in melanoma patients due to secondary NRAS (neuroblastoma RAS viral oncogene homolog) mutations, which lead to paradoxical MAPK pathway activation and tumor proliferation. However, the impact of this paradoxical activation on mitochondrial dynamics and function in NRAS-mutated melanoma is unclear. Here, we investigated the effects of vemurafenib on NRASQ61R-mutated melanoma cells, focusing on mitochondrial dynamics and function. As expected, vemurafenib did not exhibit cytotoxicity in SK-MEL-147 NRASQ61R-mutated melanoma cells, even after 72 h of incubation. However, it significantly enhanced the MAPK/ERK signaling through paradoxical activation, accompanied by decreased expression of mitochondrial fusion proteins and activation of the fission protein DRP1 (dynamin-related protein 1), leading to small, rounded mitochondrial morphology. These observations were corroborated by transcriptome data obtained from NRAS-mutated melanoma patients, showing MFN1 (mitofusin 1) and OPA1 (optic atrophy 1) downregulation and DNM1L (DRP1 gene) upregulation. Interestingly, inhibition of mitochondrial fission with mdivi-1 or modulation of oxidative phosphorylation via respiratory chain inhibition or uncoupling significantly sensitized NRASQ61R-mutated melanoma cells to vemurafenib. Despite vemurafenib's low cytotoxicity in NRAS-mutated melanoma, targeting mitochondrial dynamics and/or oxidative phosphorylation may offer a promising strategy for combined therapy.

Keywords: NRAS; cancer; mdivi-1; mitochondrial dynamics; oxidative phosphorylation; targeted therapy.


Conflict of interest statement

The authors declare no conflicts of interest.

Figures

Figure 1
Figure 1
Melanoma cells presenting NRAS mutation are not sensitive to the cytotoxicity of vemurafenib and display increased proliferation rate associated with the paradoxical activation of the MAPK/ERK pathway. (A) SK-MEL-147 cell was treated with vemurafenib (0.1, 1 or 10 µM) or DMSO (control) for 24, 48, and 72 h, and cytotoxicity was estimated by the MTT reduction assay. The dotted red line represents the control, considered as 100%. The results are presented as mean ± SEM (standard error of mean) of three independent experiments performed in triplicate. (B) Scatter plot comparing the cytotoxic effect of 1 µM vemurafenib incubated for 72 h with SK-MEL-147 (NRAS mutant) or SK-MEL-19 (BRAF mutant) assessed by MTT. The results are presented as the mean ± SEM of three independent experiments performed in triplicate. Statistical significance of the data was performed using the unpaired t-test variance, considering ** p < 0.01. Flow cytometry analysis of SK-MEL-147 cells labeled with annexin-V FITC and propidium iodide (PI). (C) Representative dot plot of annexin-V FITC versus propidium iodide (PI) fluorescence intensity after cell treatment with 1 µM vemurafenib at 24, 48 and 72 h. (D) Quantification of annexin-V FITC and/or propidium iodide positive cells, presented as mean ± SEM of two independent experiments. (E) Growth curve of SK-MEL-147 after cell treatment with 1 µM vemurafenib (red bars) at 24, 48 and 72 h. The results are presented as the mean ± SEM of two independent experiments performed in triplicate. Statistical significance of the data was performed using the unpaired t-test variance, considering * p < 0.1 and ** p < 0.01. SK-MEL-147 total protein lysates were obtained after incubation with 1 µM vemurafenib or DMSO (control) for 24 h. (F) Representative Western blotting bands showing the expression of BRAF, pBRAF, MEK, pMEK, ERK, pERK, and COX IV or β-actin (internal control). Aliquots of 50 and 100 μg of protein were used in each well for total proteins and their phosphorylated forms, respectively. (G) The quantification of bands was performed by densitometry, followed by normalization using β-actin. The phosphorylated forms were also normalized by their respective total pair (ratio phosphorylated/total) and the mean of control (without vemurafenib) was normalized to 1. The results are presented as mean ± SEM of three independent experiments. Statistical significance of data was performed using the unpaired t test variance, considering ns = not significant, ** p < 0.01, *** p < 0.001, and **** p < 0.0001. (H) Representative illustration of the MAPK pathway in melanoma cells with the NRASQ61R mutation. On the left, basal signaling, and on the right, paradoxical activation, caused by vemurafenib action.
Figure 1
Figure 1
Melanoma cells presenting NRAS mutation are not sensitive to the cytotoxicity of vemurafenib and display increased proliferation rate associated with the paradoxical activation of the MAPK/ERK pathway. (A) SK-MEL-147 cell was treated with vemurafenib (0.1, 1 or 10 µM) or DMSO (control) for 24, 48, and 72 h, and cytotoxicity was estimated by the MTT reduction assay. The dotted red line represents the control, considered as 100%. The results are presented as mean ± SEM (standard error of mean) of three independent experiments performed in triplicate. (B) Scatter plot comparing the cytotoxic effect of 1 µM vemurafenib incubated for 72 h with SK-MEL-147 (NRAS mutant) or SK-MEL-19 (BRAF mutant) assessed by MTT. The results are presented as the mean ± SEM of three independent experiments performed in triplicate. Statistical significance of the data was performed using the unpaired t-test variance, considering ** p < 0.01. Flow cytometry analysis of SK-MEL-147 cells labeled with annexin-V FITC and propidium iodide (PI). (C) Representative dot plot of annexin-V FITC versus propidium iodide (PI) fluorescence intensity after cell treatment with 1 µM vemurafenib at 24, 48 and 72 h. (D) Quantification of annexin-V FITC and/or propidium iodide positive cells, presented as mean ± SEM of two independent experiments. (E) Growth curve of SK-MEL-147 after cell treatment with 1 µM vemurafenib (red bars) at 24, 48 and 72 h. The results are presented as the mean ± SEM of two independent experiments performed in triplicate. Statistical significance of the data was performed using the unpaired t-test variance, considering * p < 0.1 and ** p < 0.01. SK-MEL-147 total protein lysates were obtained after incubation with 1 µM vemurafenib or DMSO (control) for 24 h. (F) Representative Western blotting bands showing the expression of BRAF, pBRAF, MEK, pMEK, ERK, pERK, and COX IV or β-actin (internal control). Aliquots of 50 and 100 μg of protein were used in each well for total proteins and their phosphorylated forms, respectively. (G) The quantification of bands was performed by densitometry, followed by normalization using β-actin. The phosphorylated forms were also normalized by their respective total pair (ratio phosphorylated/total) and the mean of control (without vemurafenib) was normalized to 1. The results are presented as mean ± SEM of three independent experiments. Statistical significance of data was performed using the unpaired t test variance, considering ns = not significant, ** p < 0.01, *** p < 0.001, and **** p < 0.0001. (H) Representative illustration of the MAPK pathway in melanoma cells with the NRASQ61R mutation. On the left, basal signaling, and on the right, paradoxical activation, caused by vemurafenib action.
Figure 2
Figure 2
Vemurafenib does not induce hyperfused mitochondrial morphology in NRASQ61R mutant melanoma cells. (A) Representative photomicrograph of mitochondrial morphology in SK-MEL-147 cells obtained by transmission electron microscopy after cell incubation with 1 µM vemurafenib or with DMSO (control) for 24 h. The scale bars represent 2 µm (upper panels), 1 µm (middle panels), and 500 nm (lower panels). (B) Cell lysates were obtained after incubation of SK-MEL-147 cells with 1 µM vemurafenib or DMSO (control) for 24 and 48 h. The panels show the Western blotting bands of DRP1, MFN1, MFN2, L-OPA1, S-OPA1, and β-actin (load control). Aliquots of 50 µg of protein were used in each lane for total proteins and their phosphorylated forms, respectively. (C) Quantification of bands was performed by densitometry, followed by normalization with the corresponding β-actin. The results obtained are presented as the mean ± SEM of three independent experiments. The mean of the controls was normalized to 1 and that of the treated was calculated according to the control. Statistical significance of data was performed using the unpaired t test variance, considering ns = not significant, ** p < 0.01, and **** p < 0.0001.
Figure 2
Figure 2
Vemurafenib does not induce hyperfused mitochondrial morphology in NRASQ61R mutant melanoma cells. (A) Representative photomicrograph of mitochondrial morphology in SK-MEL-147 cells obtained by transmission electron microscopy after cell incubation with 1 µM vemurafenib or with DMSO (control) for 24 h. The scale bars represent 2 µm (upper panels), 1 µm (middle panels), and 500 nm (lower panels). (B) Cell lysates were obtained after incubation of SK-MEL-147 cells with 1 µM vemurafenib or DMSO (control) for 24 and 48 h. The panels show the Western blotting bands of DRP1, MFN1, MFN2, L-OPA1, S-OPA1, and β-actin (load control). Aliquots of 50 µg of protein were used in each lane for total proteins and their phosphorylated forms, respectively. (C) Quantification of bands was performed by densitometry, followed by normalization with the corresponding β-actin. The results obtained are presented as the mean ± SEM of three independent experiments. The mean of the controls was normalized to 1 and that of the treated was calculated according to the control. Statistical significance of data was performed using the unpaired t test variance, considering ns = not significant, ** p < 0.01, and **** p < 0.0001.
Figure 3
Figure 3
Mdivi-1 sensitizes NRASQ61R melanoma cells to vemurafenib. SK-MEL-147 cells were pre-incubated with 1 µM mdivi-1 for 1 h and then incubated with 1 μM vemurafenib or with DMSO (control) for 24, 48, and 72 h. (A) Representative scheme illustrating the mechanism of action of mdivi-1, targeting the DRP1 protein, preventing its phosphorylation at serine 616. (B) Evaluation of the effect of mdivi-1 (1; 10; 25, and 50 µM) on cell viability after 24 h of incubation. Dotted red line represents the control, considered as 100%. The results are presented as mean ± SEM of three independent experiments. (C) Cells (188,000 per well) were incubated with vemurafenib (red bar), mdivi-1 (blue bar) or vemurafenib + mdivi-1 (black bar) combination (at 1 µM each one) for 24, 48 or 72 h, followed by counting in a Neubauer chamber using the trypan blue 0.016% (w/v). Data are presented as mean ± SEM of two independent experiments. Statistical significance of data was performed using ANOVA (one-way analysis of variance) and Tukey’s post-test, * p < 0.05. (D) Evaluation of the cytotoxicity of vemurafenib (red bar), mdivi-1 (blue bar) or their combination (black bar) by MTT. Data are presented as mean ± SEM of three independent experiments. Statistical significance of data was performed using ANOVA and Tukey’s post-test, * p < 0.05, ** p < 0.01, *** p < 0.001 and **** p < 0.0001. (E) The spheroids (6000 cells and 72 h of formation) were treated with vemurafenib, mdivi-1 or vemurafenib + mdivi-1 combination (at 1 µM each one) for 24 h, then stained with 1.25 µM propidium iodide and 4.0 µM Hoechst 33342 for 30 min. The images were acquired using fluorescence microscopy at 100× magnification. The scale bars represent 100 µm.
Figure 3
Figure 3
Mdivi-1 sensitizes NRASQ61R melanoma cells to vemurafenib. SK-MEL-147 cells were pre-incubated with 1 µM mdivi-1 for 1 h and then incubated with 1 μM vemurafenib or with DMSO (control) for 24, 48, and 72 h. (A) Representative scheme illustrating the mechanism of action of mdivi-1, targeting the DRP1 protein, preventing its phosphorylation at serine 616. (B) Evaluation of the effect of mdivi-1 (1; 10; 25, and 50 µM) on cell viability after 24 h of incubation. Dotted red line represents the control, considered as 100%. The results are presented as mean ± SEM of three independent experiments. (C) Cells (188,000 per well) were incubated with vemurafenib (red bar), mdivi-1 (blue bar) or vemurafenib + mdivi-1 (black bar) combination (at 1 µM each one) for 24, 48 or 72 h, followed by counting in a Neubauer chamber using the trypan blue 0.016% (w/v). Data are presented as mean ± SEM of two independent experiments. Statistical significance of data was performed using ANOVA (one-way analysis of variance) and Tukey’s post-test, * p < 0.05. (D) Evaluation of the cytotoxicity of vemurafenib (red bar), mdivi-1 (blue bar) or their combination (black bar) by MTT. Data are presented as mean ± SEM of three independent experiments. Statistical significance of data was performed using ANOVA and Tukey’s post-test, * p < 0.05, ** p < 0.01, *** p < 0.001 and **** p < 0.0001. (E) The spheroids (6000 cells and 72 h of formation) were treated with vemurafenib, mdivi-1 or vemurafenib + mdivi-1 combination (at 1 µM each one) for 24 h, then stained with 1.25 µM propidium iodide and 4.0 µM Hoechst 33342 for 30 min. The images were acquired using fluorescence microscopy at 100× magnification. The scale bars represent 100 µm.
Figure 4
Figure 4
Mdivi-1 blocks the paradoxical activation of the MAPK/ERK cascade induced by vemurafenib in NRASQ61R melanoma cells. (A) Quantification of relative fluorescence intensity (R.F.I.) of pDRP1 (S616) incubation with vemurafenib (red bar) and mdivi-1 (blue bar) or both (black bar) (at 1 μM) or DMSO (control, gray bar) for 24 h. The data are presented as mean ± SEM of three independent experiments. Statistical significance of data was performed using ANOVA and Tukey’s post-test, * p < 0.05. (B) Oxygen consumption rate in the SK-MEL-147 cells. After the addition of cells indicated by the arrow, the basal consumption rate was established (pointed by the red dotted line), and the effects of sequential additions of mdivi-1 resulting in increasing concentrations (0.5; 1; 2; 10; 20; and 50 μM) was measured. (C) SK-MEL-147 total cell lysates were obtained after incubation with vemurafenib and/or mdivi-1 (at 1 μM) or DMSO (control) for 24 h. Representative immunoblotting pERK in melanoma cells with the NRASQ61R mutation. (D) Quantification of bands was performed by densitometry, followed by normalization with the corresponding β-actin, vemurafenib (red bar), and mdivi-1 (blue bar) or both (black bar) (at 1 μM) and DMSO (control—gray bar) for 24 h. The data are presented as mean ± SEM of two independent experiments. Statistical significance of data was performed using ANOVA and Tukey’s post-test, * p < 0.05.
Figure 5
Figure 5
Combined effect of vemurafenib and mitochondrial interferents on the viability in NRAS-mutated melanoma cells. The cells were pre-incubated with CCCP (orange bars) (A), antimycin A (AA—yellow bars), (B) or rotenone (green bars) (C), all at 25 nM concentration for 1 h. After that, 1 μM vemurafenib or DMSO (control) was added followed by incubation for 24, 48, and 72 h. Red bars are the effects of vemurafenib only and black bars, the combination of vemurafenib with each modulator. The percentage of viable cells was calculated in relation to the control (absence of drug), and the data are presented as mean ± SEM of three independent experiments. Statistical significance of data was performed using ANOVA and Tukey’s post-test, considering * p < 0.05, ** p < 0.01, *** p < 0.001, and **** p < 0.0001.
Figure 6
Figure 6
Differential expression analysis of (A) DNM1L (DRP1), (B) MFN1, and (C) OPA1. RNA sequencing from patient sample databases. The raw RNA sequencing data from normal samples (gray bars) and melanoma (orange bars) associated with NRAS-type mutations were obtained from a previous study [36].

Similar articles

References

    1. Chaiprasongsuk A., Panich U. Role of Phytochemicals in Skin Photoprotection via Regulation of Nrf2. Front. Pharmacol. 2022;13:823881. doi: 10.3389/fphar.2022.823881. - DOI - PMC - PubMed
    1. Siegel R.L., Giaquinto A.N., Jemal A. Cancer Statistics, 2024. CA. Cancer J. Clin. 2024;74:12–49. doi: 10.3322/caac.21820. - DOI - PubMed
    1. Bolick N.L., Geller A.C. Epidemiology of Melanoma. Hematol. Oncol. Clin. N. Am. 2021;35:57–72. doi: 10.1016/j.hoc.2020.08.011. - DOI - PubMed
    1. Ossio R., Roldán-Marín R., Martínez-Said H., Adams D.J., Robles-Espinoza C.D. Melanoma: A Global Perspective. Nat. Rev. Cancer. 2017;17:393–394. doi: 10.1038/nrc.2017.43. - DOI - PubMed
    1. Davies H., Bignell G.R., Cox C., Stephens P., Edkins S., Clegg S., Teague J., Woffendin H., Garnett M.J., Bottomley W., et al. Mutations of the BRAF Gene in Human Cancer. Nature. 2002;417:949–954. doi: 10.1038/nature00766. - DOI - PubMed

MeSH terms