. 2025 Mar 17;26(6):2681.
doi: 10.3390/ijms26062681.

Genome-Wide Identification and Expression Assessment for the Phosphate Transporter 2 Gene Family Within Sweet Potato Under Phosphorus Deficiency Stress

Affiliations

Genome-Wide Identification and Expression Assessment for the Phosphate Transporter 2 Gene Family Within Sweet Potato Under Phosphorus Deficiency Stress

Hongyang Li et al. Int J Mol Sci. .

Abstract

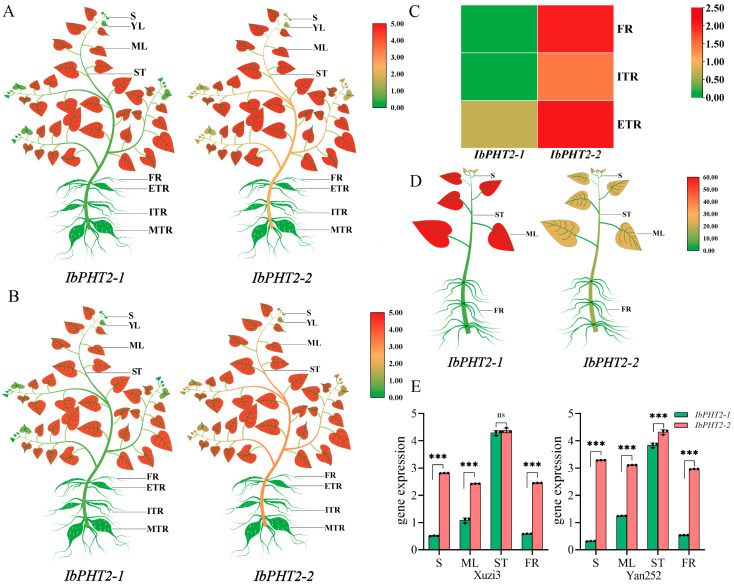
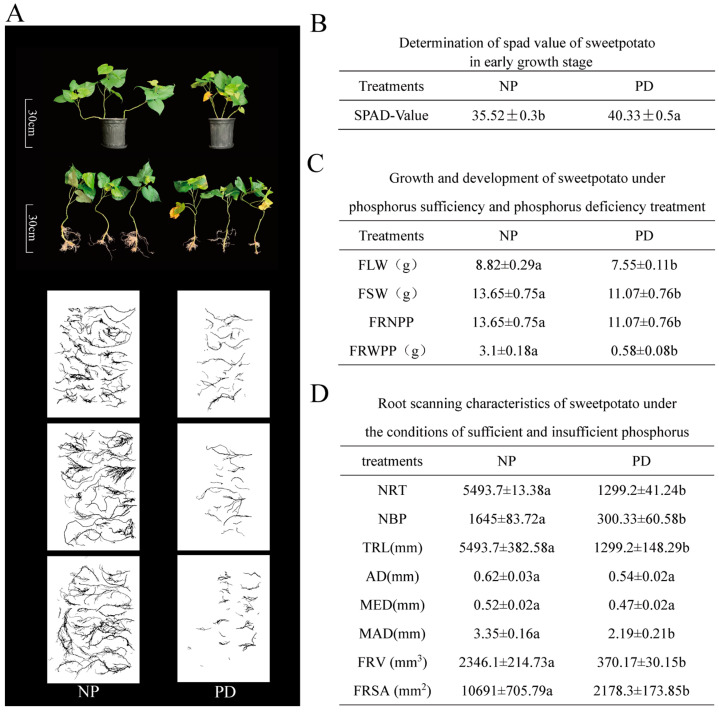
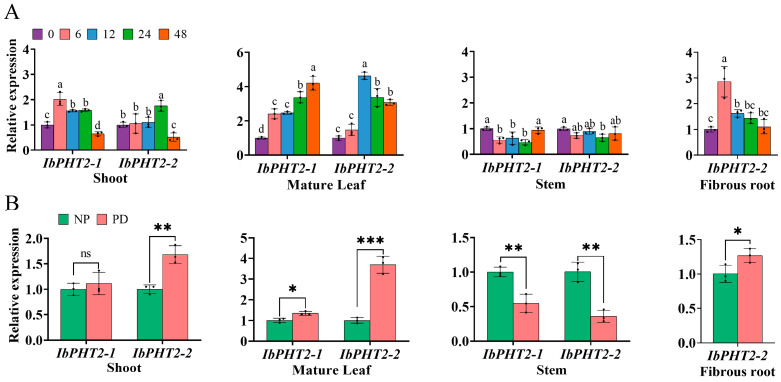
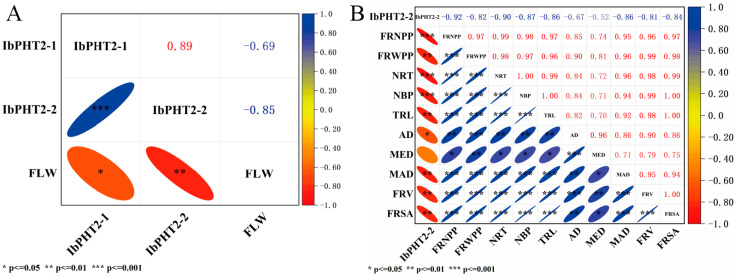
Hainan's unique climate significantly contributes to soil acidification, causing phosphorus fixation into insoluble compounds, leading to phosphorus deficiency and reduced yield in sweet potatoes. The Phosphate Transporter 2 (PHT2) family, a group of trans-membrane phosphate transporters, is crucial for phosphate transport, distribution, and homeostasis regulation. Two PHT2 genes, IbPHT2-1 and IbPHT2-2, were first identified in sweet potato, and a phylogenetic analysis of 46 species showed high conservation of the IbPHT2 gene family throughout plant evolution. Tissue-specific expression patterns of IbPHT2 genes were determined in four sweet potato varieties using transcriptome analysis and RT-qPCR. The results demonstrated that IbPHT2 was predominantly expressed in shoots, mature leaves, stems, and fibrous roots. Under phosphorus deficiency stress, IbPHT2-2 expression was upregulated in shoots, mature leaves, and fibrous roots, with higher expression in mature leaves compared to IbPHT2-1. This observation suggests that, in the context of phosphorus deficiency stress, IbPHT2-2 assumes a more pivotal function in the response mechanism. The expression levels of IbPHT2-2 presented a negative relationship with fresh leaf weight (FLW) as well as fibrous root number per plant (FRNPP) and fibrous root weight per plant (FRWPP) based on correlation analysis. The restrictive function of IbPHT2-2 became impaired by phosphorus deficiency, which resulted in inhibited leaf and root development of sweet potato. The findings of this study provide preliminary evidence that IbPHT2-2 is a key gene involved in the response to phosphorus deficiency stress, influencing phosphorus absorption and distribution in sweet potato. This research contributes to our understanding of the molecular mechanisms underlying phosphorus utilization in sweet potato and may inform future strategies for improving phosphorus use efficiency in this important crop.

Keywords: IbPHT2; phosphorus deficiency stress; sweet potato.


Conflict of interest statement

The authors declare no conflicts of interest.

Figures

Figure 1
Figure 1
Chromosomal localization and structural assessment for the PHT2 gene. (A) The chromosomal positions for IbPHT2 genes in sweet potato are illustrated. Each basic unit represents a chromosome length of 3.0 Mb. (B) From left to right, the conserved motifs, gene structures, and conserved domains of the sweet potato PHT2 gene family are depicted. The distribution of conserved motifs in IbPHT2 is represented by colored boxes for motifs 1–10, with a scale of 100 amino acids. The genetic structure of IbPHT2 genes comprises exons (depicted as yellow rectangles), as well as untranslated regions (UTRs, blue rectangles), with a scale of 1kb. The conserved structural domain of IbPHT2 genes is depicted as a single green conserved structure, with a scale of 100 amino acids. (C) Visualization of the conserved motif of IbPHT2 proteins in sweet potato is presented.
Figure 2
Figure 2
Prediction of the protein structure of sweet potato PHT2 and protein interaction network. (A,B) Illustrates the predicted secondary structure of the IbPHT2 protein. The blue Hh denotes α-helix, purple Ee indicates extended strand, green Tt represents β-turn, and yellow Cc signifies random coil. (C) Homology modeling and trans-membrane helix prediction. The tertiary structure of the sweet potato PHT2 gene protein was predicted employing homology modeling. All proteins depicted in the figure exhibit multiple helix structures (blue regions), with the N-terminal and C-terminal portions (orange regions) primarily composed of irregular coils. (D) Network prediction of sweet potato PHT2 protein interactions.
Figure 3
Figure 3
(A) Phylogenetic tree comprising PHT2 family members from 46 species. IbPHT2-1 (g11922.t1) and IbPHT2-2 (g40754.t1) represent sweet potato. The tree includes diverse species such as Ricinus communis (PcPHT2-1), Manihot esculenta (MePHT2-1), Citrus clementina (CcPHT2-1), Citrus sinensis (CsPHT2-1), Carica papaya (CpPHT2-1), Gossypium raimondii (GrPHT2-1), Theobroma cacao (TcPHT2-1), Prunus persica (PePHT2-1), Malus domestica Borkh (MdPHT2-1, MdPHT2-2), Kalanchoe fedtschenkoi (KfPHT2-1), Kalanchoe laxiflora (KlPHT2-1), Populus trichocarpa (PtPHT2-1, PtPHT2-2), Salix purpurea (SpPHT2-1, SpPHT2-2), Solanum tuberosum (StPHT2-1), Aquilegia coerulea (AcPHT2-1), Daucus carota (DcPHT2-1), Eucalyptus grandis (EgPHT2-1, EgPHT2-2), Mimulus guttatus (MgPHT2-1), Glycine max (GmPHT2-1, GmPHT2-2), Medicago truncatula (MtPHT2-1), Trifolium pratense (TpPHT2-1), Brassica oleracea capitata (BoPHT2-1, BoPHT2-2), Brassica rapa FPsc (BrPHT2-1, BrPHT2-2), Eutrema salsugineum (EsPHT2-1), Boechera stricta (BsPHT2-1), Arabidopsis thaliana Columbia (AtPHT2-1), Capsella grandiflora (CgPHT2-1), Capsella rubella (CrPHT2-1), Vitis vinifera Genoscope.12X (VvPHT2-1), Triticum aestivum L. (TaPHT2-1, BdPHT2-1), Solanum melongena L. (SmPHT2-1), Oryza sativa (OsPHT2-1), Zea mays Ensembl-18 (ZePHT2-1), Zea mays PH207 (ZaPHT2-1), Sorghum bicolor (SbPHT2-1), Panicum hallii (PhPHT2-1), Setaria italica (SiPHT2-1), Setaria viridis (SvPHT2-1), Marchantia polymorpha (MpPHT2-1), and Sphagnum fallax (SfPHT2-1). Black dots represent bootstrapping values < 0.7, and red dots represent bootstrapping values 0.7–1.0. Higher levels of bootstrap serve as an indicator for superior credibility of results. Different symbols in the figure represent specific species, where the red solid stars show the two members of sweet potato. Arabidopsis (BD) Homology analysis of the PHT2 gene across multiple species. The figures illustrate the comparative analysis of sweet potato with six other species: (B) Ipomoea trifida (triple-lobed petunia), Ipomoea batatas (sweet potato), and Ipomoea triloba (triple-lobed sweet potato). (C) Arabidopsis thaliana (Arabidopsis), Ipomoea triloba (sweet potato), and Oryza sativa (rice). (D) Manihot esculenta (cassava), Ipomoea triloba (sweet potato), and Smallanthus sonchifolius (yacon).
Figure 4
Figure 4
Functional prediction analysis of sweet potato PHT2. (A) Distribution of cis-acting elements in the sweet potato IbPHT2 gene family. The intensity of red coloration corresponds to the number of homeopathic elements. (B) Prediction of IbPHT2 phosphorylation sites in sweet potato. (C) Schematic representation of amino acid arrangement in the trans-membrane domain structure of sweet potato PHT2 protein.
Figure 5
Figure 5
PHT2 gene expression profile of Sweet potato. (A) Heat map representing tissue-specific expression in ‘Xuzi3’. S: shoot; ML: mature leaves; ST: stem; FR: fibrous root; ITR: initial tuberous root; ETR: expanding tuberous root; MTR: mature tuberous root. (B) Heat map depicting tissue-specific expression within ‘Yan252’, with abbreviations consistent with ‘Xuzi3’. (C) Heat map illustrating tissue-specific expression in ‘Annayu’. The FPKM values for the eight tissues of ‘Xuzi3’ and ‘Yan252’, as well as the three root types of ‘Annayu’, were log2 (FPKM+1) transformed to generate heat maps. (D) Heat map representing tissue-specific expression in “Heart Fragrance”. Expression values are presented as the average of three independent biological replicates, relative to root expression. Elevated expression levels are represented by red, whereas reduced expression levels are signified by green. (E) Tissue-specific expression of ‘Xuzi3’ and ‘Yan252’, The FPKM value is converted by log2(FPKM+1) to draw a histogram. Significance is denoted as: *** p < 0.001, ns: not significant.
Figure 6
Figure 6
Phenotypic alterations under NP and PD treatments. (A) Impact of phosphorus deficiency on sweet potato seedling growth. (B) Determination of Spad values under normal and phosphorus deficiency treatments during the early growth stage of sweet potato. (C) One-way analysis of variance for sweet potato agronomic traits. LSD values are presented with standard deviations following the “+” symbol, and lowercase letters following each indicator denote remarkable disparities observed between the treatment groups (p < 0.05). The presented data represent the average of five replicate measurements (n = 5). FLW: fresh leaf weight; FSW: fresh stem weight; FRNPP: fibrous root number per plant; FRWPP: fiber root weight per plant. (D) Root scanning results for NP and PD treatments. NRT: number of root tips; NBP: number of branch points; TRL: total root length; AD: average diameter; MED: median diameter; MAD: maximum diameter; FRV: fiber root volume; FRSA: fiber root surface area.
Figure 7
Figure 7
Temporal expression patterns and phenotypic alterations of IbPHT2 in sweet potato cultivar ‘Xinxiang’ under phosphorus deficiency stress and normal conditions. (A) IbPHT2 expression was analyzed over time under phosphorus deficiency. Plants were treated with phosphorus-free solution for 0, 3, 6, 12, 24, and 48 h. Expression levels are shown relative to the 0-h baseline. Analysis of variance was conducted with one-way analysis of variance, and least significant difference tests were applied. Treatment replicates were three, and different lowercase letters represent significant differences between treatments (p < 0.05). (B) IbPHT2 expression was compared under normal phosphorus (NP) and phosphorus deficiency (PD) conditions. RT-qPCR was used to quantify expression in shoots, mature leaves, stems, and fibrous roots after 15 days. Each treatment had three replicates. Significance is denoted as: * p < 0.05, ** p < 0.01, *** p < 0.001, ns: not significant.
Figure 8
Figure 8
An investigation of the correlative relationships between IbPHT2 gene expression levels as well as agronomic traits. (A) Correlation analysis between IbPHT2 gene expression level and leaf fresh weight. (B) Correlation analysis of IbPHT2-2 gene expression level with FRNPP, FRWPP, NRT, NBP, TRL, AD, MED, MAD, FRV and FRSA.

Similar articles

References

    1. Zhou M., Hu S., Wang S., Yin T., Liu Q., Li H. Sweet potato yield and quality characteristics affected by different late-season irrigation levels. J. Sci. Food Agric. 2024;104:5207–5218. doi: 10.1002/jsfa.13350. - DOI - PubMed
    1. Sun R., Wu Z., Chen B., Yang C., Qi D., Lan G., Fraedrich K. Effects of land-use change on eco-environmental quality in Hainan Island, China. Ecol. Indic. 2020;109:105777. doi: 10.1016/j.ecolind.2019.105777. - DOI
    1. Ji C., Liu H., Cha Z., Lin Q., Feng G. Spatial-Temporal Variation of N, P, and K Stoichiometry in Cropland of Hainan Island. Agriculture. 2022;12:39. doi: 10.3390/agriculture12010039. - DOI
    1. Wang D., Huang H., Feng H., Wang H., Han M., Qi Z. Distribution of copper in soil and rice system of Hainan Island, China. Braz. Arch. Biol. Technol. 2016;59:e16160516
    1. Zhang Q., Chu Y., Xue Y., Ying H., Chen X., Zhao Y., Ma W., Ma L., Zhang J., Yin Y., et al. Outlook of China’s agriculture transforming from smallholder operation to sustainable production. Glob. Food Secur. 2020;26:100444. doi: 10.1016/j.gfs.2020.100444. - DOI

MeSH terms

LinkOut - more resources