

Isolation, Characterization, and Genomic Analysis of Bacteriophages Against Pseudomonas aeruginosa Clinical Isolates from Early and Chronic Cystic Fibrosis Patients for Potential Phage Therapy
- PMID: 40142404
- PMCID: PMC11945000
- DOI: 10.3390/microorganisms13030511
Isolation, Characterization, and Genomic Analysis of Bacteriophages Against Pseudomonas aeruginosa Clinical Isolates from Early and Chronic Cystic Fibrosis Patients for Potential Phage Therapy
Abstract
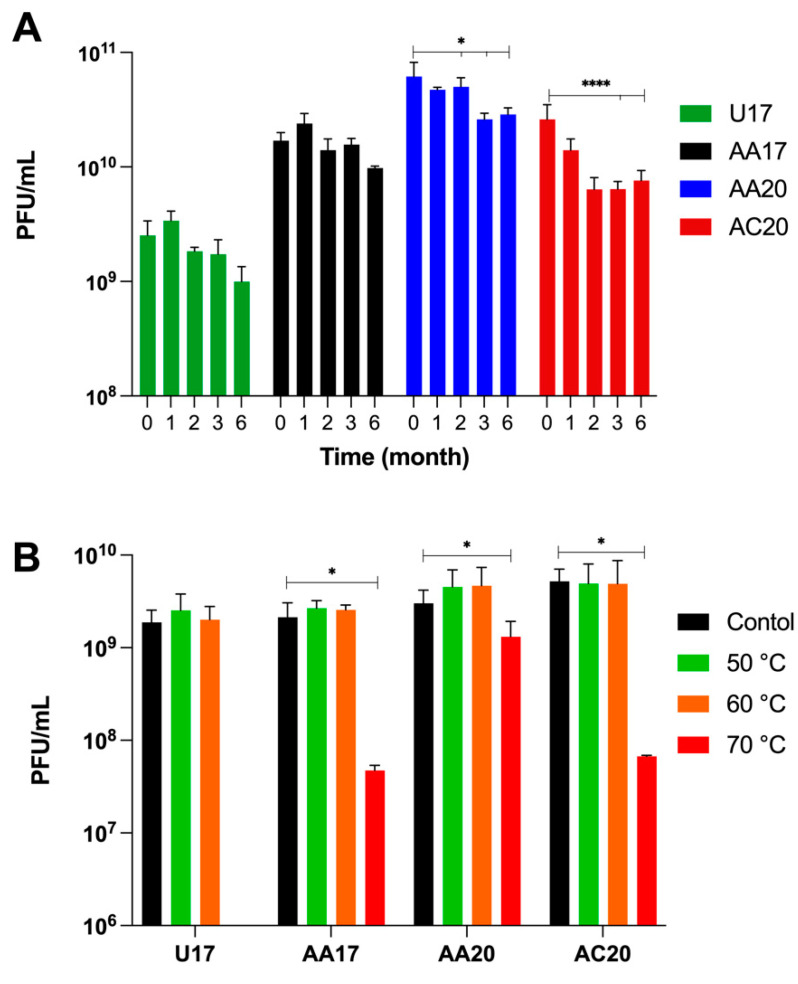
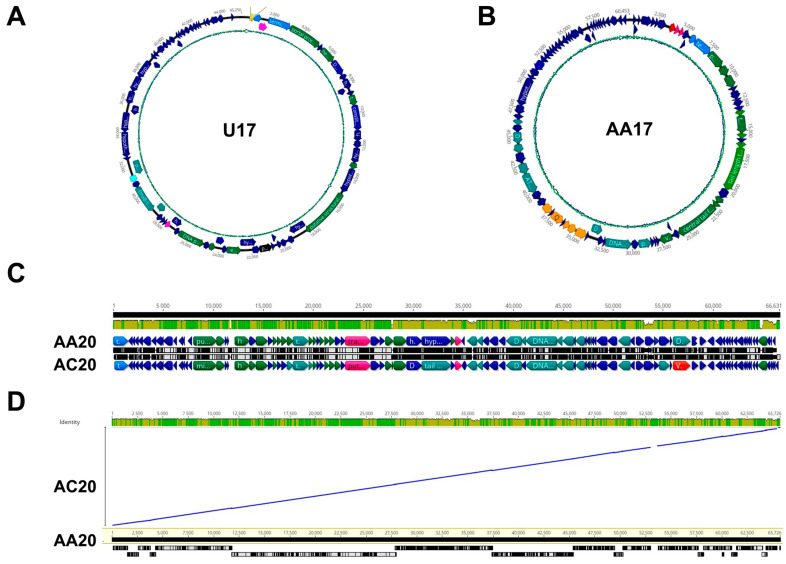
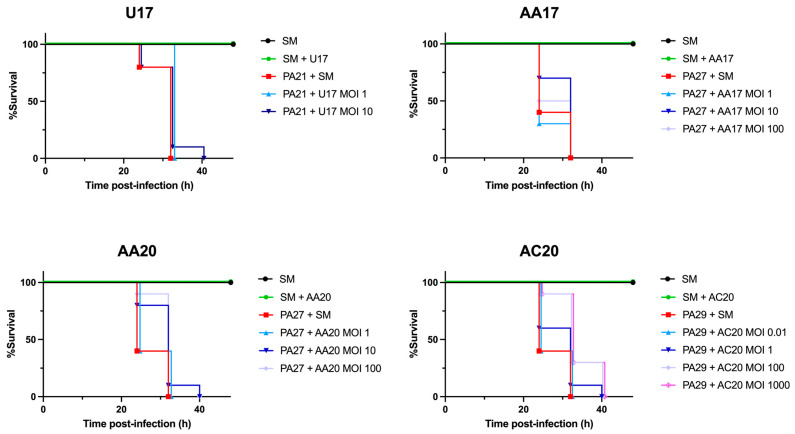
Pseudomonas aeruginosa is associated with both community and hospital-acquired infections. It colonizes the lungs of cystic fibrosis (CF) patients, establishing an ecological niche where it adapts and evolves from early to chronic stages, resulting in deteriorating lung function and frequent exacerbations. With antibiotics resistance on the rise, there is a pressing need for alternative personalized treatments (such as bacteriophage therapy) to combat P. aeruginosa infections. In this study, we aimed to isolate and characterize phages targeting both early and chronic P. aeruginosa isolates and evaluate their potential for phage therapy. Four highly virulent phages belonging to myoviral, podviral, and siphoviral morphotypes were isolated from sewage samples. These phages have a broad host range and effectively target 62.5% of the P. aeruginosa isolates with a positive correlation to the early isolates. All the phages have a virulence index of ≥0.90 (0.90-0.98), and one has a large burst size of 331 PFU/cell and a latency period of 30 min. All phages are stable under a wide range of temperature and pH conditions. Genomic analysis suggests the four phages are strictly lytic and devoid of identifiable temperate phage repressors and genes associated with antibiotic resistance and virulence. More significantly, two of the phages significantly delayed the onset of larval death when evaluated in a lethal Galleria mellonella infection model, suggesting their promise as phage therapy candidates for P. aeruginosa infections.
Keywords: Pseudomonas aeruginosa; antimicrobial resistance; bacteriophage; cystic fibrosis; lytic phage.
Conflict of interest statement
The authors declare no conflicts of interest.
Figures
Similar articles
-
Temperate Bacteriophages from Chronic Pseudomonas aeruginosa Lung Infections Show Disease-Specific Changes in Host Range and Modulate Antimicrobial Susceptibility.mSystems. 2019 Jun 4;4(4):e00191-18. doi: 10.1128/mSystems.00191-18. mSystems. 2019. PMID: 31164451 Free PMC article.
-
Isolation and Characterization of Three Pseudomonas aeruginosa Viruses with Therapeutic Potential.Microbiol Spectr. 2023 Jun 15;11(3):e0463622. doi: 10.1128/spectrum.04636-22. Epub 2023 May 1. Microbiol Spectr. 2023. PMID: 37125933 Free PMC article.
-
Bacteriophages φMR299-2 and φNH-4 can eliminate Pseudomonas aeruginosa in the murine lung and on cystic fibrosis lung airway cells.mBio. 2012 Mar 6;3(2):e00029-12. doi: 10.1128/mBio.00029-12. Print 2012. mBio. 2012. PMID: 22396480 Free PMC article.
-
Challenges and Promises for Planning Future Clinical Research Into Bacteriophage Therapy Against Pseudomonas aeruginosa in Cystic Fibrosis. An Argumentative Review.Front Microbiol. 2018 May 4;9:775. doi: 10.3389/fmicb.2018.00775. eCollection 2018. Front Microbiol. 2018. PMID: 29780361 Free PMC article. Review.
-
Pseudomonas aeruginosa Resistance to Bacteriophages and Its Prevention by Strategic Therapeutic Cocktail Formulation.Antibiotics (Basel). 2021 Feb 2;10(2):145. doi: 10.3390/antibiotics10020145. Antibiotics (Basel). 2021. PMID: 33540528 Free PMC article. Review.
Cited by
-
Virological and Pharmaceutical Properties of Clinically Relevant Phages.Antibiotics (Basel). 2025 May 10;14(5):487. doi: 10.3390/antibiotics14050487. Antibiotics (Basel). 2025. PMID: 40426553 Free PMC article.
-
Therapeutic Optimization of Pseudomonas aeruginosa Phages: From Isolation to Directed Evolution.Viruses. 2025 Jun 30;17(7):938. doi: 10.3390/v17070938. Viruses. 2025. PMID: 40733556 Free PMC article.
References
-
- WHO WHO Publishes List of Bacteria for Which New Antibiotics Are Urgently Needed. 2017. [(accessed on 1 September 2024)]. Available online: https://www.who.int/news/item/27-02-2017-who-publishes-list-of-bacteria-....
Grants and funding
- 2022 National Research Council of Canada Postdoctoral Fellowship/2022 National Research Council of Canada Postdoctoral Fellowship
- an Ideation Small Team Project grant and an Ideation New Beginning grant from the National Program Office and the Vaccines and Emerging Infection Research Initiative at National Research Council Canada./an Ideation Small Team Project grant and an Ideation New Beginning grant from the National Program Office and the Vaccines and Emerging Infection Research Initiative at National Research Council Canada.
LinkOut - more resources
Full Text Sources
