

A Spatiotemporal Analysis of a High-Resolution Molecular Network Reveals Shifts of HIV-1 Transmission Hotspots in Guangzhou, China
- PMID: 40143312
- PMCID: PMC11945462
- DOI: 10.3390/v17030384
A Spatiotemporal Analysis of a High-Resolution Molecular Network Reveals Shifts of HIV-1 Transmission Hotspots in Guangzhou, China
Abstract
Background: High-resolution and longitudinal HIV molecular surveillance can inform the evolving hotspots to tailor regionally focused control strategies.
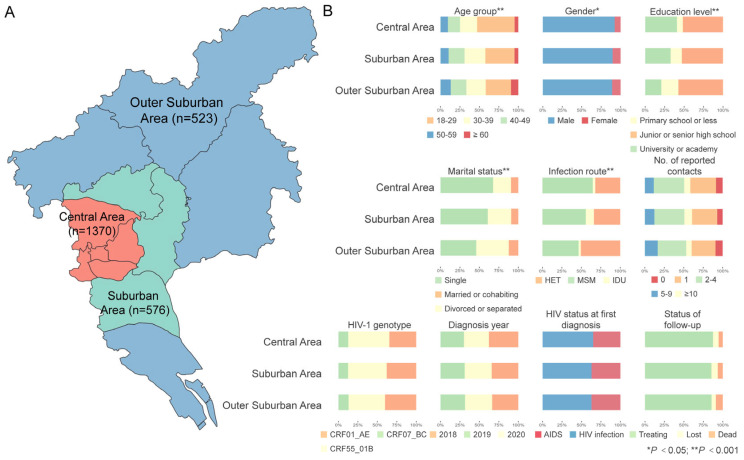
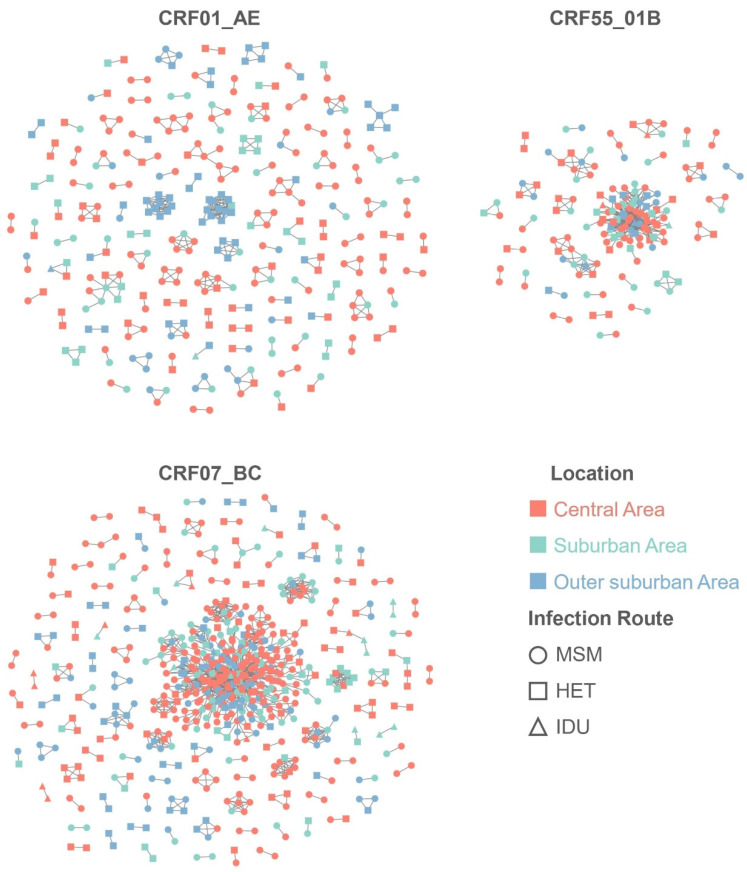
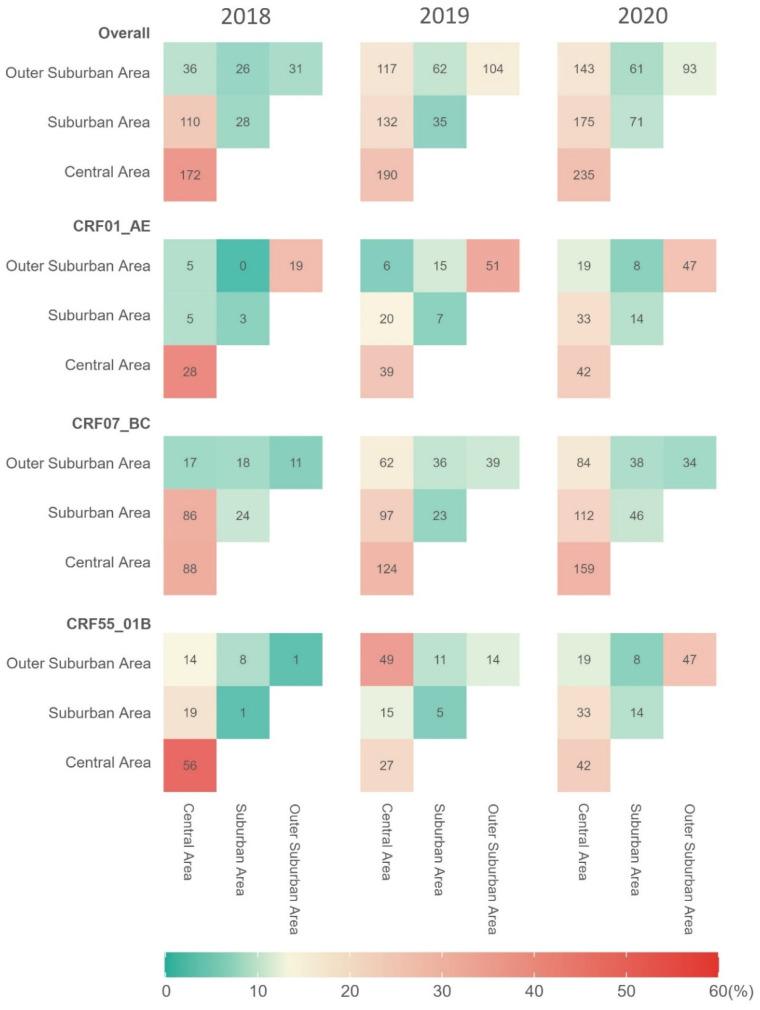
Methods: HIV-1 pol sequences of three predominant genotypes (CRF01_AE, CRF07_BC, and CRF55_01B) were collected for molecular network reconstruction from people living with HIV (PLWH) in Guangzhou (2018-2020). They were categorized by geographical residences into central, suburban, and outer suburban areas. Clustering rates, assortativity coefficients, and intensity matrices were employed to assess transmission dynamics, geographic mixing patterns, and intra- and inter-area transmission, respectively.
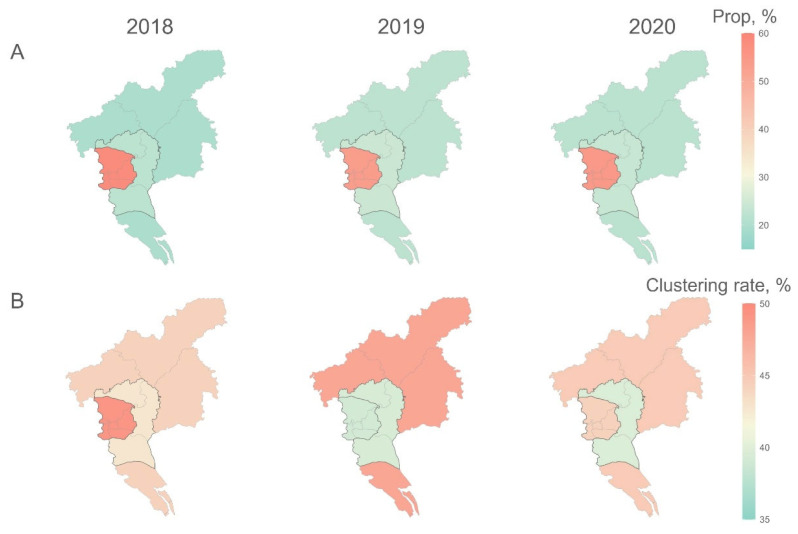
Results: Of the 2469 PLWH, 55.5% resided in the central area. Clustering rates showed no significant differences across areas (44.5%, 40.6% vs. 45.7%; p = 0.184). However, the transmission hotspots for CRF01_AE and CRF55_01B shifted to the outer suburban area. PLWH tended to form links within their local area (assortativity coefficient = 0.227, p < 0.001), particularly for CRF01_AE (0.512, p < 0.001; intra-area intensity = 69.2%). The central area exhibited the highest but decreasing intra-area transmission (74.5% to 30.2%), while intra- and inter-area transmission involving the outer suburban area increased (23.1% to 38.2%).
Conclusions: Despite most PLWH residing in the central area, the outer suburban area emerged as the hotspot, requiring interventions towards both intra- and inter-area transmission.
Keywords: human immunodeficiency virus; molecular transmission network; spatiotemporal analysis.
Conflict of interest statement
No conflicts of interest were declared by the authors.
Figures
Similar articles
-
Divergent transmission dynamics and drug resistance evolution of HIV-1 CRF01_AE and CRF07_BC in Tianjin, China (2013-2022).Virol J. 2025 May 8;22(1):137. doi: 10.1186/s12985-025-02704-y. Virol J. 2025. PMID: 40340650 Free PMC article.
-
High genetic diversity of HIV-1 pol region and molecular transmission networks among people living with HIV-1 in Haikou, South China, 2005-2022.BMC Infect Dis. 2025 Jul 1;25(1):813. doi: 10.1186/s12879-025-11184-y. BMC Infect Dis. 2025. PMID: 40597723 Free PMC article.
-
Phylogenetic analysis and transmission networks highlight the role of older adults in the transmission of HIV-1 in northern Zhejiang, China.Virol J. 2025 Mar 15;22(1):75. doi: 10.1186/s12985-025-02681-2. Virol J. 2025. PMID: 40089756 Free PMC article.
-
Geographic Distribution and Temporal Trends of HIV-1 Subtypes through Heterosexual Transmission in China: A Systematic Review and Meta-Analysis.Int J Environ Res Public Health. 2017 Jul 24;14(7):830. doi: 10.3390/ijerph14070830. Int J Environ Res Public Health. 2017. PMID: 28737729 Free PMC article.
-
Antiretrovirals for reducing the risk of mother-to-child transmission of HIV infection.Cochrane Database Syst Rev. 2011 Jul 6;(7):CD003510. doi: 10.1002/14651858.CD003510.pub3. Cochrane Database Syst Rev. 2011. PMID: 21735394
References
-
- UNAIDS Global HIV & AIDS Statistics—Fact Sheet 2024. [(accessed on 7 July 2024)]. Available online: https://www.unaids.org/en/resources/fact-sheet.
-
- Yuan D., Yu B., Liang S., Fei T., Tang H., Kang R., Li Y., Ye L., Jia P., Yang S. HIV-1 Genetic Transmission Networks among People Living with HIV/AIDS in Sichuan, China: A Genomic and Spatial Epidemiological Analysis. Lancet Reg. Health West Pac. 2022;18:100318. doi: 10.1016/j.lanwpc.2021.100318. - DOI - PMC - PubMed
-
- Wirtz A.L., Trapence G., Kamba D., Gama V., Chalera R., Jumbe V., Kumwenda R., Mangochi M., Helleringer S., Beyrer C., et al. Geographical Disparities in HIV Prevalence and Care Among Men Who Have Sex with Men in Malawi: Results from a Multisite Cross-sectional Survey. Lancet HIV. 2017;4:e260–e269. doi: 10.1016/S2352-3018(17)30042-5. - DOI - PubMed
-
- Anderson S.J., Cherutich P., Kilonzo N., Cremin I., Fecht D., Kimanga D., Harper M., Masha R.L., Ngongo P.B., Maina W., et al. Maximising the Effect of Combination HIV Prevention through Prioritisation of the People and Places in Greatest Need: A Modelling Study. Lancet. 2014;384:249–256. doi: 10.1016/S0140-6736(14)61053-9. - DOI - PubMed
Publication types
MeSH terms
Substances
Grants and funding
- 2023YFC3503002/National Key Research and Development Program of China
- 2024ZXPY22/Humanities and Social Sciences Cultivation Project of Guangzhou University of Chinese Medicine
- 2021A1515011591/Guangdong Basic and Applied Basic Research Foundation
- A2023393/Guangdong Medical Science and Technology Research Foundation
- 2023B03J1259, 2025A03J3540 and 2025A03J3698/Guangzhou Medical Science and Technology Grant
LinkOut - more resources
Full Text Sources
Medical
