. 2025 Mar 12;17(3):402.
doi: 10.3390/v17030402.

Biochemical Screening of Phytochemicals and Identification of Scopoletin as a Potential Inhibitor of SARS-CoV-2 Mpro, Revealing Its Biophysical Impact on Structural Stability

Affiliations

Biochemical Screening of Phytochemicals and Identification of Scopoletin as a Potential Inhibitor of SARS-CoV-2 Mpro, Revealing Its Biophysical Impact on Structural Stability

Sarika Bano et al. Viruses. .

Abstract

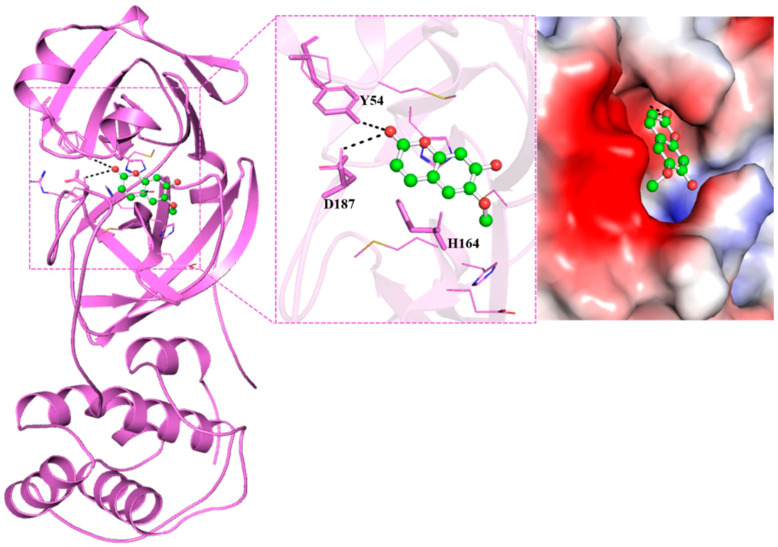
The main protease (Mpro or 3CLpro or nsp5) of SARS-CoV-2 is crucial to the life cycle and pathogenesis of SARS-CoV-2, making it an attractive drug target to develop antivirals. This study employed the virtual screening of a few phytochemicals, and the resultant best compound, Scopoletin, was further investigated by a FRET-based enzymatic assay, revealing an experimental IC50 of 15.75 µM. The impact of Scopoletin on Mpro was further investigated by biophysical and MD simulation studies. Fluorescence spectroscopy identified a strong binding constant of 3.17 × 10⁴ M⁻1 for Scopoletin binding to Mpro, as demonstrated by its effective fluorescence quenching of Mpro. Additionally, CD spectroscopy showed a significant reduction in the helical content of Mpro upon interaction with Scopoletin. The findings of thermodynamic measurements using isothermal titration calorimetry (ITC) supported the spectroscopic data, indicating a tight binding of Scopoletin to Mpro with a KA of 2.36 × 10³ M-1. Similarly, interaction studies have also revealed that Scopoletin forms hydrogen bonds with the amino acids nearest to the active site, and this has been further supported by molecular dynamics simulation studies. These findings indicate that Scopoletin may be developed as a potential antiviral treatment for SARS-CoV-2 by targeting Mpro.

Keywords: FRET-based Mpro assay; Scopoletin; fluorescence quenching; isothermal titration calorimetry; main protease.


Conflict of interest statement

The authors declare no conflicts of interest.

Figures

Figure 1
Figure 1
Structural depiction of docked compound, Scopoletin, within the binding cavity of SARS-CoV-2 Mpro, depicting interactions with Y54, D187, and H164.
Figure 2
Figure 2
(A) A 2D graphical depiction of the interactions present between the selected compound, Scopoletin, and the residues of SARS-CoV-2 Mpro. (B) A 2D graphical depiction of the interactions present between the positive control, Quercetin and the residues of SARS-CoV-2 Mpro, depicting HIS41, GLY143, ARG188, ASP187, GLN189, MET165, CYS145, HIS164, and TYR54 residues as the key amino acids involved in these interactions.
Figure 3
Figure 3
Electrophoretic analyses of purified Mpro. (A) SDS-PAGE result showing a thick band of Mpro around 33 kDa. (B) A similar thick dark band can be seen around 33 kDa in the Western blot result.
Figure 4
Figure 4
Enzymatic inhibition of Mpro in presence of different concentrations of Scopoletin; IC50 value was calculated as 15.75 µM.
Figure 5
Figure 5
(A) Fluorescence emission spectra in the presence of varying concentrations of Scopoletin (0.5 µM to 11 µM). The progressive quenching of fluorescence intensity indicates the interaction between Mpro and Scopoletin. (B) Fluorescence emission spectra of Mpro in the native state and in the presence of an 11 µM concentration of Scopoletin. The significant reduction in fluorescence intensity highlights the quenching effect of Scopoletin on Mpro. The arrow suggests the decrease in fluorescence intensity between the native and Scopoletin-bound states of Mpro. Blue line indicates fluorescence quenching upon addition of 11 µM Scopoletin indicating physical interaction of this ligand with Mpro.
Figure 6
Figure 6
A graph representing the quenching of Scopoletin fluorescence is typically shown using a double logarithmic plot. The graph effectively illustrates the relationship between fluorescence quenching and the concentration of the quencher, Scopoletin.
Figure 7
Figure 7
This plot involves graphing the reciprocal of the reaction rate (1/∆F) against the reciprocal of the ligand concentration (1/[concentration of Scopoletin] in µM) by examining the changes in the slope and intercepts of the plot in the presence of Scopoletin.
Figure 8
Figure 8
Graph depicting secondary structural changes in Mpro upon the addition of varying concentrations of Scopoletin. Although the overall shape remained the same, some reduction was observed in the secondary structure of Mpro, which is indicative of specific and localized binding.
Figure 9
Figure 9
ITC profile of Mpro in the presence of Scopoletin. The raw data obtained by sequentially titrating Scopoletin into the sample cell containing the Mpro protein have been displayed in the upper panel. The binding isotherm displayed in the lower panels is generated by plotting the integrated heat results from the calorimetric titration after correcting for dilution heat versus the molar ratio of Scopoletin and Mpro. Affinity/Kd = 4.24 × 10⁻⁴ M. formula image boxes indicate change in heat energy in kJ mol−1 per injection of ligand to the protein.
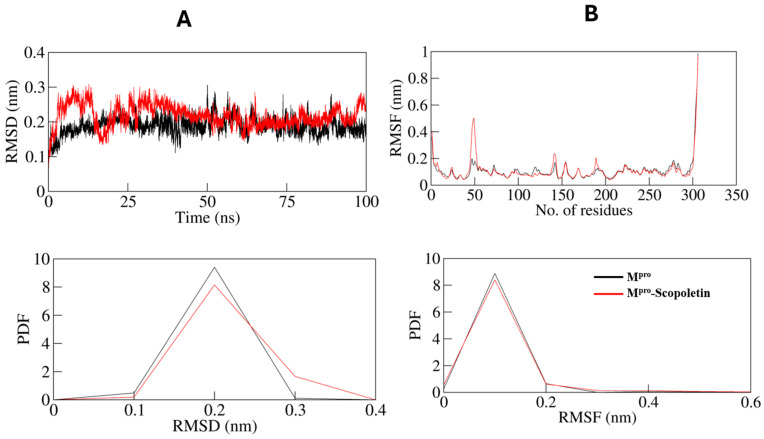
Figure 10
Figure 10
Compactness and structural dynamics of SARS-CoV-2 Mpro upon Scopoletin binding as a function of time. (A) RMSD profile of Mpro in complex with Scopoletin. (B) Residual fluctuations (RMSF) plot of Mpro before and after 0.107368 nm and 0.109368 nm. Black line: only Mpro; red line: Scopoletin bound Mpro.
Figure 11
Figure 11
(A) Time evolution of radius of gyration. (B) SASA plot of Mpro as function of time. Black line: only Mpro; red line: Scopoletin bound Mpro.
Figure 12
Figure 12
(A) Time evolution and stability of hydrogen bonds formed within 0.35 nm intra-Mpro, and (B) the probability distribution function (PDF) of the H-bonds for both the systems. Black line: only Mpro; red line: Scopoletin bound Mpro.
Figure 13
Figure 13
The simulation analyzed the stability of Mpro before and after Scopoletin binding by examining the time evolution of intramolecular hydrogen bonds (H-bonds) within 0.35 nm. The probability distribution function (PDF) of the H-bonds was also plotted, revealing average H-bond counts of 211 and 212 for the unbound and bound states, respectively.
Figure 14
Figure 14
Principal component analysis. (A) Two-dimensional projections of trajectories on eigenvectors (EVs) showing conformational projections of SARS-CoV-2 Mpro and (B) Mpro–Scopoletin (C) Time evolution of projections of trajectories on both EVs. (D) Residual fluctuations of Mpro on EV1.
Figure 15
Figure 15
The Gibbs energy landscapes for (A) free Mpro and (B) Mpro–Scopoletin.
Figure 16
Figure 16
An illustration depicting the life cycle of SARS-CoV-2 in the presence and absence of the inhibitor Scopoletin. Mpro, an essential cysteine protease in the life cycle of SARS-CoV-2, is responsible for polyprotein processing, which results in the formation of 16 non-structural proteins (nsps). These nsps are crucial for replicating and transcribing the viral genome. Scopoletin potentially inhibits Mpro, thus impacting polyprotein processing and in turn inhibiting the replication and transcription of the viral genome.

Similar articles

References

    1. Pang X., Xu W., Liu Y., Li H., Chen L. The research progress of SARS-CoV-2 main protease inhibitors from 2020 to 2022. Eur. J. Med. Chem. 2023;257:115491. doi: 10.1016/j.ejmech.2023.115491. - DOI - PMC - PubMed
    1. Abdelrahman Z., Li M., Wang X. Comparative Review of SARS-CoV-2, SARS-CoV, MERS-CoV, and Influenza A Respiratory Viruses. Front. Immunol. 2020;11:552909. doi: 10.3389/fimmu.2020.552909. - DOI - PMC - PubMed
    1. Dey J.K., Dey S.K. SARS-CoV-2 pandemic, COVID-19 case fatality rates and deaths per million population in India. J. Bioinform. Comput. Syst. Biol. 2020;2:5000110
    1. Yang H., Rao Z. Structural biology of SARS-CoV-2 and implications for therapeutic development. Nat. Rev. Microbiol. 2021;19:685–700. doi: 10.1038/s41579-021-00630-8. - DOI - PMC - PubMed
    1. Tao X., Zhang L., Du L., Liao R., Cai H., Lu K., Zhao Z., Xie Y., Wang P.-H., Pan J.-A., et al. Allosteric inhibition of SARS-CoV-2 3CL protease by colloidal bismuth subcitrate. Chem. Sci. 2021;12:14098–14102. doi: 10.1039/D1SC03526F. - DOI - PMC - PubMed

Publication types

MeSH terms

LinkOut - more resources