. 2025 Sep;21(9):1911-1926.
doi: 10.1080/15548627.2025.2482516. Epub 2025 Apr 3.

ATG16L1 WD domain and linker regulates lipid trafficking to maintain plasma membrane integrity to limit influenza virus infection

Affiliations

ATG16L1 WD domain and linker regulates lipid trafficking to maintain plasma membrane integrity to limit influenza virus infection

Benjamin Bone et al. Autophagy. 2025 Sep.

Abstract

The non-canonical functions of autophagy protein ATG16L1 are dependent on a C-terminal WD domain. Recent studies show that the WD domain is required for conjugation of LC3 to single membranes during endocytosis and phagocytosis, where it is thought to promote fusion with lysosomes. Studies in cells lacking the WD domain suggest additional roles in the regulation of cytokine receptor recycling and plasma membrane repair. The WD domain also protects mice against lethal influenza virus in vivo. Here, analysis of mice lacking the WD domain (ΔWD) shows enrichment of cholesterol in brain tissue suggesting a role for the WD domain in cholesterol transport. Brain tissue and cells from ΔWD mice showed reduced cholesterol and phosphatidylserine (PS) in the plasma membrane. Cells from ΔWD mice also showed an intracellular accumulation of cholesterol predominantly in late endosomes. Infection studies using IAV suggest that the loss of cholesterol and PS from the plasma membrane in cells from ΔWD mice results in increased endocytosis and nuclear delivery of IAV, as well as increased Ifnb/Ifnβ and Isg15 gene expression. Upregulation of Il6, Ifnb and Isg15 mRNA were observed in "ex vivo" precision cut lung slices from ΔWD mice both at rest and in response to IAV infection. Overall, we present evidence that regulation of lipid transport by the WD domain of ATG16L1 may have downstream implications in attenuating viral infection and limiting lethal cytokine signaling.Abbreviations: BMDM: bone marrow-derived macrophages, CASM: conjugation of ATG8 to single membranes, CCD: coil-coil domain, IAV: influenza virus A, IFIT1: interferon-induced protein with tetratricopeptide repeats 1, IFITM3: interferon induced transmembrane protein 3, IFN: interferon, ISG15: ISG15 ubiquitin-like modifier, LANDO: LC3-associated endocytosis, LAP: LC3-associated phagocytosis, LDL: low density lipoprotein, NP: nucleoprotein, PS: phosphatidylserine, WD: WD40-repeat-containing C-terminal domain, WT: wild type.

Keywords: ATG16L1 WD domain; cholesterol; cytokine storm; influenza virus; interferon; non-canonical autophagy.


Conflict of interest statement

No potential conflict of interest was reported by the author(s).

Figures

Figure 1.
Figure 1.
Lung explants from ΔWD mice demonstrated increased IAV replication and cytokine responses. (A) In vivo brightfield images of mouse lung explants at 10×, 20× and 40× magnification showing lung architecture of vessels, bronchioles, and cilia. Scale bar: 150 µm (B) titration of IAV X31 replication in WT and ΔWD independent lung slices from 6 mice, at 24, 48 and 72 hpi, virus was titrated on MDCK cells and PFU/mL (+SEM) shown per slice for the different time points. Mann Whitney U test: *p < 0.05. n = 6. (C) Relative expression (+SEM) of Ifit1, Isg15, Ifitm3 and Il6 mRNA, normalized to Rn18s rRNA, at 16 hours post IAV challenge in WT and ΔWD independent lung slices from 6 mice. Mann Whitney U test: *p < 0.05 n = 7 WT, n = 5 ΔWD.
Figure 2.
Figure 2.
ATG16L1 WD domain slowed IAV entry and attenuated cytokine responses at homeostasis and following IAV and dsRNA challenge. (A) IAV was bound to WT and ΔWD MEF cells for 60 mins on ice before internalization at 37 C for 30 mins. Red puncta stained with PINDA showed external virus, green puncta stained with HA1 showed internalized virus (white arrows) and yellow showed double stained external virus which were identified by the spot detection algorithm using CellProfiler. Controls included incubation with 80 µm dynasore, a noncompetitive reversible inhibitor of dynamin, for 30 mins, and uninfected mock control. Cells were counterstained with WGA at 647 nm to show plasma membrane (magenta) and DAPI for nuclei (blue). Percentage of virus internalized per cell is presented as a violin plot. A Mann-Whitney U test was performed: **** = p < 0.0001. Cell numbers counted were 837 WT and 417 ΔWD cells, analyzed across 3 independent coverslips. (B) WT and ΔWD cells were infected with IAV X31 over a time course of 0–5 hpi, fixed and stained with anti-np antibody (green). The graph shows the average corrected total nuclear fluorescence determined for each cell nuclei (+SEM). A Mann-Whitney U test was performed: **p < 0.01 ***p < 0.001, 30 cells were analyzed across 4 independent coverslips. (C) Relative quantity of IAV X31 viral RNA (+SEM) in WT and ΔWD cells over a time course of 4 to 12 hpi by qPCR. Independent samples t-test performed: *p < 0.05 **p < 0.01. n = 3. (D) Basal expression levels of Ifnb1 mRNA (+SEM) in uninfected WT and ΔWD MEFS, relative to Rn18s rRNA measured by qPCR. Mann Whitney U test performed: *p < 0.05 n = 5. (E) Ifnb1 mRNA expression relative to Rn18s rRNA after 0–120 mins time course of IAV infection in WT and ΔWD MEFs. Mann Whitney U test: **p < 0.005. Independent samples t-test: ***p < 0.001. n = 3. (F) Isg15 and Ifit1 mRNA expression levels (+SEM) relative to Rn18s rRNA after 0–12-h infection with IAV X31 in WT and ΔWD MEFs. Independent samples t-test: **p < 0.005. Independent samples t-test: ***p < 0.001. n = 3. (G) Isg15, Ifit1 and Ifnb1 mRNA expression levels relative to Rn18s rRNA in MEFs from WT and ΔWD mice treated with poly I:C (dsRNA) for 4 h, measured by qPCR. Independent samples t-test: ***p < 0.001. n = 3. (H) Isg15, Ifit1 and Ifnb1 mRNA expression levels relative to Rn18s rRNA in BMDMs from WT and ΔWD treated with dsRNA for 4 h, measured by qPCR. Independent samples t-test performed: no significant comparisons detected. n = 3. (I) Ifnb1, Isg15 and Ifit1 mRNA levels relative to Rn18s rRNA in BMDMs infected with IAV PR8 or IAV X31 for 4 hpi, or treated with TLR9 ligand (5 µm) for 4 h. Independent samples t-test: **p < 0.01. ***p < 0.001. n = 3.
Figure 3.
Figure 3.
WD domain of ATG16L1 slowed fusion of IAV to the plasma membrane. (A) Time course of nucleoprotein puncta frequency (+SEM) in WT and ΔWD MEFs of IAV NP at 30 mins using mouse anti-np and anti- mouse secondary 488. (B) Graphs show a time course of frequency (+SEM) of NP puncta in WT and ΔWD MEFs at 10, 30 and 50 mins MEFs cells following acid fusion at pH5 and or control pH7. Mann Whitney U test: ***p < 0.001, 50 cells analyzed across 3 independent experiments. (C) Nucleoprotein puncta frequency (+SEM) in WT and ΔWD MEFs cells at 50 mins post infection after pre-treatment with U18666A (3 µg/mL) for 24 h, or 25 hydroxy cholesterol (5 µm) for 16 h or cholesterol (80 µm) for 12 h as indicated. Mann Whitney U test: ***p < 0.001, **p < 0.01.
Figure 4.
Figure 4.
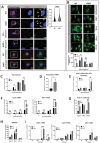
Intracellular cholesterol and phosphatidyl serine (PS) accumulated in late endosomes in MEFs lacking the WD domain. (A) Increased size and frequency of cholesterol aggregation in ΔWD MEFs. WT and ΔWD MEFs were fixed and stained with filipin III or transfected with a plasmid encoding D4H mCherry for 24 hours before fixing and staining with DAPI and viewed by Zeiss LSM980-airyscan confocal microscope. White arrows show cholesterol at plasma membrane in WT and intracellular aggregation in ΔWD. Top graph: filipin puncta per cell in WT and ΔWD MEFs stained with filipin were imaged in the 358 nm channel of a LSM 980 airy-scan 2 confocal microscope. Individual puncta in individual cells for each group were counted by hand in Zen2 software. Unpaired T-test of each group’s mean puncta count per cell (WT N = 12, ΔWD N = 14) using GraphPad Prism software. Bottom graph: D4H mCherry puncta per cell (+SEM). Mann Whitney U test: *p < 0.05, n = 10. (B) Increased phosphatidylserine (PS) and cholesterol in cytoplasmic puncta in ΔWD MEFs. WT and ΔWD MEFs were transfected with D4H mCherry and PS biosensor lact-C2-gfp plasmids for 24 hours before fixing and imaging. Graph shows number of double-positive puncta (+SEM). Mann Whitney U test performed: **p < 0.01, n = 8. (C) PS loss from plasma membrane in ΔWD MEFs was restored following treatment with T0901317. Untreated (left panel images) and T0901317 treated (right panel images) WT and ΔWD MEFs were transfected with the lact-C2-gfp plasmid for 24 hours. White boxes are enlarged plasma membrane from image. Right panel shows WT and ΔWD cells treated with T0901317 for 24 h before fixing and staining with DAPI. Cytoplasm standardized fluorescent intensity of membrane is shown in graph (+SEM). Mann Whitney U test performed: ****p < 0.0001 N = 8. (D) PS accumulates in large RAB7-positive cytoplasmic vesicles in ΔWD cells and restored to plasma membrane by T09011317 treatment. Untreated (left panel images) and T0901317 treated (right panel images) WT and ΔWD MEFs were transfected with the lact-C2-gfp plasmid for 24 hours before fixing and staining with anti-rab 594. PS is seen with Rab7 in large vesicles of untreated ΔWD cells. T0901317 drug treatment significantly reduces ΔWD MEF PS-GFP/Rab7 puncta in ΔWD and restores plasma membrane staining. Graphs quantify PS/RAB7 colocalized puncta (+SEM). Mann Whitney U test performed: ****P <0.0001 WT n = 9, ΔWD n = 8. (E) Intracellular cholesterol accumulation in ΔWD MEFS is reversed following treatment with T09011317. Untreated (left panel images) and T0901317 treated (right panel images) WT and ΔWD MEFs were transfected with the D4H mCherry plasmid and stained with anti-RAB7 488. Graphs quantify D4H mCherry/RAB7 colocalized puncta (+SEM). Mann Whitney U test performed: ****p < 0.0001 n = 8.
Figure 5.
Figure 5.
The ΔWD mutation impaired the localization of LC3 to PS/cholesterol vesicles. (A) Distribution of lysosomes and early endosomes with cholesterol in WT and ΔWD cells. Cells were transfected with D4H and immunostained with either LAMP1 or EEA1 antibodies. Pearson correlation coefficients of D4H mCherry colocalization with LAMP1 or EEA1 are presented on the graph (+SEM). Mann Whitney U test performed: **p < 0.01, n = 14. (B) WT and ΔWD MEFs transfected with lact-C2-gfp were treated with chloroquine (50ug/ml) for 2 h before fixing in methanol and staining with mouse anti- LC3B antibody with anti-mouse 594 secondary antibody (red). Bar chart shows counts of LC3b/Lact-C2-gfp double-positive intracellular puncta after chloroquine treatment of WT and ΔWD MEFs for 2 h. Puncta counted using ImageJ, with graphing and statistical analysis (unpaired T-test) using GraphPad prism (WT N = 10, ΔWD N = 11).
Figure 6.
Figure 6.
Plasma membrane in brains of mice lacking WD domain of ATG16L1 were deficient in cholesterol. (A) Total and unesterified cholesterol was quantified from MEF lysates using the Amplex Red cholesterol assay, and normalized to the protein concentration of the WT and ΔWD samples (±SEM). Independent samples t-test performed: ns = p > 0.05 N = 3. (B) Western blot showing MEF cells following fractionation by ultracentrifugation on a 2.5–50% Nycodenz-sucrose gradient and the plasma membrane (PM) fractions identified by ITGB1/β1 integrin western blot, quantified on ImageJ (numbers below respective band). (C) Total and unesterified cholesterol was quantified from MEF PM fractions, identified in Fig 6B. Graphs report cholesterol concentration normalized to protein concentration of WT and ΔWD samples (±SEM). Independent samples t-test performed: *p < 0.05 n = 3. (D) total and unesterified cholesterol was quantified from brain tissue lysates. Graphs report cholesterol concentration normalized to protein concentration of WT and ΔWD samples (±SEM). Independent samples t-test performed: **p < 0.01, ***p < 0.001 n = 3. (E) Western blot showing brain tissue following fractionation by ultracentrifugation on a 2.5–50% step Nycodenz-sucrose gradient and the plasma membrane fractions identified by Na/K ATPase beta subunit western blot, quantified on image J (numbers below respective band). (F) Total and unesterified cholesterol was quantified from brain PM fractions, identified in Figure 6E. Graphs report cholesterol concentration normalized to protein concentration of WT and ΔWD samples (±SEM). Independent samples t-test performed: * = p < 0.05 n = 3. (G). Total and unesterified cholesterol was quantified from brain tissue lysates of mice treated or untreated with T0901317 for 3 days. Graphs report cholesterol concentration normalized to protein concentration of WT and ΔWD samples (±SEM). Independent samples t-test performed: *p < 0.05, **p < 0.01, ***p < 0.001, ****p < 0.0001 n = 3. (H) Western blot showing brain tissue following treatment of mice with T0901317 for 3 days, fractionated on a 2.5%- 50% Nycodenz-sucrose gradient and the plasma membrane fractions identified by ATP1B/Na+/K+ ATPase beta subunit western blot. (I) Total and unesterified cholesterol was quantified from brain PM fractions of mice treated or untreated with T0901317 for 3 days. Graphs report cholesterol concentration normalized to protein concentration of WT and ΔWD samples (±SEM). Independent samples t-test performed: * = p < 0.05.

References

    1. Romanov J, Walczak M, Ibiricu I, et al. Mechanism and functions of membrane binding by the Atg5-Atg12/Atg16 complex during autophagosome formation. Embo J. 2012;31(22):4304–4317. doi: 10.1038/emboj.2012.278 - DOI - PMC - PubMed
    1. Münz C. Non-canonical functions of autophagy proteins in immunity and infection. Mol Aspects Med. 2021;82:100987. - PubMed
    1. Heckmann BL, Green DR. LC3-associated phagocytosis at a glance. J Cell Sci. 2019;132(5):jcs222984. - PMC - PubMed
    1. Sanjuan MA, Dillon CP, Tait SWG, et al. Toll-like receptor signaling in macrophages links the autophagy pathway to phagocytosis. Nature. 2007;450(7173):1253–1257. - PubMed
    1. Hamaoui D, Subtil A. ATG16L1 functions in cell homeostasis beyond autophagy. FEBS J. 2022;289(7):1779–1800. - PubMed

MeSH terms