. 2025 May;45(5):702-721.
doi: 10.1161/ATVBAHA.124.322045. Epub 2025 Mar 27.

The 9p21.3 Coronary Artery Disease Risk Locus Drives Vascular Smooth Muscle Cells to an Osteochondrogenic State

Affiliations

The 9p21.3 Coronary Artery Disease Risk Locus Drives Vascular Smooth Muscle Cells to an Osteochondrogenic State

Elsa Salido et al. Arterioscler Thromb Vasc Biol. 2025 May.

Abstract

Background: Genome-wide association studies have identified common genetic variants at ≈300 human genomic loci linked to coronary artery disease susceptibility. Among these genomic regions, the most impactful is the 9p21.3 coronary artery disease risk locus, which spans a 60-kb gene desert and encompasses ≈80 SNPs (single nucleotide polymorphism) in high linkage disequilibrium. Despite ≈2 decades since its discovery, the role of the 9p21.3 locus in cells of the vasculature remains incompletely resolved.

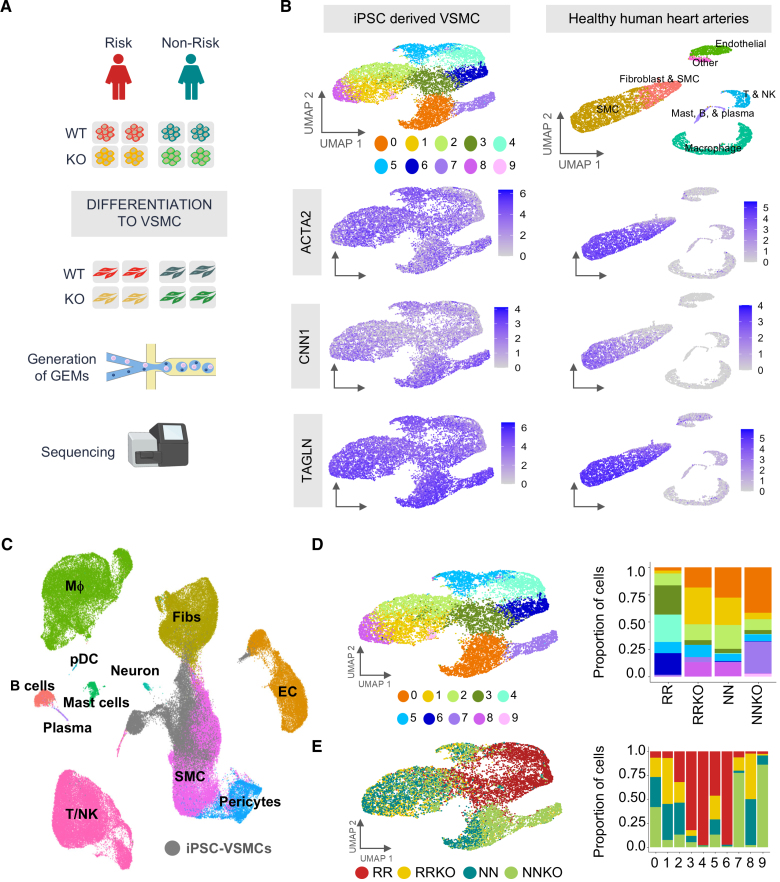
Methods: We differentiated induced pluripotent stem cells (iPSCs) from risk, nonrisk donors at 9p21.3, and isogenic knockouts into vascular smooth muscle cells (VSMCs). We performed single-cell transcriptomic profiling, including coembedding and comparison with publicly available human arterial data sets. We conducted functional characterization using migration and calcification assays and confirmed our findings on iPSC-VSMCs derived from additional donors. Finally, we used overexpression of ANRIL followed by gene expression analysis.

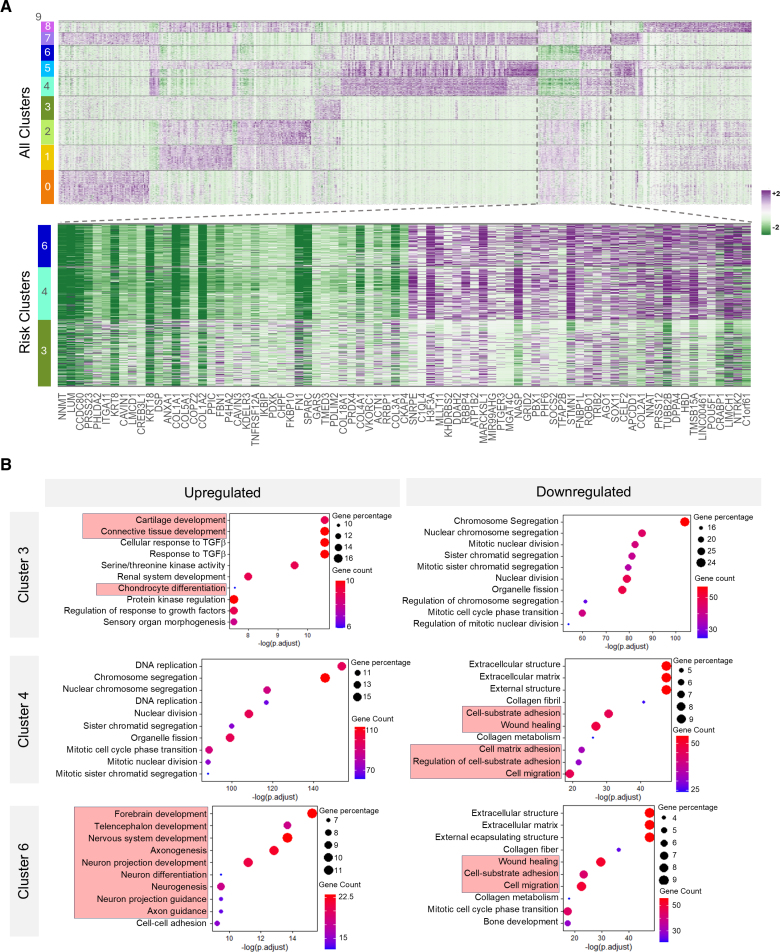
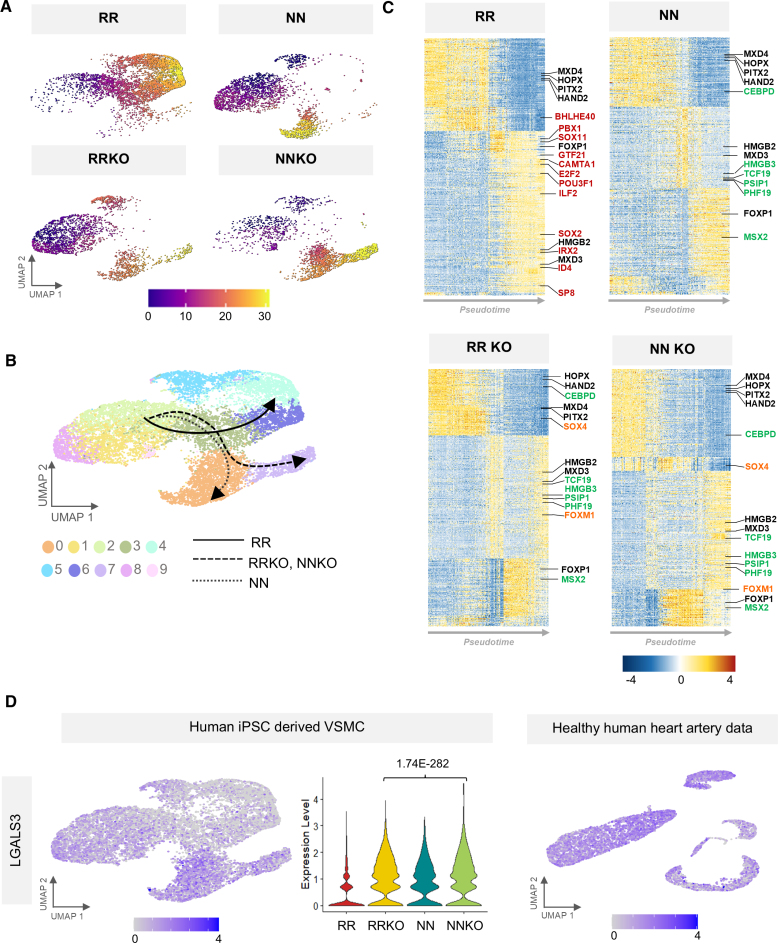
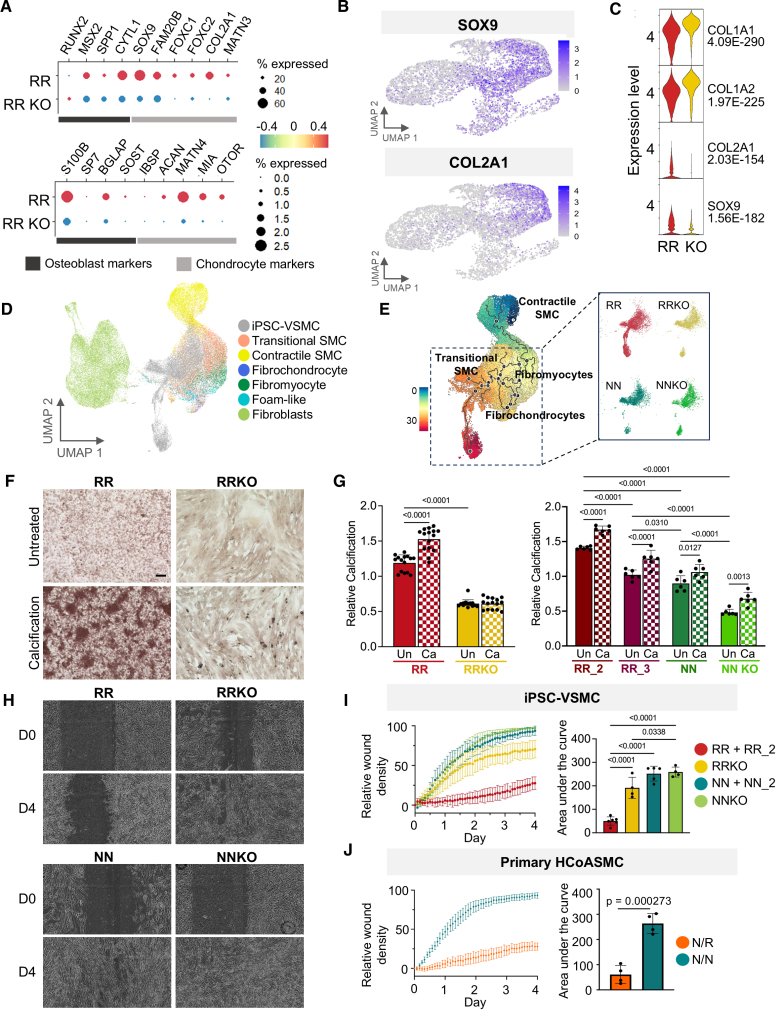
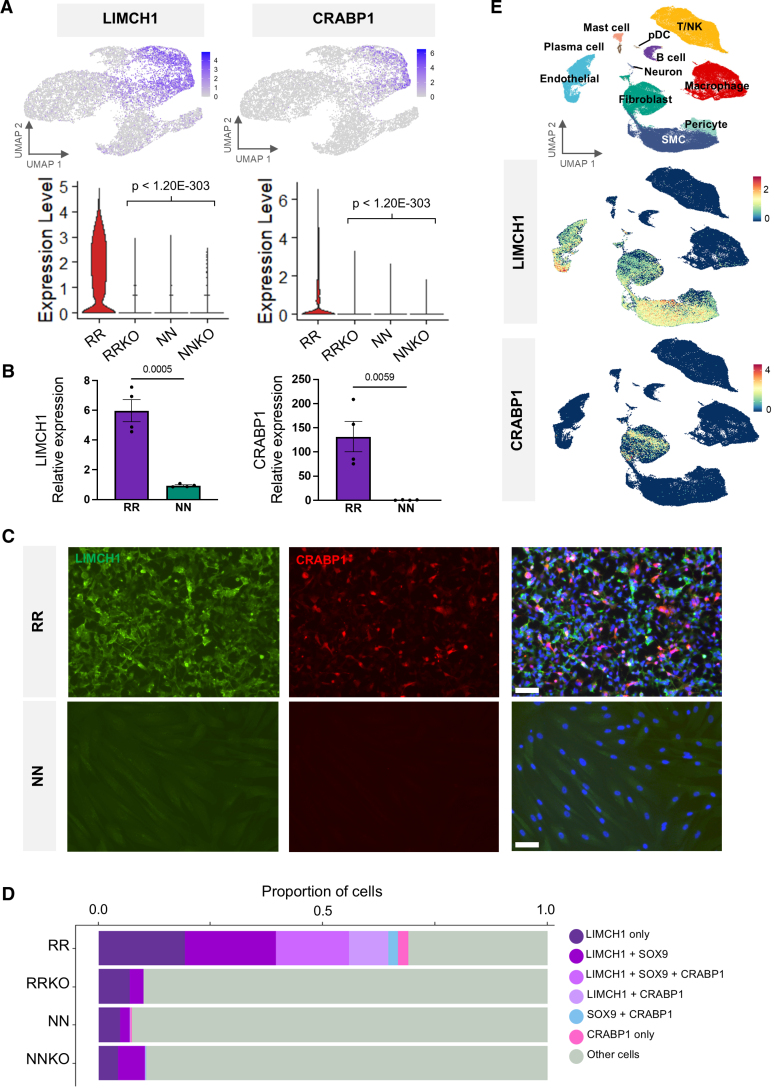
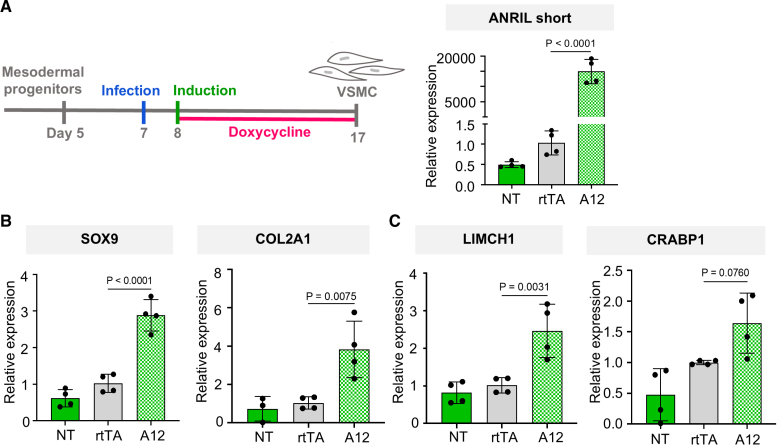
Results: We demonstrated that iPSC-VSMCs harboring the 9p21.3 risk haplotype preferentially adopt an osteochondrogenic state and show remarkable similarity to fibrochondrocytes from human artery tissue. The transcriptional profile and functional assessment of migration and calcification capacity across iPSC-VSMC lines from multiple donors concordantly resemble an osteochondrogenic state. Importantly, we identified numerous transcription factors driving different VSMC state trajectories. Additionally, we prioritized LIMCH1 and CRABP1 as signature genes critical for defining the risk transcriptional program. Finally, overexpression of a short isoform of ANRIL in 9p21.3 knockout cells was sufficient to induce the osteochondrogenic transcriptional signature.

Conclusions: Our study provides new insights into the mechanism of the 9p21.3 risk locus and defines its previously undescribed role in driving a disease-prone transcriptional and functional state in VSMCs concordant with an osteochondrogenic-like state. Our data suggest that the 9p21.3 risk haplotype likely promotes arterial calcification, through altered expression of ANRIL, in a cell type-specific and cell-autonomous manner, providing insight into potential risk assessment and treatment for carriers.

Keywords: coronary artery disease; genomics; linkage disequilibrium; lncRNA; polymorphism, single nucleotide; smooth muscle cells.


Conflict of interest statement

C.L. Miller received grant support from AstraZeneca for unrelated work. The other authors report no conflicts.

Figures

Figure 1.
Figure 1.
Induced pluripotent stem cell–derived vascular smooth muscle cells (iPSC-VSMCs) are reflective of ex vivo human smooth muscle cells (SMCs) and reveal a 9p21.3 risk-specific transcriptional profile. A, Schematic of experimental workflow. Induced pluripotent stem cells (iPSCs) are from 1 homozygous risk donor and 1 homozygous nonrisk donor, both males with intact 9p21.3 locus. Isogenic knockout lines for each genotype were derived by TALEN (transcription activator-like effector nucleases)-mediated haplotype editing to delete the entire coronary artery disease (CAD) region. Two clones per genotype (n=8) were differentiated to vascular smooth muscle cells (VSMCs) and used for single-cell RNA sequencing (scRNA-seq). B, Uniform manifold approximation and projections (UMAPs) of scRNA-seq data from iPSC-VSMCs collected at day 17 in 4 genotypes (RR-NN-RRKO-NNKO; left) and UMAPs for ex vivo healthy human artery data from Hu et al (right). Topmost UMAPs are colored by unbiased clustering in the iPSC-VSMCs and by cell type in the ex vivo data. Other UMAPs show expression of SMC markers in both data sets. C, Projection of iPSC-VSMCs in the Metaplaq atlas of ex vivo human artery cells from Mosquera et al. D, UMAP shows iPSC-VSMC single-cell transcriptome colored by unbiased clustering (left) and relative quantification of cluster contribution to each genotype (right). E, UMAP shows iPSC-VSMC transcriptome colored by genotype (left) and relative quantification of genotype contribution to each cluster (right).
Figure 2.
Figure 2.
Differential gene expression analysis and gene ontology (GO) enrichment reveal unique patterns of expression in RR vascular smooth muscle cells (VSMCs). A, Top heatmap shows the top 10% genes by adjusted P value driving each cluster (based on differential expression analysis) as they are expressed across all clusters. Bottom heatmap shows genes expressing uniformly and uniquely among risk clusters. B, The top 10 GO terms enriched in the differentially expressed genes driving each RR cluster (3-4-6). Left, GO terms enriched in the upregulated genes. Right, GO terms enriched in the downregulated genes. Highlighted in red are the pathways of interest.
Figure 3.
Figure 3.
9p21.3 RR vascular smooth muscle cells (VSMCs) show a divergent state trajectory. A, Pseudotime analysis for each genotype. B, Reconstruction of each genotype trajectory superimposed on a uniform manifold approximation and projection (UMAP) colored by cluster. C, Heatmap showing the top 500 genes driving the trajectory of each genotype. Genes annotated are transcription factors (TFs). TFs in black are common to all trajectories, red TFs are only present in the risk trajectory, green TFs are present in all genotypes lacking the risk haplotype (NN, NNKO, and RRKO), and orange TFs are only present in the knockout trajectories. D, UMAP showing expression of LGALS3 in induced pluripotent stem cell–derived vascular smooth muscle cells (iPSC-VSMCs; left), violin plot showing the expression of LGALS3 across genotypes with P value calculated via nonparametric Wilcoxon rank-sum test (middle), and UMAP of LGALS3 expression in healthy human artery data from Hu et al (right).
Figure 4.
Figure 4.
RR vascular smooth muscle cells (VSMCs) acquire an osteochondrogenic-like state. A, Bubble plots of osteoblast and chondrocyte markers in RR and RRKO. B, Uniform manifold approximation and projections (UMAPs) showing upregulation of SOX9 and COL2A1 in risk VSMCs. C, Violin plots showing expression of SOX9, COL2A1, COL1A1, and COL1A2 in RR VSMCs and isogenic RRKO, with P values calculated by nonparametric Wilcoxon rank-sum test. D, Secondary annotation of induced pluripotent stem cell–derived vascular smooth muscle cells (iPSC-VSMCs) and ex vivo smooth muscle cell (SMC)/fibroblast (from the study by Mosquera et al) harmonization showing modulated subpopulations. E, Pseudotime analysis of harmonized iPSC-VSMCs and Metaplaq SMC/fibroblasts showing the trajectory of iPSC-VSMCs and profiles of specific genotypes in the insert to the right. F, Alizarin red staining of iPSC-VSMCs from RR and RRKO genotypes. Cells were untreated or treated for 7 days with a calcification media. Scale bar is 100 µm. G, Quantification of Alizarin red for RR cells and RRKO (left); n=15 (5 fields of view for 3 independent calcification experiments; left). Alizarin red staining for risk VSMCs from 2 additional donors (RR_2 and RR_3), NN and NNKO lines (right); n=6 (3 fields of view for 2 independent calcification experiments). Data are presented as mean±SD. P value is calculated with 1-way ANOVA with Bonferroni correction. H, Wound/scratch assay of iPSC-VSMCs with different genotypes at 9p21.3 over time. I, Graph of cell migration assay for iPSC-VSMCs of all genotypes (n=4 for RRKO and NNKO and n=6 for RR and NN including the isogenic RR and NN lines and 2 additional donors; RR_2 and NN_2). Breakout of the graph in Figure S9. Wound resolution is plotted over time (left), and statistical analysis of area under the curve (AUC) is on the right. Data are presented as mean±SD, and P value is calculated via 1-way ANOVA with Bonferroni correction. All cell lines in F through I are males. J, Cell migration assay for primary human coronary artery smooth muscle cells (HCoASMCs) plotted over time. Data are from 4 cell lines derived from 4 independent donors, 2 per genotype (heterozygous risk/non risk, NR and homozygous non risk, NN). AUC is on the right. Data are presented as mean±SD and P value is calculated via the unpaired t test. Lines are 3 males (2 NN and 1 NR) and 1 female (NR).
Figure 5.
Figure 5.
Identification of 9p21.3 risk vascular smooth muscle cell (VSMC) signature. A, Uniform manifold approximation and projections (UMAPs) showing upregulation of LIMCH1 (LIM and calponin homology domains 1) and CRABP1 (cellular retinoic acid binding protein 1) in induced pluripotent stem cell–derived vascular smooth muscle cells (iPSC-VSMCs; top); violin plots showing expression across genotypes (bottom). P value calculated via nonparametric Wilcoxon rank-sum test. B, qPCR (quantitative polymerase chain reaction) of LIMCH1 and CRABP1 enrichment in 4 additional donors (RR_2, RR_3, NN_2, and NN_3) in 2 independent VSMC differentiation experiments. n=4. Data are presented as mean±SD, and P value is calculated via the unpaired t test. C, Immunocytochemistry staining for LIMCH1 and CRABP1 in RR and NN VSMCs. White bar indicates 50 µm. D, Bar chart showing proportions of cells in different genotypes expressing LIMCH1, SOX9, and CRABP1. E, Metaplaq atlas of human artery samples labeled with cell types (top), LIMCH1 and CRABP1 expression in Metaplaq atlas. Data in this figure are all generated from male cell lines.
Figure 6.
Figure 6.
ANRIL induces osteochondrogenic signature genes. A, Experimental diagram showing the ANRIL (antisense non-coding RNA in the INK4 locus) 12 overexpression experiment (left). Quantification via qPCR (quantitative polymerase chain reaction) of ANRIL overexpression in NNKO cells not infected (NT), infected with reverse tetracycline transactivator (rtTA), and infected with rtTA+ANRIL 12 (A12; right). B, Quantification of the expression of key osteochondrogenic markers SOX9 and COL2A1 in response to ANRIL 12 overexpression. Cells (male) not infected (NT) and infected with only rtTA are shown as controls. C, Quantification of the expression of risk markers LIMCH1 and CRABP1. n=4. Data are presented as mean±SD, and P value is calculated by 1-way ANOVA with Bonferroni correction.

Update of

Similar articles

References

    1. Tcheandjieu C, Xiao K, Tejeda H, Lynch JA, Ruotsalainen S, Bellomo T, Palnati M, Judy R, Klarin D, Kember RL, et al. ; Regeneron Genetics Center. High heritability of ascending aortic diameter and trans-ancestry prediction of thoracic aortic disease. Nat Genet. 2022;54:772–782. doi: 10.1038/s41588-022-01070-7 - PubMed
    1. Vries PS de, Conomos MP, Singh K, Nicholson CJ, Jain D, Hasbani NR, et al. . Whole-genome sequencing uncovers two loci for coronary artery calcification and identifies ARSE as a regulator of vascular calcification. Nat Cardiovasc Res. 2023;2:1159–1172. doi: 10.1038/s44161-023-00375-y - PMC - PubMed
    1. Koyama S, Ito K, Terao C, Akiyama M, Horikoshi M, Momozawa Y, Matsunaga H, Ieki H, Ozaki K, Onouchi Y, et al. . Population-specific and trans-ancestry genome-wide analyses identify distinct and shared genetic risk loci for coronary artery disease. Nat Genet. 2020;52:1169–1177. doi: 10.1038/s41588-020-0705-3 - PubMed
    1. Nikpay M, Goel A, Won H-H, Hall LM, Willenborg C, Kanoni S, Saleheen D, Kyriakou T, Nelson CP, Hopewell JC, et al. . A comprehensive 1000 Genomes–based genome-wide association meta-analysis of coronary artery disease. Nat Genet. 2015;47:1121–1130. doi: 10.1038/ng.3396 - PMC - PubMed
    1. Buniello A, MacArthur JAL, Cerezo M, Harris LW, Hayhurst J, Malangone C, McMahon A, Morales J, Mountjoy E, Sollis E, et al. . The NHGRI-EBI GWAS Catalog of published genome-wide association studies, targeted arrays and summary statistics 2019. Nucleic Acids Res. 2019;47:D1005–D1012. doi: 10.1093/nar/gky1120 - PMC - PubMed

MeSH terms

Substances