. 2025 Mar 18;16(16):6755-6762.
doi: 10.1039/d5sc00617a. eCollection 2025 Apr 16.

Palladium/norbornene-catalyzed C-H bond activation and annulation to construct polycyclic aromatic hydrocarbon-based fluorescent materials

Affiliations

Palladium/norbornene-catalyzed C-H bond activation and annulation to construct polycyclic aromatic hydrocarbon-based fluorescent materials

Chunlin Zhou et al. Chem Sci. .

Abstract

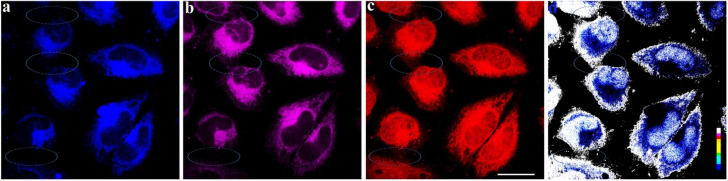
Reported herein is the first example of NBE-CO2Me-mediated palladium-catalyzed C-H bond activation and annulation of bromo(hetero)aromatics to construct structurally diverse polycyclic aromatic hydrocarbon (PAH)-based fluorescent materials. The approach shows a broad substrate scope and provides straightforward access to screening high-performance fluorescent materials. A novel organic single-molecule white-light material with anti-Kasha dual-emission characteristics has been developed herein. Furthermore, the anti-Kasha dual-emission material was fabricated as water-dispersed nanoparticles (NPs) to target the mitochondria of living cells. The corresponding NPs could be further applied in two-channel emission intensity ratio imaging to observe the cellular local imaging information and the intercellular structure.


Conflict of interest statement

There are no conflicts to declare.

Figures

Scheme 1
Scheme 1. Polycyclic aromatic hydrocarbon (PAH)-based fluorescent materials and synthetic routes.
Scheme 2
Scheme 2. Substrate scope of bromides. Reaction conditions: 1 (0.1 mmol), 2 (0.2 mmol), 3a (0.15 mmol), Pd(OAc)2 (10 mol%), P(2-MeC6H4)3 (25 mol%), NBE-CO2Me (1.5 equiv.), K2CO3 (4.5 equiv.), toluene (0.1 M), N2, 130 °C, 72 h. aPhDavePhos (25 mol%). bPd(OAc)2 (20 mol%), P(2-MeC6H4)3 (40 mol%). Test conditions for absorption and emission: absorption maximum in CH2Cl2 (1 × 10⁻⁶ M). Emission maximum in CH2Cl2 (5.0 × 10⁻⁵ M). Excitation slit: 2.5 nm, emission slit: 1.0 nm. λex = 370 nm, PMT voltage = 700 V. Test parameters for quantum yield: scan slit: 0.55, fixed/offset slit: 2.5, detector: PMT-900.
Scheme 3
Scheme 3. Substrate scope of alkynes. Reaction conditions: 1 (0.1 mmol), 2 (0.2 mmol), 3 (0.15 mmol), Pd(OAc)2 (10 mol%), P(2-MeC6H4)3 (25 mol%), NBE-CO2Me (1.5 equiv.), K2CO3 (4.5 equiv.), toluene (0.1 M), N2, 130 °C, 72 h. a0.05 mmol. Test conditions for absorption and emission: absorption maximum in CH2Cl2 (1 × 10⁻⁶ M). Emission maximum in CH2Cl2 (5.0 × 10⁻⁵ M). Excitation slit: 2.5 nm, emission slit: 1.0 nm. λex = 370 nm, PMT voltage = 700 V. Test parameters for quantum yield: scan slit: 0.55 nm, fixed/offset slit: 2.5 nm, detector: PMT-900.
Scheme 4
Scheme 4. Proposed reaction mechanism.
Fig. 1
Fig. 1. Anti-Kasha dual-emission characteristics of 6u and 6w. (a), (d) Excitation-wavelength-dependent fluorescence spectra of 6u (0.25 μM in DCM) and 6w (2.4 μM in toluene). (b) and (e) Molecular orbitals of the S0, S1, S3, or S4 states of 6u and 6w; (c) and (f) Jablonski diagram illustrating the anti-Kasha dual-emission mechanism of 6u and 6w.
Fig. 2
Fig. 2. Fluorescence microscopy images of HeLa cells incubated with 6w NPs (10 μM) for 2 h at 37 °C. (a) Fluorescence microscope image from channel 1 at 425–500 nm (excitation 405 nm). (b) Fluorescence microscope image from channel 2 at 500–700 nm (excitation 405 nm). (c) Fluorescence microscope image from channel 2 at 508–700 nm (excitation 488 nm). (d) The emission intensity ratio of (a) and (c) of HeLa cells (image generation by Image J software). Elliptic: mark out the intercellular structure and cellular local imaging information. The scale bar is 25.0 μm.
Fig. 3
Fig. 3. The co-staining experiments. (a) Fluorescent image of HeLa cells cultured with 6w NPs (10 μM) (λex = 552 nm, λem = 575–700 nm). (b) Fluorescent image of HeLa cells with Mito-Tracker Green (λex = 488 nm, λem = 508–540 nm). (c) Merged image of (a) and (b). (d) The Pearson correlation coefficient r = 0.87. (e) Fluorescent image of HeLa cells cultured with 6w NPs (5 μM) (λex = 552 nm, λem = 570–600 nm). (f) Fluorescent image of HeLa cells with Mito-Tracker Red (λex = 633 nm, λem = 650–700 nm). (g) Merged image of (e) and (f). (h) The Pearson correlation coefficient r = 0.85; the scale bar is 25.0 μm.

References

    1. Sinkeldam R. W. Greco N. J. Tor Y. Chem. Rev. 2010;110:2579–2619. - PMC - PubMed
    1. Berezin M. Y. Achilefu S. Chem. Rev. 2010;110:2641–2684. - PMC - PubMed
    1. Li B. Ali A. I. M. Ge H. Chem. 2020;6:2591–2657.
    1. Wang K. Zhang J. Hu R. Liu C. Bartholome T. A. Ge H. Li B. ACS Catal. 2022;12:2796–2820.
    1. Riegera R. Müllen K. J. Phys. Org. Chem. 2010;23:315–325.

LinkOut - more resources