Preoperative Expectations for Elective vs Nonelective Foot and Ankle Patients
- PMID: 40144530
- PMCID: PMC11938519
- DOI: 10.1177/24730114251322431
Preoperative Expectations for Elective vs Nonelective Foot and Ankle Patients
Abstract
Background: Orthopaedic patients' expectations for surgical treatment are often disparate compared with those of their surgeon. There is increasing interest in assessing and understanding patient preoperative expectations and their potential association with postoperative satisfaction. Previous literature has found several predictors of patient-provider discrepancies in expectations for elective orthopaedic surgery, although no studies have included patients undergoing surgery for traumatic injuries. The aim of this study was to determine if there are differences in expectations between patients undergoing elective vs nonelective foot and ankle surgeries.
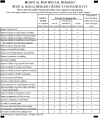
Methods: A prospective study of adult foot and ankle patients was performed over 6 months (October 2023-March 2024). At the time of preoperative evaluation, patients and their surgeon each independently completed a validated Foot and Ankle Surgery Expectations Survey, developed by the Hospital for Special Surgery. For each survey, the total number of expectations for which a respondent anticipated at least "a little improvement" were counted, giving the Number of Expected Areas of Improvement (NEAI); and a validated Aggregate Score (AS), capturing the overall magnitude of expectations, was calculated. Average NEAI and AS for each patient group were calculated and analyzed in regression models that included several demographic covariates.
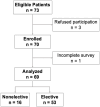
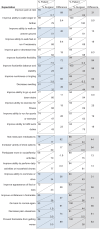
Results: Sixty-nine patients were prospectively enrolled, 53 (76%) elective and 16 (24%) nonelective. The groups were demographically similar except for race. Patient expectations did not differ significantly between groups in NEAI or AS (P = .988, P = .462). Surgeon expectations were significantly lower both in NEAI and AS than those of patients in both groups (P < .001). Of the covariates tested in this study, increasing patient body mass index was the only significant predictor of increased patient-surgeon discrepancy (P = .005).
Conclusion: This study confirms previous findings that surgeons have lower preoperative expectations than patients who undergo orthopaedic foot and ankle surgery. This exploratory study suggests that neither patients' nor providers' overall expectations differ between elective and nonelective foot and ankle surgeries.
Level of evidence: Level III, prospective observational study.
Keywords: elective procedures; expectations; foot and ankle; fracture; patient-reported outcomes; trauma.
© The Author(s) 2025.
Conflict of interest statement
The author(s) declared no potential conflicts of interest with respect to the research, authorship, and/or publication of this article. Disclosure forms for all authors are available online.
Figures


References
-
- Calixto LF, Pedreros R, Castañeda JF. Translation, validation, and cultural adaptation of the HSS-ES scale (Hospital for Special Surgery’s [HSS] Shoulder Surgery Expectations Survey). Rev Esp Cir Ortop Traumatol. 2023;67(3):188-192. - PubMed
-
- Cody EA, Do HT, Koltsov JCB, Mancuso CA, Ellis SJ. Influence of diagnosis and other factors on patients’ expectations of foot and ankle surgery. Foot Ankle Int. 2018;39(6):641-648. - PubMed
-
- Cody EA, Mancuso CA, Burket JC, Marinescu A, MacMahon A, Ellis SJ. Patient factors associated with higher expectations from foot and ankle surgery. Foot Ankle Int. 2017;38(5):472-478. - PubMed
-
- Cody EA, Mancuso CA, MacMahon A, et al. Development of an expectations survey for patients undergoing foot and ankle surgery. Foot Ankle Int. 2016;37(12):1277-1284. - PubMed
-
- Henry JK, Barth K, Cororaton A, et al. Association of depression and anxiety with expectations and satisfaction in foot and ankle surgery. J Am Acad Orthop Surg. 2021;29(16):714-722. - PubMed
LinkOut - more resources
Full Text Sources
Research Materials
