. 2025 May 1;152(9):dev204506.
doi: 10.1242/dev.204506. Epub 2025 May 1.

Optogenetic control of Nodal signaling patterns

Affiliations

Optogenetic control of Nodal signaling patterns

Harold M McNamara et al. Development. .

Abstract

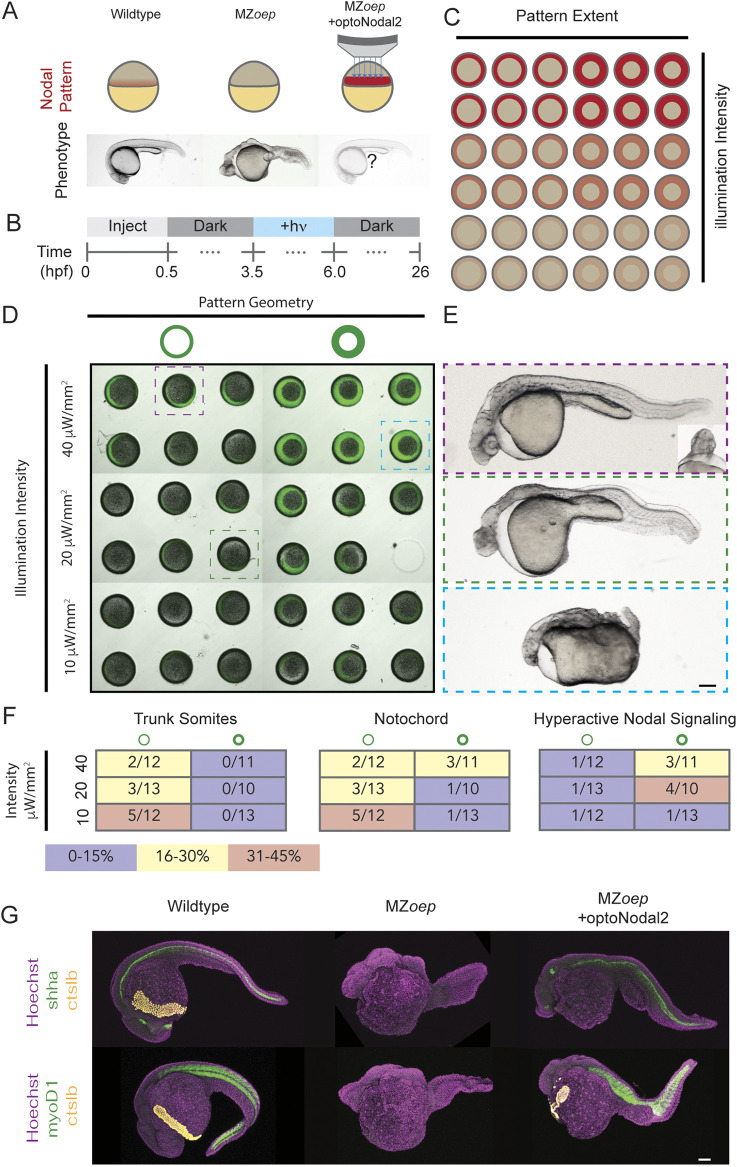
A crucial step in early embryogenesis is the establishment of spatial patterns of signaling activity. Tools to perturb morphogen signals with high resolution in space and time can help reveal how embryonic cells decode these signals to make appropriate fate decisions. Here, we present new optogenetic reagents and an experimental pipeline for creating designer Nodal signaling patterns in live zebrafish embryos. Nodal receptors were fused to the light-sensitive heterodimerizing pair Cry2/CIB1N, and the type II receptor was sequestered to the cytosol. The improved optoNodal2 reagents eliminate dark activity and improve response kinetics, without sacrificing dynamic range. We adapted an ultra-widefield microscopy platform for parallel light patterning in up to 36 embryos, and demonstrated precise spatial control over Nodal signaling activity and downstream gene expression. Patterned Nodal activation drove precisely controlled internalization of endodermal precursors. Furthermore, we used patterned illumination to generate synthetic signaling patterns in Nodal signaling mutants, rescuing several characteristic developmental defects. This study establishes an experimental toolkit for systematic exploration of Nodal signaling patterns in live embryos.

Keywords: Gastrulation; Mesendodermal patterning; Morphogen; Nodal signaling; Optogenetics; Zebrafish.


Conflict of interest statement

Competing interests A.F.S. serves on the scientific advisory board of Novartis. H.M.M. is a co-founder and scientific advisor for C16 Biosciences.

Figures

Fig. 1.
Fig. 1.
Improved optoNodal2 reagents based on Cry2-Cib1N heterodimerization. (A) Schematic of previously developed LOV-based optoNodal reagents (Sako et al., 2016). Type I and type II receptors are tethered to the membrane via a myristoylation motif (top). Blue light induces homodimerization between LOV domains, activating Nodal signaling (bottom). (B) Schematic of OptoNodal2 reagents. The myristoylation motif is removed from the type II receptor, localizing it to the cytoplasm (top). Blue light induces heterodimerization of Cry2 and Cib1N, activating Nodal signaling (bottom). (C) Blue light intensity responses for optoNodal (top row) and optoNodal2 (bottom row) reagents. Mvg1 embryos injected with indicated reagents (15 pg per receptor mRNA) were illuminated for 1 h with 470 nm light at sphere stage at the indicated intensity. Nodal signaling was measured by α-pSmad2 immunostaining (green). Images are maximum intensity projections of representative embryos. Scale bar: 100 µm. Staining heterogeneity likely represents uneven dispersal of injected mRNA. (D) Quantification of Nodal signaling activity from C. α-pSmad2 staining intensity was extracted from segmented nuclei in optoNodal (red) and optoNodal2 (blue) treatment groups; each point represents the average nuclear staining intensity from replicate embryos. Number of replicate embryos for each condition are indicated in the corresponding images in C. Data are mean±s.e.m. Dashed curves depict cubic smoothing spline interpolations. (E) Measurement of response kinetics for optoNodal (top row) and optoNodal2 (bottom row) reagents. Mvg1 embryos injected with indicated reagents (15 pg per receptor mRNA) were illuminated for 20 min with 470 nm light (20 µW/mm2 average power) at dome stage. Nodal signaling was measured by α-pSmad2 immunostaining (green). Images are maximum intensity projections of representative embryos. (F) Quantification of Nodal signaling activity from E. α-pSmad2 staining intensity was extracted from segmented nuclei in optoNodal (red) and optoNodal2 (blue) treatment groups; each point represents the average nuclear staining intensity from replicate embryos. Number of replicate embryos for each condition are indicated in the corresponding images in E. Data are mean±s.e.m. Dashed curves depict cubic smoothing spline interpolations. Background intensity of unilluminated embryos at the 110 min timepoint are included (−hν) to indicate baseline levels of signaling activity.
Fig. 2.
Fig. 2.
Platform for spatial and temporal patterning of Nodal signaling activity. (A) Schematic of patterning experiment. One-cell wild-type embryos were injected with mRNA encoding optoNodal2 receptors (15 pg per receptor). At sphere stage, embryos were mounted in custom array mounts compatible with an upright microscope. Spatial patterns of light were generated using an ultra-widefield microscope incorporating a DMD-based digital projector (Fig. S4). Patterns were applied with average intensity of 20 µW/mm2. (B) Experimental timeline. Embryos were injected with optoNodal2 mRNAs (15 pg per receptor mRNA) at the one-cell stage. Embryos were kept in the dark until 4 hpf. Embryos stained for pSmad2 (D) were illuminated from 4-4.3 hpf, while embryos stained for lft2 or noto expression (E,F) were illuminated from 4-4.75 hpf (‘+hν' indicates illumination). All embryos were fixed immediately after light treatment. (C-F) Demonstration of spatial patterning of Nodal signaling activity and target gene expression. (C) DMD pattern masks used for spatial patterning. (D) α-pSmad2 immunostaining (green) demonstrating spatial patterning of signaling activity. (E) Spatial patterning of noto gene expression (cyan). (F) Spatial patterning of lft2 gene expression (yellow). Embryos were double stained for lft2 and noto; each column of images in E and F depict the same embryo imaged in different channels. All images in D-F are maximum intensity projections derived from confocal images of a representative embryo. Scale bars: 100 µm.
Fig. 3.
Fig. 3.
Rescue of endoderm precursors and internalization movements. (A) Endoderm rescue experiment. In wild-type embryos, Nodal signaling near the margin turns on the master endoderm transcription factor sox32 at 4 hpf. By 6 hpf, sox32+ endodermal precursors have internalized, and by 9 hpf they have spread over the yolk via random walk movements. MZeop mutants lack Nodal signaling and do not specify endoderm. We rescued sox32 expression and downstream cell movements in MZoep embryos by targeted optoNodal2 stimulation at the margin from 3.75 to 6 hpf (indicated by blue bar). Embryos were injected with 30 pg of optoNodal2 mRNA. Illumination patterns had average powers of 40 µW/mm2. (B) Rescue of sox32 expression at 6 hpf expression with optoNodal2 stimulation. sox32+ cells were visualized by hybridization chain reaction in wild type (top row), MZoep (middle row) and optoNodal2-stimulated MZoep embryos (bottom row). Insets and white arrow highlight localization of sox32+ cells at the embryonic margin. Asterisk highlights Nodal-independent sox32 expression in the extra-embryonic yolk syncytial layer. (C) Rescue of cell internalization movements with optoNodal2 stimulation. sox32+ cells were visualized by HCR at 9 hpf in wild type (top row), MZoep (middle row) and optoNodal2-stimulated MZoep (bottom row). Insets depict maximum intensity projections of middle confocal slices to visualize the hypoblast cell layer. sox32+ cells reside in the hypoblast in wild-type and optoNodal2-treated embryos at 9 hpf. Scale bars: 100 µm.
Fig. 4.
Fig. 4.
Optogenetic rescue of Nodal signaling mutant phenotypes. (A) Experimental overview. The absence of Nodal signaling in MZoep mutants (middle) results in loss of nearly all mesendodermal tissues. We injected optoNodal2 mRNA (15 pg/receptor) into one-cell stage MZoep embryos and replaced endogenous Nodal signaling with patterned optogenetic stimulation (bottom). (B) Experimental timeline. Illumination patterns were applied from 3.5 to 6 hpf with the indicated powers. Embryos were imaged or fixed at 26 hpf. (C) Schematic of arrayed layout of Nodal patterns. Optogenetic pattern characteristics were varied along each axis of the embryo array; pattern geometry was varied left-to-right, and pattern intensity was varied top-to-bottom. (D) Visualization of stimulation patterns. Applied patterns (green) were visualized by projecting pattern masks with 560 nm illumination and observing fluorescence from a co-injected mCherry mRNA. Each combination of pattern geometry and intensity was tested in five or six replicate embryos in the depicted experiment. The 26 hpf phenotypes of boxed embryos are highlighted in C. (E) Example rescue phenotypes. Example of a partial rescue phenotype (top), exhibiting notochord, trunk somites and partial rescue of cyclopia. Weaker intensity stimulation (middle) resulted in weaker rescue, with incomplete specification of trunk somites and notochord. Combining high intensity and large-area stimulation led to phenotypes reminiscent of Nodal gain-of-function (bottom, e.g. lefty1;lefty2 double mutants). Scale bar: 100 µm. (F) Quantification of rescue phenotype frequencies for trunk somites (left), notochord (middle) and embryo disruption due to hyperactive Nodal signaling (right). Phenotypes were assessed by visual inspection of transmitted light images. (G) Visualization of marker gene expression for Nodal-dependent tissues. Top row: expression of notochord (shha, green) and hatching gland (ctslb, yellow) markers. Bottom row: expression of somite (myod1, green) and hatching gland (ctslb, yellow) markers. Scale bar: 100 µm.

Update of

References

    1. Attisano, L. and Wrana, J. L. (2002). Signal transduction by the TGF-β superfamily. Science 296, 1646-1647. 10.1126/science.1071809 - DOI - PubMed
    1. Beyer, H. M., Juillot, S., Herbst, K., Samodelov, S. L., Müller, K., Schamel, W. W., Römer, W., Schäfer, E., Nagy, F., Strähle, U.et al. (2015). Red light-regulated reversible nuclear localization of proteins in mammalian cells and zebrafish. ACS Synth. Biol. 4, 951-958. 10.1021/acssynbio.5b00004 - DOI - PubMed
    1. Bisgrove, B. W., Su, Y.-C. and Yost, H. J. (2017). Maternal Gdf3 is an obligatory cofactor in Nodal signaling for embryonic axis formation in zebrafish. eLife 6, e28534. 10.7554/eLife.28534 - DOI - PMC - PubMed
    1. Bugaj, L. J. and Lim, W. A. (2019). High-throughput multicolor optogenetics in microwell plates. Nat. Protoc. 14, 2205-2228. 10.1038/s41596-019-0178-y - DOI - PubMed
    1. Bugaj, L. J., Choksi, A. T., Mesuda, C. K., Kane, R. S. and Schaffer, D. V. (2013). Optogenetic protein clustering and signaling activation in mammalian cells. Nat. Methods 10, 249-252. 10.1038/nmeth.2360 - DOI - PubMed

MeSH terms

LinkOut - more resources