. 2025 Jun;12(23):e2500128.
doi: 10.1002/advs.202500128. Epub 2025 Mar 27.

Synergistic Modulating of Mitochondrial Transfer and Immune Microenvironment to Attenuate Discogenic Pain

Affiliations

Synergistic Modulating of Mitochondrial Transfer and Immune Microenvironment to Attenuate Discogenic Pain

Xinzhou Wang et al. Adv Sci (Weinh). 2025 Jun.

Abstract

Discogenic pain, caused by intervertebral disc degeneration (IVDD), is a prevalent and challenging condition to treat effectively. Macrophage infiltration with neural ectopic in-growth resulting from structural disturbances within the intervertebral disc (IVD) is a major cause of discogenic pain. This work systematically reveals how nanoparticles can synergistically regulate the immune microenvironment and mitochondrial communication to attenuate discogenic pain. The antioxidant metal-polyphenol nanoparticle system can sequentially regulate macrophage phenotype and mitochondrial delivery efficiency. This strategy circumvents the necessity for mitochondrial isolation and preservation techniques that are typically required in conventional mitochondrial transplantation procedures. Furthermore, it facilitates the effective and sustained delivery of mitochondria to damaged cells. In vivo, this nanoparticle formulation effectively preserves the IVD height, maintains the structural integrity of the nucleus pulposus (NP), and restores pain thresholds. Thus, this nanoplatform offers an effective approach to traditional surgical treatments for discogenic pain, with significant potential for clinical application.

Keywords: discogenic pain; macrophage; mitochondrial transfer; nanoparticles.


Conflict of interest statement

The authors declare no conflict of interest.

Figures

Scheme 1
Scheme 1
Synergistic Modulating of Mitochondrial Transfer and Immune Microenvironment to Attenuate Discogenic Pain.
Figure 1
Figure 1
Macrophage infiltration and polarization imbalance exacerbate IVDD and discogenic pain. A) Uniform manifold approximation and projection visualization showing cells inside NP tissues. B) Heatmap showing the number of potential ligand‐receptor pairs between cell groups. C) T2‐weighted magnetic resonance imaging (MRI) was utilized to procure human nucleus pulposus tissues with different degeneration degrees (Grade II and Grade V). D) Western blot analysis of CD11b and CGRP (n = 5). E) Immunohistochemical staining was performed to examine the expression of CD11b and CGRP in different degenerating tissues (n = 5). Scale bar: 100 µm. F) Experimental design, including establishment of a rat discogenic pain model and subsequent histological and behavioral pain assessments. G) Histological staining images of rat caudal spines (n = 5). Scale bar: 1 mm. H) Western blot analysis of CGRP, CD86, and CD206 (n = 5). I) Hargreaves tests detecting painful behavior in response to heat stimulation of different groups (n = 5). J) Von Frey tests detecting painful behavior in response to mechanical stimulation of different groups (n = 5). Data are expressed as mean ± standard deviation.
Figure 2
Figure 2
M2 macrophages transfer mitochondria via nanotubes to NP cells and neurons. A) Flow cytometry analysis of F4/80 and CD206 on macrophages. B) Experimental design of two different coculture systems. F4/80‐labeled macrophages separated via fluorescence‐activated cell sorting for subsequent coculture. C) Mitochondrial morphology changes as observed by TEM. Scale bar: 500 nm. D) Quantitative analysis of mitochondrial length in NP cells (n = 3). E) Quantitative analysis of mitochondrial length in neurons (n = 3). F) SEM images showing nanotubes (white dashed box) between Raw 264.7 (purple arrow) and NP cells (white arrow). Scale bar: 5 µm. G) SEM images showing nanotubes (white dashed box) between Raw 264.7 (purple arrow) and neurons (white arrow). Scale bar: 10 µm. H) Confocal image showing nanotube‐mediated mitochondrial communication between macrophages and NP cells. Scale bar: 25 µm. I) Confocal image showing nanotube‐mediated mitochondrial communication between macrophages and neurons. Scale bar: 50 µm. J) Quantification of nanotube length in SEM images (n = 20). K) Quantification of nanotube width in SEM images (n = 20). Data are expressed as mean ± standard deviation.
Figure 3
Figure 3
Mitochondrial transfer regulates the mitochondrial function of recipient cells. A) Pseudocolor images showing the proportion of double‐positive cells in different coculture systems at various time points (n = 3). B) Quantitative analysis of Mito Tracker (+) NP cell percentage over time (n = 3). C) Quantitative analysis of Mito Tracker (+) neuron percentage over time(n = 3). D) Representative images of distribution and morphology of mitochondria after different treatments (n = 3). Scale bar: 10 µm. E) ImageJ analysis of the area of mitochondria. F) Representative fluorescent images of JC‐1 staining under different treatment conditions (n = 3). Scale bar: 100 µm. G) Quantitative analysis of JC‐1 levels under different treatment conditions (n = 3). H) Flow cytometry apoptosis analysis of NP cells and neurons under different treatment conditions (n = 3). I) Quantitative analysis of apoptosis rate under different treatment conditions (n = 3). EB, Ethidium bromide. Data are expressed as mean ± standard deviation.
Figure 4
Figure 4
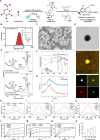
Preparation, characterization, and ROS scavenging capability of PGA‐Cu‐S@G. A) Schematic representation for the synthesis of PGA‐Cu‐S@G. B) Size distribution of PGA‐Cu‐S@G and zeta potentials of different materials. C) SEM image of PGA‐Cu‐S@G. Scale bar: 50 nm. D) TEM (Scale bar: 25 nm) and corresponding energy dispersive X‐ray spectroscopy for PGA‐Cu‐S@G. Scale bar: 50 nm. E) High‐resolution spectra of PGA‐Cu‐S@G for Cu 2p before and after H2O2 treatment. F) FTIR analysis of characteristic peaks for SS05, GAP134, and PGA‐Cu‐S@G. G) XRD of PGA‐Cu and PGA‐Cu‐S@G. H‐K) UV−vis absorbance spectra showing the radical eliminating activities of PGA‐Cu‐S@G for H) DPPH·, I) H2O2, J) ·OH, and K) ·O2 in 0.5 h (n = 3). L) DPPH·, M) H2O2 and N) ·OH temporal scavenging efficiency of PGA‐Cu‐S@G with various concentrations (n = 3). O) ·O2 scavenging efficiency of PGA‐Cu‐S@G with various concentrations (n = 3). Data are expressed as mean ± standard deviation.
Figure 5
Figure 5
Cellular internalization, lysosomal escape, and mitochondrial targeting of PGA‐Cu‐S@G. A) Evaluation of the binding ability of different materials labeled with FITC to mitochondria (n = 3). B) Experimental design of staining strategies for 3 different cell types. C) Gating strategies of 3 different cell types. Hoechst (+) and Dil (‐) cells were defined as macrophages. Hoechst (−) and Dil (+) cells were defined as neurons. Hoechst (−) and Dil (−) cells were defined as NP cells. Flow cytometry was used to measure fluorescence intensity in the FITC channel, reflecting the rate of PGA‐Cu‐S@G internalization by different cells. D) Quantification of FITC mean fluorescence intensity in 3 different cell types (n = 3). E) Flow cytometry analysis of PGA‐Cu‐S@GFITC uptake and retention in macrophages over time. F) Quantification of the temporal uptake rate of PGA‐Cu‐S@GFITC by macrophages (n = 3). G) TEM image showing the localization of PGA‐Cu‐S@G in macrophage mitochondria. Scale bar: 200 µm. H) Confocal image showing Co‐localization of PGA‐Cu‐S@GFITC with Mito Tracker‐labeled mitochondria. Scale bar: 5 µm. I) Confocal image showing Co‐localization of PGA‐Cu‐S@GFITC with Lyso Tracker‐labeled lysosome. Scale bar: 5 µm. J) Co‐localization of PGA‐Cu‐S@GFITC with Mito Tracker‐labeled mitochondria. K) Co‐localization of PGA‐Cu‐S@GFITC with Lyso Tracker‐labeled lysosome. Data are expressed as mean ± standard deviation.
Figure 6
Figure 6
In vitro therapeutic evaluation of PGA‐Cu‐S@G. A) Representative fluorescent images of Mito‐Sox staining under different treatment conditions (n = 3). Scale bar: 100 µm. B) Quantitative analysis of Mito‐Sox fluorescence intensity (n = 3). C) Flow cytometry analysis of CD86 and CD206 (n = 3). D) Quantitative analysis of mitochondrial transfer efficiency (n = 3). E) Flow cytometry analysis of JC‐1 levels under different treatment conditions (n = 3). F) Quantitative analysis of JC‐1 levels within NP cells under different treatment conditions (n = 3). G) Quantitative analysis of JC‐1 levels within neurons under different treatment conditions (n = 3). H) Immunofluorescence staining of COL2A1 in NP cells (n = 3). Scale bar: 100 µm. I) Quantitative analysis of COL2A1 fluorescence intensity (n = 3). J) Immunofluorescence staining of CGRP in neurons (n = 3). Scale bar: 100 µm. K) Quantitative analysis of CGRP fluorescence intensity (n = 3). Data are expressed as mean ± standard deviation.
Figure 7
Figure 7
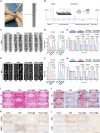
In vivo therapeutic evaluation of PGA‐Cu‐S@G. A) Intraoperative procedures for IVDD. B) Schematic illustration of animal experiments. C) X‐ray images of rat coccygeal vertebrae after different treatments (n = 5). D) DHI changes in different groups from 4 to 8 weeks after surgery (n = 5). E) MRI images of rat coccygeal vertebrae after different treatments (n = 5). F) Pfirrmann grade changes of different groups from 4 to 8 weeks after surgery (n = 5). G) Hargreaves tests detecting painful behavior in response to heat stimulation of different groups (n = 5). H) Von Frey tests detecting painful behavior in response to mechanical stimulation of different groups (n = 5). I) HE staining images of rat caudal spines (n = 5). Scale bar: 1 mm. J) SO staining images of rat caudal spines (n = 5). Scale bar: 1 mm. K) Immunohistochemistry of COL2A1 and MMP13 at 8 weeks after surgery (n = 5). Scale bar: 1 mm. L) Immunohistochemistry of CD86 and CD206 at 8 weeks after surgery (n = 5). Scale bar: 1 mm. Data are expressed as mean ± standard deviation.
Figure 8
Figure 8
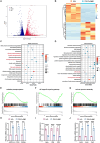
Therapeutic Mechanism of PGA‐Cu‐S@G. A) Volcano plot showing differential gene expression in H2O2 and PGA‐Cu‐S@G groups. p < 0.05, | log2(Fold Change) | ≥ 0. B) Differential gene enrichment maps in H2O2 and PGA‐Cu‐S@G groups. C) Differential gene pathway enrichment analysis (KEGG analysis). D) GO analysis of differential genes. E–G) GSEA enrichment analysis of oxidative phosphorylation, NF‐𝜅B signaling pathway, and cell‐cell junction assembly between the H2O2 and PGA‐Cu‐S@G groups. H–J) qRT‐PCR analysis of genes associated with oxidative phosphorylation, NF‐𝜅B signaling pathway, and cell‐cell junction assembly (n = 3). Data are expressed as mean ± standard deviation.

References

    1. GBD 2019 Diseases and Injuries Collaborators , Lancet 2020, 396, 1204. - PMC - PubMed
    1. GBD 2021 Neck Pain Collaborators , Lancet Rheumatol. 2024, 6, 142. - PMC - PubMed
    1. Hartvigsen J., Hancock M. J., Kongsted A., Louw Q., Ferreira M. L., Genevay S., Hoy D., Karppinen J., Pransky G., Sieper J., Smeets R. J., Underwood M., Lancet 2018, 391, 2356. - PubMed
    1. a) Luoma K., Riihimäki H., Luukkonen R., Raininko R., Viikari‐Juntura E., Lamminen A., Spine (Phila Pa 1976) 2000, 25, 487; - PubMed
    2. b) Lyu F. J., Cui H., Pan H., Cheung K. M.c, Cao X., Iatridis J. C., Zheng Z., Bone Res. 2021, 9, 7. - PMC - PubMed
    1. a) Buckwalter J. A., Spine (Phila Pa 1976) 1995, 20, 1307; - PubMed
    2. b) Fine N., Lively S., Séguin C. A., Perruccio A. V., Kapoor M., Rampersaud R., Nat. Rev. Rheumatol. 2023, 19, 136. - PubMed

LinkOut - more resources