

State Minimum Wage and Food Insecurity Among US Households With Children
- PMID: 40146110
- PMCID: PMC11950886
- DOI: 10.1001/jamanetworkopen.2025.2043
State Minimum Wage and Food Insecurity Among US Households With Children
Abstract
Importance: Food insecurity among households with children and economic hardship is a persistent US challenge. Federal food assistance programs have been unable to fully address food insecurity, leading to interest in the role other labor and economic policies could play. One relevant state-level policy that has received limited attention is the state minimum wage.
Objective: To assess whether state minimum wage generosity was associated with change in food insecurity among households with children and explore differential policy impacts across sociodemographic groups.
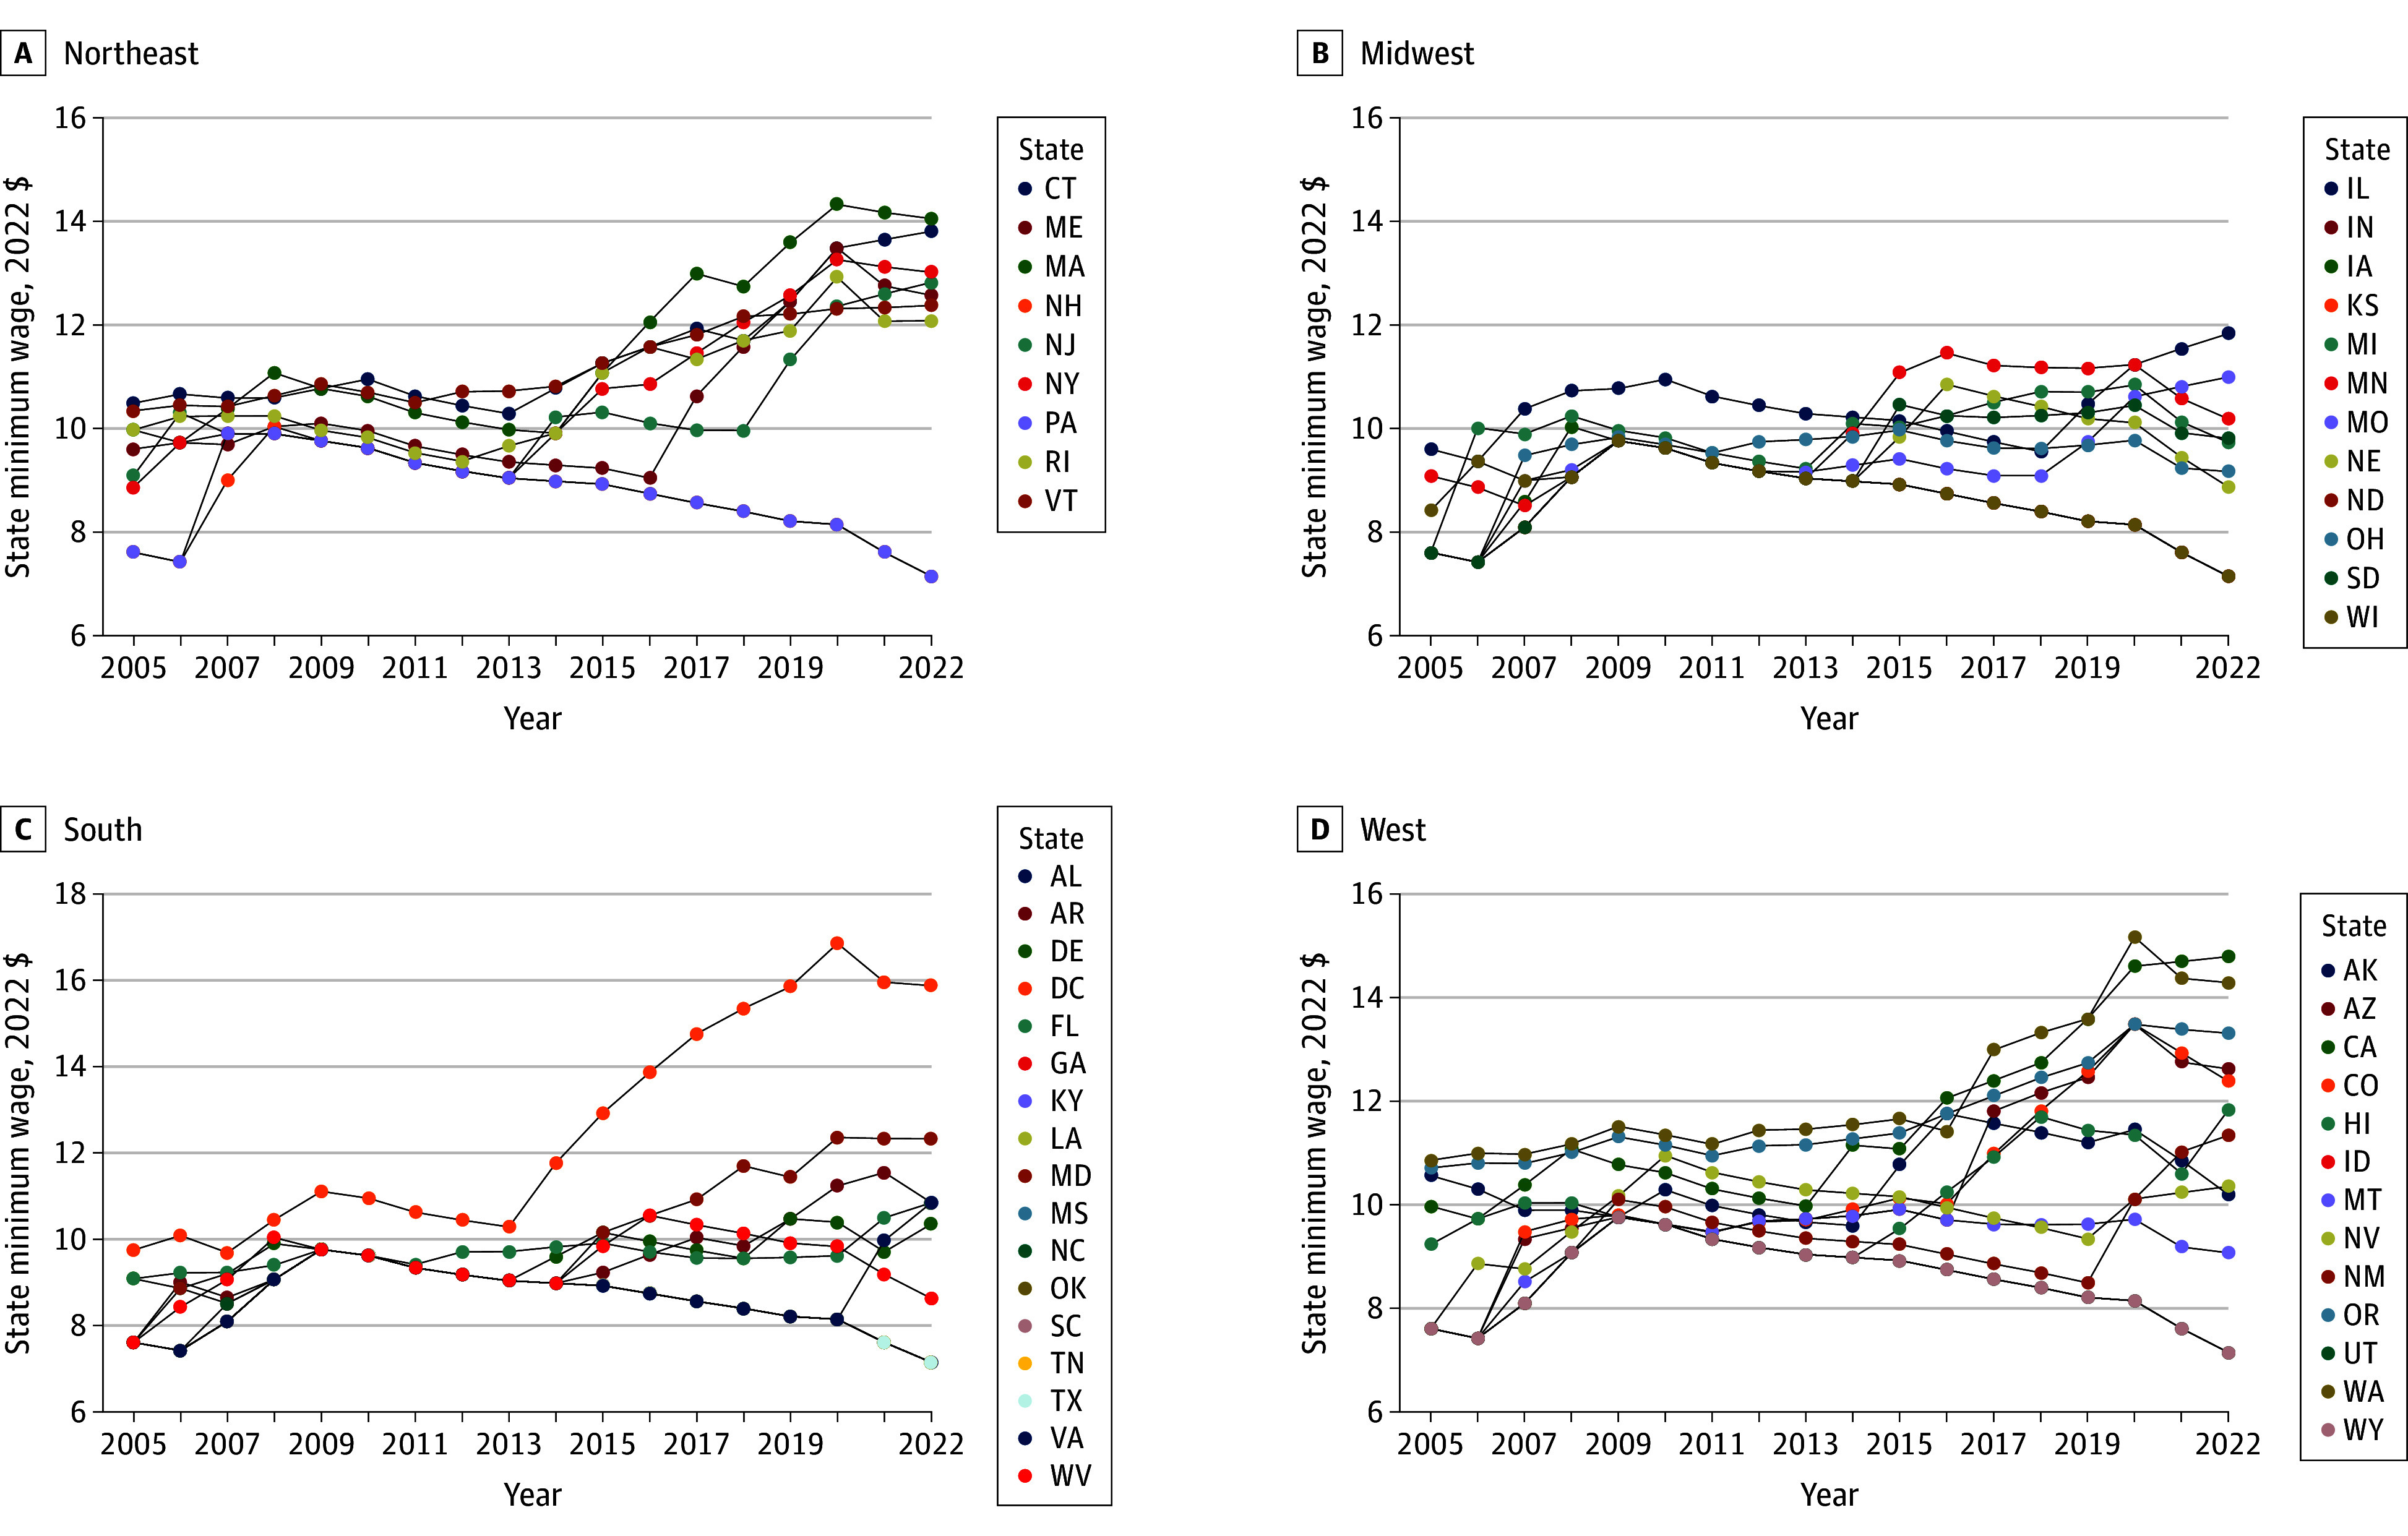
Design, setting, and participants: This cross-sectional study of a national sample of US households from the Current Population Survey used a 2-way fixed effects modeling approach to test whether increases in state minimum wage from 2005 to 2022 were associated with improvements in food insecurity controlling for household- and state-level time-varying covariates. Working households with children who were most likely to be affected by policy changes (ie, limited educational attainment) were included. Analyses were conducted in July through September 2024.
Exposure: The 2022 inflation-adjusted effective minimum wage for each state in December which was derived from legal sources.
Main outcomes and measures: Past-month household food insecurity assessed in December 2022.
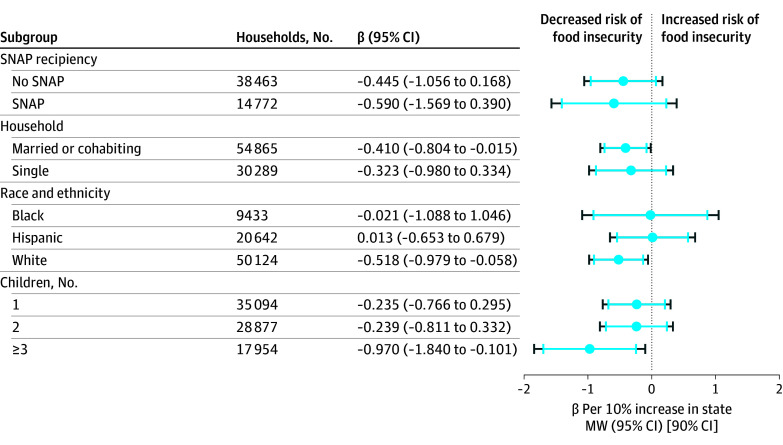
Results: The sample of 97 944 working households with children and limited educational attainment were mostly female headed (54 077 [55.2%]) with a mean (SD) 1.8 (1.1) children in the home; 22 130 households (22.6%) reported Hispanic identity, 10 545 non-Hispanic Black (10.8%), and 59 500 non-Hispanic White (60.8%). Inflation-adjusted state minimum wage ranged from $7.15 to $16.85 over the 18-year study period. We observed that a 10% increase in the state minimum wage was significantly associated with a 0.39 percentage point reduction (95% CI, -0.74 to -0.04 percentage points; P = .03) in food insecurity. There was limited evidence of differences in the association across race and ethnicity, participation in the US Supplemental Nutrition Assistance Program, or household composition.
Conclusions and relevance: In this pooled cross-sectional study, findings suggest that state legislatures that elected to increase their state minimum wage may have also improved state food security rates among households with children at risk for economic hardship. Findings provide policymakers with actionable evidence to consider in setting minimum wages that could reduce the burden of food insecurity among US children and families.
Conflict of interest statement
Figures
Comment in
- doi: 10.1001/jamanetworkopen.2025.2052
Similar articles
-
Overall and race-specific associations between state-level minimum wage policy and food insecurity in the United States.J Epidemiol Community Health. 2025 Feb 10;79(3):153-158. doi: 10.1136/jech-2024-222350. J Epidemiol Community Health. 2025. PMID: 39358012
-
State Earned Income Tax Credit and Food Security: Results Among Economically At-Risk Households With Children.Am J Prev Med. 2025 Jul;69(1):107637. doi: 10.1016/j.amepre.2025.04.007. Epub 2025 Apr 18. Am J Prev Med. 2025. PMID: 40252863
-
Changes in Food Insecurity Among US Adults With Low Income During the COVID-19 Pandemic.JAMA Netw Open. 2025 Feb 3;8(2):e2462277. doi: 10.1001/jamanetworkopen.2024.62277. JAMA Netw Open. 2025. PMID: 40019759 Free PMC article.
-
Behavioral interventions to reduce risk for sexual transmission of HIV among men who have sex with men.Cochrane Database Syst Rev. 2008 Jul 16;(3):CD001230. doi: 10.1002/14651858.CD001230.pub2. Cochrane Database Syst Rev. 2008. PMID: 18646068
-
Incentives for preventing smoking in children and adolescents.Cochrane Database Syst Rev. 2017 Jun 6;6(6):CD008645. doi: 10.1002/14651858.CD008645.pub3. Cochrane Database Syst Rev. 2017. PMID: 28585288 Free PMC article.
Cited by
-
Hungry no More? The Joint Impact of Minimum Wages and the Earned Income Tax Credit on Food Insecurity.Health Econ. 2025 Sep;34(9):1509-1517. doi: 10.1002/hec.70001. Epub 2025 Jun 10. Health Econ. 2025. PMID: 40492522 Free PMC article.
References
-
- United States Department of Agriculture Economic Research Service . Interactive Charts and Highlights. Updated January 8, 2025. Accessed August 27, 2024. https://www.ers.usda.gov/topics/food-nutrition-assistance/food-security-...
-
- United States Department of Agriculture Economic Research Service . Key Statistics & Graphics. Updated January 8, 2025. Accessed June 24, 2023. https://www.ers.usda.gov/topics/food-nutrition-assistance/food-security-...
-
- Urban Institute . The Gap between SNAP Benefits and Meal Costs, 2020–2021. Updated November 18, 2021. Accessed August 29, 2024. https://www.urban.org/data-tools/gap-between-snap-benefits-and-meal-cost...
Publication types
MeSH terms
LinkOut - more resources
Full Text Sources
Miscellaneous
