. 2025 Mar 27:14:e99217.
doi: 10.7554/eLife.99217.

CDK-mediated phosphorylation of PNKP is required for end-processing of single-strand DNA gaps on Okazaki fragments and genome stability

Affiliations

CDK-mediated phosphorylation of PNKP is required for end-processing of single-strand DNA gaps on Okazaki fragments and genome stability

Kaima Tsukada et al. Elife. .

Abstract

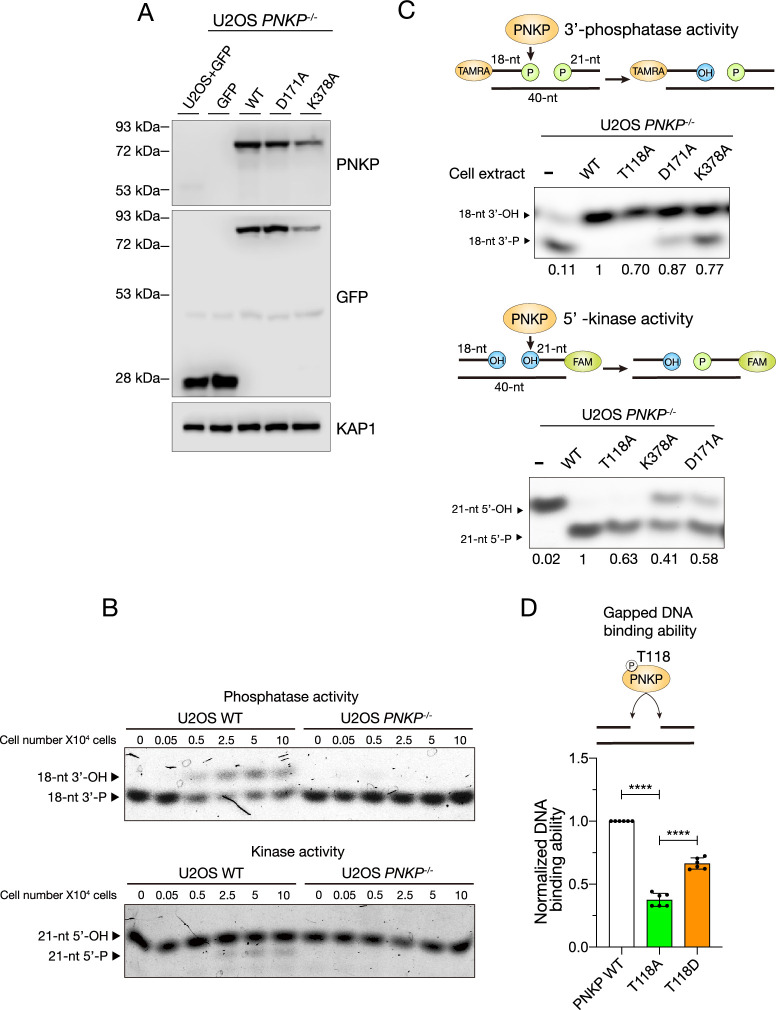
Polynucleotide kinase phosphatase (PNKP) has enzymatic activities as 3'-phosphatase and 5'-kinase of DNA ends to promote DNA ligation and repair. Here, we show that cyclin-dependent kinases (CDKs) regulate the phosphorylation of threonine 118 (T118) in PNKP. This phosphorylation allows recruitment to the gapped DNA structure found in single-strand DNA (ssDNA) nicks and/or gaps between Okazaki fragments (OFs) during DNA replication. T118A (alanine)-substituted PNKP-expressing cells exhibited an accumulation of ssDNA gaps in S phase and accelerated replication fork progression. Furthermore, PNKP is involved in poly (ADP-ribose) polymerase 1 (PARP1)-dependent replication gap filling as part of a backup pathway in the absence of OFs ligation. Altogether, our data suggest that CDK-mediated PNKP phosphorylation at T118 is important for its recruitment to ssDNA gaps to proceed with OFs ligation and its backup repairs via the gap-filling pathway to maintain genome stability.

Keywords: DNA repair; DNA replication; Okazaki fragment; PNKP; cell biology; human.


Conflict of interest statement

KT, RI, TM, KS, MS, NK, LF, MI, YM, MS No competing interests declared

Figures

Figure 1.
Figure 1.. Loss of polynucleotide kinase phosphatase (PNKP) causes delayed cell proliferation due to accumulated single-strand DNA gaps in S phase.
(A) Protein expression analysis of PNKP knockout U2OS cells (PNKP−/− cells) generated by CRISPR/Cas9 genome editing. Protein expression of PNKP in PNKP−/− clone 1 (C1) and clone 2 (C2) were confirmed by western blotting with N- and C-terminal recognized PNKP antibodies, respectively. XRCC1, XRCC4, and PCNA antibodies were used as loading controls. (B) Measurement of growth rate of U2OS WT and of PNKP−/− C1 and C2 cells. Cell numbers (shown in vertical axis) were counted at indicated time points (shown in horizontal axis). (C, D) Measurement of endogenous DNA single-strand breaks (SSBs) of PNKP−/− cells. SSBs were analyzed by immunofluorescence using PAN-ADP-ribose-binding reagents at 30 min after ionizing-radiation (IR) 2 Gy exposure in U2OS WT and PNKP−/− (C1 and C2) cells treated with 10 μM poly ADP-ribose glycohydrolase inhibitor (PARGi) for 60 min. Error bars represent standard error of the mean (SEM). (E) Measurement of SSBs, detected by ADP-ribose intensity, in U2OS WT and PNKP−/− C1 cells under hydroxyurea (HU) or Emetine (EME) treatment. Cells were pretreated with PARGi for 30 min prior to the treatment of HU or EME. ADP-ribose intensities were normalized by the intensity of non-treated (NT) U2OS. Error bars represent SEM. (F) Schematic and a representative image of experiments for measuring the formation of single-strand DNA gaps during DNA replication in U2OS WT and PNKP−/− C1 cells with S1 nuclease treatment. (G) Quantified results of DNA fiber length in U2OS WT and PNKP−/−cells with S1 nuclease. CIdU tract lengths in CldU/IdU dual-labeled DNA fibers in the indicated cell lines were plotted as scatter plots. Error bars represent standard deviation (SD). Statistical significance was indicated as not significant (ns) and ****: 0.0005 < p ≦ 0.001. (H) Model of S1 nuclease-mediated digestion of DNA fiber in PNKP−/− cells. In all panels, scale bar indicates 10 μm.
Figure 1—figure supplement 1.
Figure 1—figure supplement 1.. Generation of polynucleotide kinase phosphatase (PNKP) knockout U2OS cells by genome editing.
(A) DNA sequencing results in PNKP exon 4 of U2OS WT, PNKP−/− C1 and C2. DNA sequences of all alleles were aligned and PAM and sgRNA sequences were indicated. C1 and C2 have 2 and 3 alleles, respectively, and all reading frames were frame-shifted. ‘Purple’, ‘Light blue’, and ‘Red’ characters indicated mutations, protospacer adjacent motif (PAM), and single-guide RNA (sgRNA) sequences, respectively. ‘-’ indicates a deletion of nucleotide. (B) Targeting gene locus of CRISPR/Cas9 genome editing for generation of PNKP−/− cells. PNKP L105 and P119 located on exon 4 were targeted by Cas9 D10A.
Figure 1—figure supplement 2.
Figure 1—figure supplement 2.. Polynucleotide kinase phosphatase (PNKP)-deficient cells exhibit genomic instability to various genotoxic stresses.
(A) DNA double-strand break repair activity in PNKP−/− C1 cells measured by western blotting. DNA double-strand breaks were analyzed by pS824-KAP1 and pS139-H2AX (γ-H2AX) antibodies after indicated time points recovered from ionizing-radiation (IR) 5 Gy exposure. KAP1 and PCNA antibodies were used as loading control. p53 antibody was used as DNA damage response control. (B) Cellular sensitivity of PNKP−/− cells to the DNA damages, especially DNA double-strand breaks, was measured by colony formation assay. Cells were treated by IR exposure at indicated dose. (C–E) Schematic, representative images and measurement of DNA single-strand breaks induced by hydrogen peroxide (H2O2) in U2OS WT and PNKP−/− cells. Single-strand breaks were analyzed by a native BrdU incorporation method. (F) Cellular sensitivity of PNKP−/− cells to the DNA damages, especially DNA single-strand breaks, was measured by colony formation assay. Cells were treated by H2O2 at indicated dose. (G) Cellular sensitivity of PNKP−/− cells to the DNA replication stress was measured by colony formation assay. Cells were treated by hydroxyurea (HU) at indicated dose. (H) Flowcytometric analysis for cell cycle distribution of U2OS WT and PNKP−/− C1 and C2 cells. The cells were stained with propidium iodide (PI), and synthesized DNA was labeled by EdU. Percentage of each cell cycle is shown in vertical axis, cell types are shown in horizontal axis. Statistical analysis of S phase population between WT and PNKP−/− C1 and C2 cells was shown above each bar graph. In all panels, scale bar indicates 10 μm. Statistical significance was indicated as not significant (ns), *: 0.01< p ≦ 0.05 and ****: 0.0005 < p ≦ 0.001.
Figure 2.
Figure 2.. Polynucleotide kinase phosphatase (PNKP) is involved in Okazaki fragment maturation pathways.
(A) Quantified results of DNA fiber length in U2OS WT and PNKP−/− C1 and C2 cells. Nascent synthesized DNA was labeled by CldU. CIdU tract lengths in the indicated cell lines were plotted as scatter plots of fork speed. At least 100 fibers per sample were quantified. Error bars represent SD. (B) Measurement of DNA synthesis speed in U2OS WT cells under NT, 2 mM hydroxyurea (HU) and 10 μM FEN1 inhibitor (FEN1i) treatment analyzed by DNA fiber assay. At least 100 DNA fibers were measured. Error bars represent SD. (C) Schematic and quantified results of experiments for measuring the formation of single-strand DNA (ssDNA) gaps in U2OS WT and PNKP−/− C1 cells with 10 μM FEN1i and/or 10 μM PARP inhibitor (PARPi) treatment followed by S1 nuclease treatment. The ratio of CldU/IdU tract lengths in dual-labeled DNA fibers in the indicated cell lines and treatments were measured. Error bars represent SD. (D) Schematic and quantified results of experiments for measuring the formation of ssDNA gaps in U2OS WT and PNKP−/− C1 cells with 10 μM PARPi treatment followed by S1 nuclease treatment. The ratio of IdU/CldU tract lengths in dual-labeled DNA fibers in the indicated cell lines and treatments were measured. (E) Model of S1 nuclease-mediated digestion of DNA fiber in FEN1i- and/or PARPi-treated cells. In all panels, scale bar indicates 10 μm. Statistical significance was indicated as not significant (ns), *: 0.01< p ≦ 0.05, **: 0.005 < p ≦ 0.01 and ****: 0.0005 < p ≦ 0.001.
Figure 2—figure supplement 1.
Figure 2—figure supplement 1.. FEN1 inhibitor treatment leads to faster fork speed.
Measurement of DNA fiber tract length in U2OS WT cells under NT, 2 mM hydroxyurea (HU), and 10 μM FEN1 inhibitor treatment analyzed by DNA fiber assay. At least 100 DNA fibers were measured. Error bars represent SD. Statistical significance was indicated as not significant (ns) and ****: 0.0005 < p ≦ 0.001.
Figure 3.
Figure 3.. Phosphorylation of polynucleotide kinase phosphatase (PNKP), especially on T118, is required for cell proliferation and DNA replication.
(A) Schematic diagrams of the structure of GFP-tagged human PNKP WT and deletion mutants (D1–D4). (B) Cell growth rate in U2OS WT and PNKP deletion mutant-expressing PNKP−/− C1 cells. Cell growth rate was normalized by GFP-expressing U2OS cells. Error bars represent SEM. (C) Quantified results of DNA fiber length in U2OS WT and PNKP−/− C1 cells expressing indicated PNKP deletion mutants. Nascent synthesized DNA was labeled by CldU. Error bars represent SD. (D) Alignment of amino acid sequences in linker region among mammalian species. SQ/TQ motif (blue) is PI3 kinase substrate motif. TP (red) is cyclin-dependent kinase (CDK) substrate motif. (E) Cell growth rate in U2OS WT and PNKP−/− C1 cells expressing indicated point mutants. Cell growth rate was normalized by GFP-expressing U2OS cells. Error bars represent SEM. Statistical significance was indicated as not significant (ns), **: 0.005< p ≦ 0.01, ***: 0.001 < p ≦ 0.005 and ****: 0.0005 < p ≦ 0.001.
Figure 3—figure supplement 1.
Figure 3—figure supplement 1.. Protein expression of polynucleotide kinase phosphatase (PNKP) mutants in U2OS cells.
(A) Protein expression analysis of U2OS WT and PNKP−/− C1 cells transiently expressing GFP or indicated PNKP deletion mutants. Protein expression was detected by western blotting. GFP antibody was used for confirming the expression of exogenous PNKP deletion mutants. PNKP antibody (Novus: NBP1-87257) was used for comparing expression levels of endogenous and exogenous PNKP. KAP1 antibody was used as a loading control. ‘*’ indicates endogenous PNKP. (B, C) Protein expression analysis of U2OS WT and PNKP−/− C1 cells transiently expressing GFP or indicated PNKP point mutants. Protein expression was detected by western blotting (B) and immunofluorescence (C). (B) GFP antibody was used for confirming the expression of exogenous PNKP point mutants. PNKP antibody was used for comparing expression levels of endogenous and exogenous PNKP. KAP1 antibody was used as a loading control. ‘*’ indicates endogenous PNKP. (C) GFP fluorescence was observed by fluorescent microscope. 4′,6-Diamidino-2-phenylindole dihydrochloride (DAPI) was used as nucleus staining. In all panels, scale bar indicates 10 μm.
Figure 4.
Figure 4.. Cyclin-dependent kinases (CDKs) phosphorylate T118 on polynucleotide kinase phosphatase (PNKP) for the recruitment of PNKP to nascent DNA on replication forks.
(A) Scheme and protein expression levels of GFP-PNKP-expressing HCT116 cells after release from double thymidine block. After released, cells were collected at indicated time points, and used for western blotting. pT118 PNKP antibody was generated for this study. Cyclin A2 and E1 antibodies were used for cell cycle markers. GAPDH antibody was used as a loading control. (B) In vitro analysis of PNKP phosphorylation on T118 by CDK/Cyclin complex. Purified His-PNKP and each CDK/Cyclin complex were incubated with reaction mixture and detected with western blotting by pT118-PNKP, His, GST, and Cyclin A2 antibodies. (C) HCT116 cells were lysed at 5 and 3 days after transfection with GFP-PNKP and co-transfection with mCherry2-Cyclin A2, and 3XFLAG-CDK1 or CDK2, respectively, and applied for western blotting. pT118 PNKP level was analyzed by pT118 PNKP-specific antibody. PNKP expression was analyzed with PNKP or GFP antibodies. Cyclin A2 expression was analyzed with RFP antibody. KAP1 antibody was used as loading control. (D) Analysis of isolated proteins from nascent DNA using isolation of proteins on nascent DNA (iPOND) technique. Proteins bound to EdU-labeled DNA in GFP-PNKP-expressing HEK293 cells were isolated using click reaction with biotin-azide followed by streptavidin-pulldowns and detected by western blotting. 0.1% of lysate used in Streptavidin-pulldowns represented as 0.1% input. (E) Western blotting to show interactions of GFP-PNKP WT or T118A with nascent DNA using the iPOND technique. PCNA was used as a loading control. (F) Western blotting to show interaction of PNKP with nascent DNA in XRCC1-depleted cells using the iPOND technique. PCNA was used as a loading control.
Figure 4—figure supplement 1.
Figure 4—figure supplement 1.. Cyclin-dependent kinase (CDK)-mediated phosphorylation of polynucleotide kinase phosphatase (PNKP) on T118.
(A) Representative image of ELISA assay for pT118-PNKP antibody. Dilutions were shown in vertical axis, and ligands and antibodies were shown in horizontal axis. (B) Quantified results of A for confirming the titer and specificity of pT118-PNKP antibody. Absorbance was shown in vertical axis, and dilutions were shown in horizontal axis. (C) Specificity of pT118-PNKP antibody for cell lysate from U2OS WT and PNKP−/− C1 cells transiently expressing GFP-PNKP or GFP-PNKP T118A mutant. Asterisks indicate non-specific detections. GFP and PNKP antibodies were used for confirming the expression of GFP-PNKP and GFP-PNKP T118A mutant. GAPDH antibody was used as a loading control. (D) Flowcytometric analysis of cell cycle distribution of HCT116 cells transiently expressing GFP-PNKP at indicated time after release from double thymidine block. Cell cycle was determined by DNA contents measured by PI staining (horizontal axis). (E) Western blotting to show interactions of GFP-PNKP WT or T118A with FLAG-tagged CDK1 or CDK2. Binding proteins of GFP-PNKP were purified using a GFP-pulldown method. (F) Schematic of isolation of proteins on nascent DNA (iPOND) experiment. Proteins bound to EdU-labeled nascent DNA in HEK293 cells were isolated using click reaction with biotin-azide followed by streptavidin-pulldowns. 0.1% of lysate used in streptavidin-pulldowns represented as 0.1% input as a loading control.
Figure 5.
Figure 5.. Phosphorylation of polynucleotide kinase phosphatase (PNKP) at T118 is required for preventing the formation of unligated Okazaki fragments.
(A) Measurement of DNA synthesis speed in U2OS WT and PNKP−/− C1 cells expressing GFP, PNKP WT, T118A, or T118D mutants under 10 μM FEN1 inhibitor treatment analyzed by DNA fiber assay. At least 100 DNA fibers were measured. Error bars represent SD. (B, C) Representative images (B) and quantified results (C) of measurement of ADP-ribose intensity in U2OS WT and PNKP WT, PNKP T118-expressing PNKP−/− C1 cells. Synthesized DNA was labeled by EdU and EdU-positive cells were defined as S phase and the other cells were defined as G1 +G2 phase. Error bars represent SEM. (D, E) Scheme, representative images (D) and quantified results (E) of the experiments for measurement of ADP-ribose intensity in U2OS WT and PNKP−/− C1 cells expressing GFP, PNKP WT, and PNKP T118A mutant under DMSO (negative control) and FEN1i treatment only in EdU-positive (S phase) cells. Error bars represent SEM. In all panels, scale bar indicates 10 μm.
Figure 5—figure supplement 1.
Figure 5—figure supplement 1.. Phosphorylation of polynucleotide kinase phosphatase (PNKP) on T118 is required for maintaining genomic stability.
(A) Protein expression analysis of U2OS WT and PNKP−/− C1 cells transiently expressing GFP or indicated PNKP mutants. Protein expression was detected by western blotting. GFP antibody was used for confirming the expression of exogenous PNKP mutants. PNKP antibody was used for comparing expression levels of endogenous and exogenous PNKP. KAP1 antibody was used as a loading control. ‘*’ indicates endogenous PNKP. (B) Quantified results of the experiments for measurement of ADP-ribose intensity in PNKP−/− C1 cells expressing PNKP WT and PNKP T118D mutant under DMSO and FEN1i treatment. Error bars represent SEM. (C) Representative images of immunofluorescence using PAN ADP-ribose-binding reagents at 30 min after 2 Gy ionizing-radiation (IR) exposure in U2OS WT and PNKP−/− cells transiently expressing GFP or indicated PNKP mutants. PARGi was added 30 min prior to IR exposure. Images detected by ADP-ribose, 4′,6-diamidino-2-phenylindole dihydrochloride (DAPI) and DIC were shown. Scale bar indicates as 10 μm. (D) Quantified result of C. Relative ADP-ribose intensity is shown in vertical axis and cell types were shown in horizontal axis. At least 100 cells were analyzed for the quantification. (E) Measurement of ADP-ribose intensity in U2OS WT or PNKP−/− C1 cells expressing GFP, PNKP WT, and PNKP T118A mutant under H2O2 treatment in EdU- and EdU-positive cells. Error bars represent SEM. (F) Measurement of DNA double-strand break (DSB) repair ability of indicated cells after 2Gy IR exposure. Cells were harvested at 30 min, 6 hr, and 24 hr after IR exposure. Percentage of γH2AX-positive cells is shown in vertical axis and conditions were shown in horizontal axis. NT indicates non-treatment. At least 100 cells were analyzed for the quantification. Statistical significance was indicated as not significant (ns) and ****: 0.0005 < p ≦ 0.001. (G, H) Measurement of the formations of micronuclei and chromosome bridges in U2OS WT and PNKP−/− C1 cells expressing GFP, PNKP WT, and PNKP T118A mutant exposed to 5 Gy IR or 2 mM hydroxyurea (HU). DNA were stained by DAPI at 24 hr after each treatment. Cells with micronucleus (G) and chromosome bridge (H) were counted and graphed. At least 200 cells were counted. Error bars represent SEM. In all panels, statistical significance was indicated as not significant (ns), *: 0.01< p ≦ 0.05, **: 0.005< p ≦ 0.01, ***: 0.001 < p ≦ 0.005 and ****: 0.0005 < p ≦ 0.001.
Figure 6.
Figure 6.. Enzymatic activities of PNKP is important for the end-processing of Okazaki fragments.
(A) Measurement of the speed of DNA synthesis in U2OS WT and PNKP−/− C1 cells expressing GFP, PNKP WT, D171A, and K378A mutants under 10 μM FEN1 inhibitor treatment analyzed by DNA fiber assay. At least 100 DNA fibers were measured. Error bars represent SD. Representative images (B) and quantified results (C) of the experiments for measurement of ADP-ribose intensity in U2OS WT and PNKP−/− C1 cells expressing GFP, PNKP WT, PNKP D171A, and PNKP K378A mutants under DMSO (negative control) and FEN1i treatment only in EdU-positive (S phase) cells. Error bars represent SEM. (D) Model of the involvement of PNKP in DNA replication, especially in end-processing of canonical OFs ligation and gap-filling pathway. T118 of PNKP is phosphorylated by cyclin-dependent kinases (CDKs) for the recruitment to OFs during S phase. OFs ends are processed by PNKP and become the ligatable ends prior to the canonical OFs maturation. Unligated OFs are sensed by PARP1 for proceeding an alternative OFs maturation pathway, PARP-dependent gap filling, which requires proteins such as XRCC1, LIG3, and PNKP, to prevent the emergence of post-replicative single-strand DNA gaps. Impaired OFs maturation pathways lead to the accumulation of single-strand DNA gaps during DNA replication. In all panels, scale bar indicates 10 μm. Statistical significance was indicated as not significant (ns), *: 0.01< p ≦ 0.05 and ****: 0.0005 < p ≦ 0.001.
Figure 6—figure supplement 1.
Figure 6—figure supplement 1.. Enzymatic activity of PNKP T118A mutant.
(A) Protein expression analysis for PNKP phosphatase-dead (D171A) and kinase-dead (K378A) mutants in U2OS WT and PNKP−/− C1 cells expressing GFP, PNKP WT, D171A, and K378A mutants confirmed by western blotting. KAP1 antibody was used as a loading control. (B) Indicated number of cell extracts harvested from U2OS WT and PNKP−/− C1 cells were incubated with TAMRA or 6-FAM-labeled oligonucleotide duplex harboring a single-strand break (SSB) GAP structure. Arrows indicate the positions of the TAMRA-labeled phosphatase substrates (top) and 6-FAM-labeled kinase substrates (bottom). (C) PNKP phosphatase and kinase activity biochemical analysis. Indicated cell extracts harvested from PNKP−/− C1 cells expressing PNKP WT, T118A, D171A (phosphatase-dead), and K378A (kinase-dead) were incubated with TAMRA or 6-FAM-labeled oligonucleotide duplex harboring a single-strand DNA (ssDNA) gap structure. Arrows indicate the positions of the TAMRA-labeled phosphatase substrates (left) and 6-FAM-labeled kinase substrates (right). Band intensity of 18-nt 3′-OH (left) and 21-nt 5′-P (right) were analyzed using ImageJ software and indicated. (D) Measurement of the gapped DNA-binding ability of PNKP WT, T118A, and T118D mutants. Nuclear extracts were harvested from U2OS PNKP−/− C1 cells at 2 days after transfection with GFP-PNKP WT, T118A, or T118D mutants. GFP antibody was used to detect GFP-PNKPs bound to the gapped double-stranded DNA. Error bars represent SEM. Statistical significance was indicated as not significant (ns) and ****: 0.0005 < p ≦ 0.001.
Author response image 1.
Author response image 2.

Update of

  • doi: 10.1101/2021.07.29.452278

References

    1. Bermúdez-Guzmán L, Jimenez-Huezo G, Arguedas A, Leal A. Mutational survivorship bias: the case of PNKP. PLOS ONE. 2020;15:e0237682. doi: 10.1371/journal.pone.0237682. - DOI - PMC - PubMed
    1. Blackford AN, Jackson SPA. ATM, ATR, and DNA-PK: the trinity at the heart of the DNA damage response. Molecular Cell. 2017;66:801–817. doi: 10.1016/j.molcel.2017.05.015. - DOI - PubMed
    1. Bras J, Alonso I, Barbot C, Costa MM, Darwent L, Orme T, Sequeiros J, Hardy J, Coutinho P, Guerreiro R. Mutations in PNKP cause recessive ataxia with oculomotor apraxia type 4. American Journal of Human Genetics. 2015;96:474–479. doi: 10.1016/j.ajhg.2015.01.005. - DOI - PMC - PubMed
    1. Breslin C, Caldecott KW. DNA 3’-phosphatase activity is critical for rapid global rates of single-strand break repair following oxidative stress. Molecular and Cellular Biology. 2009;29:4653–4662. doi: 10.1128/MCB.00677-09. - DOI - PMC - PubMed
    1. Burhans WC, Vassilev LT, Wu J, Sogo JM, Nallaseth FS, DePamphilis ML. Emetine allows identification of origins of mammalian DNA replication by imbalanced DNA synthesis, not through conservative nucleosome segregation. The EMBO Journal. 1991;10:4351–4360. doi: 10.1002/j.1460-2075.1991.tb05013.x. - DOI - PMC - PubMed

MeSH terms

LinkOut - more resources